GOLD → Correction before NFP. What are the chances of a decline?FX:XAUUSD strengthens amid dollar correction. The market is correcting ahead of NonFarm Payrolls, trying to accumulate potential before high volatility.
Gold recovers ahead of US employment report
On Friday, gold rebounded from a two-week low, recouping some of its losses ahead of the release of US labor market data (NFP), which could set the tone for prices going forward. Amid optimism over trade talks and a strong dollar, gold ended its worst week in two months, but geopolitical tensions and a potentially weak jobs report could boost demand for safe-haven assets again.
The correction in the dollar gives gold a small chance to strengthen. However, fundamentally, the overall trend has already set the tone and gold may continue to fall.
Resistance levels: 3268, 3285, 3295
Support levels: 3227, 3204
The correction may reach a local zone of interest (money pool) — liquidity above 3270, or the 0.7 Fibonacci zone, after which the price may continue its course along the new trend — down to 3193.
However, unpredictable and unexpected data could disrupt the structure and push the price up to 3320-3350.
Best regards, R. Linda!
GOLDCFD trade ideas

GOLD ROUTE MAP UPDATEHey Everyone,
Great start to the week with our Bullish target at 3260 hit, followed with ema5 cross and lock opening 3308. This was hit perfectly also completing this target.
We are now seeing ema5 lock above 3308 opening 3340. Any rejections on this zone will see price testing the lower Goldturns for suport and bonce inline with our plans to buy dips within the overall structure.
We will keep the above in mind when taking buys from dips. Our updated levels and weighted levels will allow us to track the movement down and then catch bounces up.
We will continue to buy dips using our support levels taking 20 to 40 pips. As stated before each of our level structures give 20 to 40 pip bounces, which is enough for a nice entry and exit. If you back test the levels we shared every week for the past 24 months, you can see how effectively they were used to trade with or against short/mid term swings and trends.
The swing range give bigger bounces then our weighted levels that's the difference between weighted levels and swing ranges.
BULLISH TARGET
3260 - DONE
EMA5 CROSS AND LOCK ABOVE 3260 WILL OPEN THE FOLLOWING BULLISH TARGETS
3308 - DONE
EMA5 CROSS AND LOCK ABOVE 3308 WILL OPEN THE FOLLOWING BULLISH TARGET
3340
EMA5 CROSS AND LOCK ABOVE 3340 WILL OPEN THE FOLLOWING BULLISH TARGET
3382
EMA5 CROSS AND LOCK ABOVE 3382 WILL OPEN THE FOLLOWING BULLISH TARGETS
3428
EMA5 CROSS AND LOCK ABOVE 3428 WILL OPEN THE FOLLOWING BULLISH TARGETS
3478
BEARISH TARGETS
3217
EMA5 CROSS AND LOCK BELOW 3217 WILL OPEN THE BEARISH TARGETS
3174
EMA5 CROSS AND LOCK BELOW 3174 WILL OPEN THE SWING RNGE
3126
3078
EMA5 CROSS AND LOCK BELOW 3078 WILL OPEN THE SECONDARY SWING RANGE
SECONDARY SWING RANGE
3034 - 2979
As always, we will keep you all updated with regular updates throughout the week and how we manage the active ideas and setups. Thank you all for your likes, comments and follows, we really appreciate it!
Mr Gold
GoldViewFX

Lingrid | GOLD potential PULLBACK and CONTINUATIONThe price perfectly fulfilled my previous idea . OANDA:XAUUSD is accelerating off the trendline support with a sharp impulse leg and now hovering around a potential breakout zone. Momentum remains bullish as price reclaims previous highs and aims for the upper boundary of the resistance zone. The structure favors continuation as long as the trendline holds.
📌 Key Levels
Support zone: 3,345.000 (PDH and trendline convergence)
Breakout target: 3,495.000 (Resistance ceiling within the TARGET area)
Invalidation level: Below 3,345.000 and trendline breakdown ⚠️ Risks
Potential false breakout above 3,400
Failure to hold above 3,345 may trigger deeper correction
Resistance at ATH level could stall momentum
Traders, if you liked this idea or if you have your own opinion about it, write in the comments. I will be glad 👩💻

XAUUSD COT and Liquidity AnalysisCOT Report Analysis:
If wee look deeper in to the COT data we can see that market makers been
actually selling this rally. Since they had 356K net longs they been taking profits
on the way. Now we can see that shorts are also slightly increasing.
I would be only bearish for now until 3000. May is also one of the strongest months for USD:
Dollar Seasonal Tendencies
Hey what up traders welcome to the COT data and Liquidity report. This is a big part of my FX Trading. Im always trying to trade with the Big players so knowing their positions is good thing.
Please be aware that institutions report data to the SEC on Tuesdays and data are reported on Fridays - so again we as retail traders have disadvantage, but there is possibility to read between the lines. Remember in the report is what they want you to see, that's why mostly price reverse on Wednesday after the report so their cards are hidden as long as possible. However if the trend is running you can read it and use for your advantage.
I created this simple free indicator which you can find in the my scripts. It's highlighting the day of the real report - Tuesday.
Here is the tip if the level has confluence with the high volume on COT it can be strong support / Resistance.
Analysis done on the Tradenation Charts
Disclosure: I am part of Trade Nation's Influencer program and receive a monthly fee for using their TradingView charts in my analysis.
"Adapt what is useful, reject what is useless, and add what is specifically your own."
— David Perk aka Dave FX Hunter ⚔️

GOLD H1 / 3285 USD & 3155 USD key BUY/SELL Levels🏆 Gold Market Mid-Term Update
📊 Technical Outlook Update
🏆 Market Overview
▪️correction in progress
▪️3285 USD overhead resistance
▪️Multiple waves of selling in progress
▪️Rejection at 3500 USD key S/R
▪️3155 USD logical next target short-term
▪️flagging on lower timeframe
▪️waves of profit taking pulling prices down
▪️3285 USD a good level to SHORT
▪️3145/3155 USD will be targeted by BEARS
▪️BULLS wait to BUY/HOLD low later
▪️Once the pullback/correction is over
📊 Gold Market Summary – May 5, 2025
🟡 Current Price: $3,266.20 (+0.82%)
📉 Weekly Close: $3,247.40 (flat for the week after sharp swings)
🇺🇸 US Jobs Data: 177K jobs added in April, earnings growth slowed to 0.2%. Market now watching Fed for rate cut signals.
🏦Fed Outlook: Mixed data fuels speculation on policy shift. Analysts see gold’s pullback as a new buying opportunity.
🌏Asian Demand: China and India remain key forces in price direction, alternating as major buyers.
📦Tariff Watch: Ongoing U.S.-China trade tension continues to weigh on risk sentiment, keeping gold in play.
🛑Geopolitics: No major updates on Iran-U.S. talks, India-Pakistan, or Russia-Ukraine ceasefire yet. These remain key risk triggers.
📈 Market Sentiment: Despite volatility, investor outlook stays bullish. Analysts eye mid-term targets above $4,000 if conditions align.

How to Trade Gold with AI-Powered Algos in 2025📊 How to Trade Gold with AI-Powered Algos in 2025
A practical action plan for serious gold traders
🔍 1. Know Why Gold Requires Custom Algo Tactics
Gold is volatile, news-sensitive, and driven by macro events like Fed policy, geopolitics, and inflation. Generic stock or crypto bots fail here — gold needs precise, event-aware automation.
🧠 2. Use AI-Powered Bots Trained for Gold Volatility
Deploy bots that adapt to real-time data like CPI releases, bond yields, and geopolitical headlines. Use machine learning models that detect gold breakouts, consolidations, and safe-haven flows.
Top AI algos for gold traders: Multiple systems based on MT4/MT5
Fully-automated, AI-based gold bot with breakout detection, precision entries, and built-in risk control.
⚙️ 3. Build or Choose the Right Algo Strategy for Gold
Trend-Following: Use 21/50 EMA crosses on H1 and H4
Mean Reversion: Bollinger Band fades in range-bound sessions
Breakout Algos: Trigger trades on CPI or FOMC event volatility
Volume-Based AI: Analyze volume spikes vs. historical patterns
🧪 4. Backtest Gold-Specific Models
Always test your bot using historical gold data, especially during NFP weeks, Fed meetings, and geopolitical escalations. Use data from 2018 to 2024 for high-volatility periods.
Tools: TradingView for Pine Script testing, MetaTrader 5 for EA deployment
🛡️ 5. Control Risk with Gold-Specific Parameters
Max drawdown: Keep under 15 percent
Stop-loss: Always use hard stops (not just trailing)
Position sizing: 0.5 to 1 percent of capital per trade
Use volatility filters: Avoid entries during thin liquidity hours
🔄 6. Automate Monitoring and Adaptation
Run multiple bots for breakout, momentum, and reversal setups
Use dashboards to track gold-specific metrics like VIX, USDX, DXY, and 10Y Treasury yields Integrate AI that adjusts parameters after major data releases
🚀 7. Prepare for 2025 Market Structure
Gold is increasingly driven by
Central bank digital currency rollouts
USD de-dollarization risks
Global stagflation or recession themes
DeFi and tokenized gold products
Your algo must factor in these macro narratives using real-time data feeds
📌 Gold Algo Trading Success Plan 2025
Use AI bots built for gold volatility
Trade high-probability breakouts post-news
Backtest with gold-specific macro filters
Maintain strict risk limits with max 15 percent drawdown
Monitor global news and macro data with bot triggers
Continuously optimize and adapt
Gold is not just a commodity — it’s a signal of global risk. Automate smartly, manage risk tightly, and use AI to stay one move ahead.

Gold (XAU/USD) Breakout Confirmed – Bulls Eye Higher TargetHello guys!
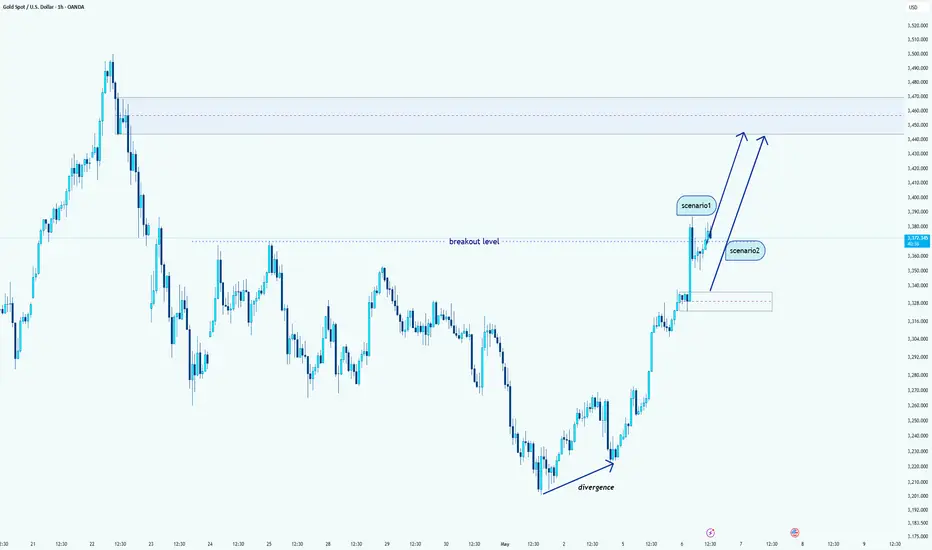
Gold has successfully broken above the key resistance level marked as the breakout level, confirming bullish momentum. This breakout follows a clear bullish divergence, indicating a reversal from the recent downtrend. The strong upward movement suggests increased buyer interest and continuation potential.
Two bullish scenarios are in play:
Scenario 1: Price continues upward from the current breakout zone without a retest, targeting the next resistance area around $3,440–$3,470.
Scenario 2: A pullback to the breakout level or the demand zone near $3,325–$3,340, followed by a bullish continuation.
What I see:
✅ Bullish divergence identified at the recent low
✅ Breakout from a significant resistance level
📈 Momentum favors continued upside
#XAUUSD: Major Update 01/05/2025, Read Description! Gold has dropped over 700 pips since yesterday evening, suggesting further price correction. This is primarily due to strong US dollar data indicating potential correction in DXY Index prices. Additionally, there are speculations that the US has reached out to China for trade talks, although this has not been confirmed. Today and tomorrow are major trading days, with significant news expected to shape gold prices.
For now, you can monitor the prices or take entry if they reach your chosen risk management area. The decision to enter or exit is entirely up to your analysis.
Good luck and trade safely!
Thank you for your unwavering support! 😊
If you’d like to contribute, here are a few ways you can help us:
- Like our ideas
- Comment on our ideas
- Share our ideas
Team Setupsfx_
❤️🚀

Learn KEY PRINCIPLES of Technical Analysis in Gold Forex Trading
In the today's article, we will discuss the absolute basics of trading - 3 key principles of technical analysis in Forex & Gold Trading.
1️⃣History Repeats
History tends to repeat itself in the Forex market.
Certain trends are cyclical and may reemerge in a predictable manner, certain key levels are respected again and again over time.
Take a look at the example:
Silver perfectly respected a historical horizontal resistance in 2011 that was respected in 1980 already. Moreover, the price action before and after the tests of the underlined zone were absolutely identical.
2️⃣Priced In
All relevant information about a currency pair: economical and political events, rumors, and facts; is already reflected in a price.
When the FED increased the rate 26th of July by 25 bp, EURUSD bounced instead of falling. Before the rate hike, the market was going down on EXPECTATIONS of a rate hike. The release of the news was already price in.
3️⃣Pattern DO Work
Some specific price models can be applied for predicting the future price movements.
Technicians strongly believe that certain formations - being applied and interpreted properly, can give the edge on the market.
Depending on the trading style, different categories of patterns exist: harmonic patterns, price action patterns, wave patterns, candlestick patterns...
Above, I have listed various price action patterns that are applied by many traders and investors as the main tool for analyzing the financial markets.
If you believe in these 3 principles, you are an inborn technician!
Study technical analysis and learn to apply these principles to make money in trading.
b]❤️Please, support my work with like, thank you!❤️
I am part of Trade Nation's Influencer program and receive a monthly fee for using their TradingView charts in my analysis.

GOLD - Price can make correction movement to support levelHi guys, this is my overview for XAUUSD, feel free to check it and write your feedback in comments👊
A few moments ago, the price traded inside a little flat, where it declined to the bottom part and then started to grow.
In a short time, it reached the $2955 level, broke it and started to trades inside a big flat, exiting from a small range.
After this movement, the price reached the top part of the flat and then corrected, after which it entered to pennant.
In the pennant pattern, Gold exited from a flat and rose to the resistance line from the support line, breaking the $3205 level.
Also recently, price made a correction, but then it turned around and bounced up, thereby exiting from pennant.
Now, I think that Gold can rise a little and then start to decline to $3205 support level.
If this post is useful to you, you can support me with like/boost and advice in comments❤️

XAU/USD: NFP has come,What's Next? (READ THE CAPTION)By analyzing the gold chart on the 1-hour timeframe, we can see that after yesterday’s analysis, the price successfully rallied from $3231 to $3268. Once it reached that zone, selling pressure kicked in, and gold has since corrected down to $3239.
If gold stabilizes below $3257, we may expect further downside. The potential bearish targets are $3237 and $3221.
Keep a close eye on the $3209–$3220 zone, as price reaction there could be significant.
Please support me with your likes and comments to motivate me to share more analysis with you and share your opinion about the possible trend of this chart with me !
Best Regards , Arman Shaban

GOLD: Very Complex Price DevelopmentGOLD: Very Complex Price Development
The fundamental and technical analysis are not in line at all with gold this time.
GOLD increased at a time when Trump is doing positive comments:
Over the weekend, US President Donald Trump said that they will lower tariffs on China "at some point" and added that they could announce trade deals this week when asked about it. Trump also noted that they could start imposing 100% tariffs on imports of foreign-produced movies.
Finally, he argued that interest rates should be lowered but reiterated that he will not remove Jerome Powell as Fed Chairman before his term ends in May 2026.
You may watch the analysis for further details!
Thank you!

XAUUSD: Price Mitigated Earlier, We Got Left Behind! Hey Everyone
Happy Friday
So, yesterday, we were expecting gold prices to dip down to around 3172. But guess what? It didn’t quite go as planned! The price took a nosedive from 3208 and is currently sitting at 3260, almost 520 pips move.
It’s not always going to be a smooth ride, so let’s not get discouraged. We can focus on analysing this chart and keeping an eye on the price as it moves.
Once the trade is activated, there are two targets you can set. You can choose your own take-profit based on your analysis and trade management.
Good luck and trade safely! 😊
Thanks a bunch for your unwavering support! ❤️🚀
If you’re feeling generous, here are a few ways you can help us out:
- Like our ideas
- Comment on our ideas
- Share our ideas
Cheers,
Team Setupsfx_
❤️🚀

Gold will continue to fall after correctionGold after exiting the consolidation, which is the basis of the H&S reversal pattern, and falling by 1.7% gold may form a correction to accumulate the potential to continue its fall
The correction allows to accumulate energy before the fall at the expense of those who were selling (collect sellers' stoplosses), those who are now buying (collect stoplosses after the reversal).
Scenario: if the correction continues to the resistance 3260, it will be a key point from which we can consider the continuation of the fall. The signal for the fall will be the lack of opportunity to continue growth, i.e. false breakout and consolidation below 3260.

GOLD H8 Update: Bulls will target 3600 USD🏆 Gold Market Mid-Term Update
📊 Technical Outlook Update
🏆 Bull Market Overview
▪️pullback looks complete now
▪️3000/3200/3400/3600 USD key S/R
▪️Reversal at 3200 USD
▪️Resistance near 3400 USD
▪️Bulls maintain strategic advantage
▪️Target for BULLS 3600 USD
▪️short-term dips are possible
▪️focus on buying dips
⭐️Recommended strategy
▪️BUY/HOLD accumulate dips
▪️TP BULLS 3600 USD
🏦Fed Outlook: Mixed data fuels speculation on policy shift. Analysts see gold’s pullback as a new buying opportunity.
🌏Asian Demand: China and India remain key forces in price direction, alternating as major buyers.
📦Tariff Watch: Ongoing U.S.-China trade tension continues to weigh on risk sentiment, keeping gold in play.
🛑Geopolitics: No major updates on Iran-U.S. talks, India-Pakistan, or Russia-Ukraine ceasefire yet. These remain key risk triggers.

GOLD ROUTE MAP UPDATEHey Everyone,
Great finish to the week, after completing both our Bullish and Bearish target yesterday, we then finished off with our retracement range gaps.
We also stated that we will look for a cross and lock below this level to open the swing range or failure to lock, will see support and bounce on this level.
This played out perfectly with no lock confirming the rejection and then the bounce allowing us to buy the dip. We are now seeing the level retested again and respecting it perfectly for another bounce.
We will keep the above in mind when taking buys from dips. Our updated levels and weighted levels will allow us to track the movement down and then catch bounces up.
We will continue to buy dips using our support levels taking 30 to 40 pips. As stated before each of our level structures give 20 to 40 pip bounces, which is enough for a nice entry and exit. If you back test the levels we shared every week for the past 24 months, you can see how effectively they were used to trade with or against short/mid term swings and trends.
BULLISH TARGET
3343 - DONE
BEARISH TARGETS
3282 - DONE
EMA5 CROSS AND LOCK BELOW 3282 WILL OPEN THE FOLLOWING BEARISH TARGET
3224 - DONE
EMA5 CROSS AND LOCK BELOW 3224 WILL OPEN THE SWING RANGE
SWING RANGE
3190 - 3138
We will now come back Sunday with our updated Multi time-frame analysis, Gold route map and trading plans for the week ahead.
Have a smashing weekend!! And once again, thank you all for your likes, comments and follows, we really appreciate it!
Mr Gold
GoldViewFX

THE KOG REPORT THE KOG REPORT
In last week’s KOG Report we said we would stick with our plan and look to continue with the move downside. This worked well for us and also gave us the bounce we wanted pre-event for the long trade following the retracement. For NFP, we released the KOG Report again, suggesting a move downside into the key level, then a bounce for the long. We got the short, we then got the TAP AND BOUNCE for the long, although, after having protected and managing it we closed at break even with the minimal lot that was left on the table.
We ended the week with another stellar performance on the EA, the algo and the indicators, not only on Gold, but also the other pairs we trade.
So, what can we expect from the week ahead?
Simple one this week as it’s bank holiday. Expect thin volume during the London session with a potential burst of volume during the US session. We have pathed out the levels and what to look for, with the first resistance just above, which is ideally what we want to target and reject to give us a further move downside. There is a key level above, 3250-55, the bias will be bearish below for now, unless broken which will give us the extension of the move into 3270-75 which is where sellers may get another opportunity.
Red boxes:
Break above 3235 for 3243, 3245, 3247, 3252 and 3270 in extension of the move
Break below 3220 for 3210, 3206, 3196, 3188 and 3179 in extension of the move
Bank holiday in the UK so not sure if we’ll be around much but we’ll re-visit the charts on Tuesday.
Please do support us by hitting the like button, leaving a comment, and giving us a follow. We’ve been doing this for a long time now providing traders with in-depth free analysis on Gold, so your likes and comments are very much appreciated.
As always, trade safe.
KOG

Gold (XAU/USD) Intraday Buy Setup with High Reward-to-Risk Ratio1. Entry Point Zone: Around 3,271.79 USD
This is identified as a potential buy entry area, marked in purple.
2. Stop Loss: Below the entry point at 3,257.71 USD
Risk management level in case the trade moves against the setup.
3. Target Point One: Between 3,313.75 and 3,317.07 USD
A short-term take-profit level, likely based on previous resistance.
4. Final Target (EA Target Point): Around 3,373.04 USD
A more ambitious take-profit, possibly based on a major resistance level or Fibonacci extension.
5. Trade Range:
Risk: 3,271.79 - 3,257.71 = 14.08 USD
Reward to First Target: ~42 USD

GOLD BUYGreetings traders this is my analysis on Gold and it is a Long shot for a Buy.
📊 Technical analysis of gold (XAU/USD) — 4h timeframe
🔺 Formation: Head & Shoulders
The pattern is now even more clearly presented with:
Left shoulder – a smaller consolidation move.
Head – a higher peak (higher high).
Right shoulder – a weaker attempt to recover, which confirms the loss of bullish strength.
Usually, such a pattern is followed by a corrective move downwards (which has already been partially seen).
🔄 Potential trend change zone
Highlighted support in the zone:
3,162 – 3,128 USD — very important for confirming the bullish scenario.
The shown "bounce zone" suggests a possible purchase if the price bounces from this area.
📈 Predicted path
Expected:
Fall to support (around 3,150–3,130).
Reversal and continuation of the uptrend.
Target zone: 3,503 – 3,505 USD.
✅ Conclusion and strategy:
Scenario 1 (main): Buy zone between 3,160–3,130 if price action signal is seen (pin bar, engulfing).
Target: 3,500+
Stop loss: below 3,120 (below support).
Scenario 2 (riskier): If price does not bounce from that zone — possible further deepening towards 3,080–3,000.
Dear Traders like,comment let me know what do you think

THE KOG REPORT - UpdateEnd of day update from us here at KOG:
BOOMING! We said we would stick with the plan, we did, and BOOM, straight into the level we wanted. What we did want from there however is a bounce, but instead, we got just over 100pips long and then back into the lower level where we are now ranging.
Unless there is a late session move and 3210 holds us up to target the 3250-55 level initially, we'll wait lower now which is where the Asia session may take it.
With NFP tomorrow, we can expect that typical pre-event price action to begin soon, so maybe best practice now is to wait for them to do what they want, and come back next week to capture better set ups.
DOW, NAS, BTC, GOLD, EU and Oil all performing for us today, well done team. Another day in the office.
We'll be back tomorrow with the NFP KOG Report and our view.
As always, trade safe.
KOG

Gold (XAU/USD) - Bullish Reversal Pattern in Play Hello guys!
Let's analyze Gold!
Gold has recently broken out of a descending wedge pattern, a classic bullish reversal signal, with confirmation coming from a clear bullish divergence near the $3,200 zone. After reaching the target of the descending pattern, the price rebounded sharply and is now forming an ascending channel.
Currently, the price is approaching a key resistance zone around $3,280–$3,290. If bulls manage to push through this level, we could see a rally toward the next major resistance around $3,320 and beyond.
🔍 Key Points:
✅ Descending wedge breakout confirmed
✅ Bullish divergence near the bottom signals a momentum shift
✅ Price respecting ascending channel structure
📈target of long position: $3,290–$3,320
📉 target of short position and the entry for long: $3,240 zone
Outlook: Bullish bias remains valid as long as the price is above the $3,240–$3,250 support area. Watch for a breakout above resistance for further upside continuation.

Gold Bear Flag in Play – More Downside Ahead?Last week was a strong one for Gold bears, with price dropping sharply and reaching a low near the 3200 mark.
A normal recovery followed, but the bounce is now facing pressure below the 3270 level – a former support that has now turned into resistance.
Current price action is forming a bear flag, a classic continuation pattern. If we get a break back below 3250, this could trigger a new leg down, targeting the 3170 support zone.
My outlook remains bearish, and I’m continuing to sell rallies into resistance, expecting this bear flag to resolve to the downside.
Disclosure: I am part of Trade Nation's Influencer program and receive a monthly fee for using their TradingView charts in my analyses and educational articles.

HelenP. I Gold can rebound from trend line to resistance levelHi folks today I'm prepared for you Gold analytics. After forming a local bottom around the 3190 - 3210 support zone, the price has rebounded and is now testing the upward trend line once again. This level has consistently acted as dynamic support throughout the recent bullish structure, confirming its relevance and strength. Buyers have shown clear interest in defending this area, and the reaction near this level further strengthens the bullish sentiment. Notably, the market is recovering from a correction phase that followed the previous local peak near the 3350 - 3370 resistance zone. Price has moved within a wide range, creating opportunities for both accumulation and further upside. The chart also shows how Gold is forming a higher low, which supports the continuation of the current trend. If the trend line continues to hold, I expect the price to move toward the resistance area, with my goal located at 3350 points - the key breakout level. Given the price reaction, support structure, and trend confirmation, I remain bullish. If you like my analytics you may support me with your like/comment ❤️
