Gold falls, can the bears continue?
Recently, the gold market has been affected by multiple factors and the volatility has intensified:
Trade policy uncertainty: Trump plans to impose a 100% tariff on overseas films, exacerbating concerns about a trade war, and risk aversion has once pushed up gold prices.
Fed policy expectations: Although the Fed kept interest rates unchanged in the early morning, the market is more concerned about its future policy path, and the impact of interest rate decisions is limited.
Progress of Sino-US trade negotiations: Optimistic sentiment has partially weakened risk aversion demand, causing gold prices to fall from highs.
Spot gold previously hit its highest level since April 22 at 3438, but due to profit-taking and changes in market sentiment, prices retreated from highs and entered a period of shock consolidation in the short term.
Technical analysis
1. Short-term structure (4H chart)
Key range: Yesterday, gold fluctuated around the 3360-3400 range. Although there was an interest rate decision in the early morning, no breakthrough was formed.
Risk of false breakthrough in the early trading: After opening today, it quickly rose to 3414 and then fell back quickly, forming a pattern of inducing more, indicating that the market is still bearish in the short term.
Current trend: The 4H chart structure weakened, and the price fell below the short-term support. If 3320 is lost, it will further drop to the 3300-3260 area.
2. Key support/resistance
Short-term resistance: 3344-3348 (high point of Asian session rebound), 3356-3360 (upper edge of yesterday's shock)
Short-term support: 3330 (intraday low), 3320 (key support level), break down to 3300
Strong support: 3260 (weekly level support)
Trading strategy suggestions
1. Short-term short selling (main strategy)
Entry position: around 3348 (if the rebound is weak)
Stop loss: 3358 (to prevent false breakthroughs)
Target: 3300 (first target), break to 3260
2. Break to short (if data pushes)
Condition: If the initial jobless data in the evening is negative, and the price falls below 3320
Follow-up strategy: short selling, target 3300-3260
3. Low-long strategy (wait and see)
If the price quickly drops to the 3260-3280 area and stabilizes, you can consider short-term rebound long orders, but it needs to be combined with market sentiment and data performance.
Focus on events
Tonight's initial jobless claims data: If the data is weaker than expected, it may strengthen the expectation of interest rate cuts and limit the decline of gold prices; on the contrary, if the data is strong, it will accelerate the decline.
Progress of Sino-US trade negotiations: Any sudden news may cause violent market fluctuations.
Summary
Gold is short-term technically bearish. It is recommended to sell short on rebounds in terms of operations, focusing on the resistance area of 3348-3360. If it is under pressure, look down to 3300-3260. Be cautious with data and strictly stop losses to control risks.
GOLDCFD trade ideas

GOLD SELL TRADE RESULTGold hit our full tp 270 pips guys i give this trade in my channel and also in profile scroll down and see my work
Stay tuned for more trade setups

GOLD - WAVE 4 CORRECTION TO $2,800 (UPDATE)Gold climbed higher, but very swiftly rejected our 0.365% zone, melting back down 740 PIPS. Should see a continuation to the downside.
But as I said yesterday, if we see a breach of $3,465 then we'll create an alternate analysis which'll show Gold leading towards a new ATH, creating a 'redistribution phase' at higher prices.

Gold Technical Analysis.The image you uploaded is a technical analysis chart for XAU/USD (Gold) on the 1-hour timeframe, published on TradingView. Here’s a breakdown of the chart:
1. Trend and Pattern:
The chart shows a bullish trend with two ascending channels (marked in green) that recently broke to the downside.
The price reached a resistance zone (marked with a black rectangle) and reversed sharply.
2. Price Action:
The current price is approximately 3,370.94, showing a decrease of 1.91%.
After breaking the ascending channel, the price is showing bearish momentum.
3. Prediction/Target:
The chart suggests a potential continuation of the downward move, with a target around the 3,340 level (marked in blue).
A consolidation or small pullback is indicated before continuing downward.
4. Key Zones:
Resistance Zone: Around 3,400 - 3,440.
Support Zone/Target: Around 3,340.
The chart analysis indicates a bearish bias with the possibility of a price drop toward the target zone. Would you like insights on trading strategies based on this analysis?

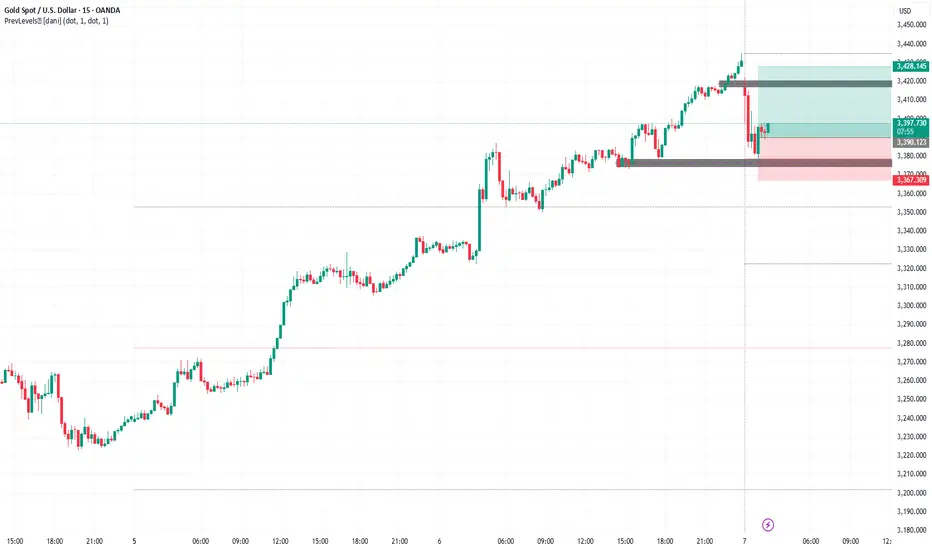
GOld BuyWe are in an uptrend. We have an engulfing candle on 15th minutes . WE join the market at the current rate hoping to fill the gap that is between 3420 and 3428
Positive tariff news favors lower gold prices - wait for FOMC🔔🔔🔔 Gold news:
➡️ Gold prices ended the week down around 2.50% as improved risk appetite - driven by easing trade tensions and a strong US jobs report - prompted investors to book profits ahead of the weekend.
➡️ Over the weekend, China's Ministry of Commerce said the US was open to trade and tariff talks, reaffirming that Beijing's door to dialogue remains open.
➡️ Bullion prices continued to fall after April's non-farm payrolls unexpectedly rose, beating expectations, while the unemployment rate remained unchanged from March. XAU/USD fell to an intraday low of $3,222 as traders reduced expectations for four rate cuts from just three now.
Personal opinion:
➡️ There is still no strong enough momentum for gold to continue rising and must wait for the upcoming FMOC. Therefore, gold will maintain a short-term downtrend in the beginning of next week
➡️ Note: any information about the US-China trade war is given top priority
➡️ Analysis based on resistance - support levels and trend lines combined with EMA to come up with a suitable strategy
Plan:
🔆Price Zone Setup:
👉Buy Gold 3293 - 3296
❌SL: 3190 | ✅TP: 3200 - 3205 - 3210
👉Sell Gold 3255 - 3258 (Scalping)
❌SL: 3263 | ✅TP: 3251 - 3246 - 3240
FM wishes you a successful trading week 💰💰💰

Gold Will Fall DownXAU/USD Analysis (4H)
Observations:
- Current price nearing a Bearish Fair Value Gap (FVG) zone
Trade Idea:
- Expecting a downward push from the FVG zone
- Sell opportunity in Gold
Target:
- 3150
This setup suggests a potential sell signal, with the FVG zone acting as a resistance level. Let's see how the market reacts.

GoldXAUUSD
- Descending Triangle as an corrective pattern in Short Time Frame
- Break of Structure
- S / R Level
- Change of Characteristics
- Completed " 12345 " Impulsive Waves and " ABC " Corrective Waves

Gold Trade Plan 01/05/2025Dear Traders,
The April monthly candle closed around 3285. Currently, the price has reacted to a previously identified zone and is now moving within a descending channel, with the channel's upper boundary at 3285. If the price gives a daily close above 3285, I expect it to rise toward 3370.
otherwise complex Correction will be continue and my Final Target is 3170
if you enjoyed this forecast, please show your support with a like and comment. Your feedback is what drives me to keep creating valuable content."
Regards,
Alireza

Gold XAUUSD Possible Move 01-02 May 2025📉 Gold Technical Outlook
Gold has decisively broken a key support zone between $3,268–$3,274, now trading near the $3,210-20 level. This move comes amid a clear downtrend structure, with price action respecting a well-defined descending trendline.
🔍 Current Technical Context:
Trend: Bearish
Support Turned Resistance: $3,268–$3,274
Immediate Support: $3,210–$3,220
Resistance: Trendline and previous support zone near $3,270
A retest of the broken support zone could offer a high-risk, high-reward shorting opportunity, especially if price fails to reclaim it. However, a clean break below the $3,210–$3,220 support could trigger another aggressive selloff, with downside targets potentially extending below $3,160.
📊 Key Drivers (Geopolitical/Fundamentals)
US Dollar Strength: The USD remains firm despite mixed economic data, applying pressure on gold prices.
Geopolitical Easing: Reduced US-China tensions are weighing on safe-haven flows, as US approaches China for talks on tariffs.
Russia-Ukarine: Russia declaring cease-fire for a week.
Technical Pullback: Gold is correcting after a strong rejection from the $3,500 zone.
Profit-Taking: Recent rejection led to bearish closes as traders locked in gains.
Liquidity Considerations: With May 1 being a public holiday in many regions, lower liquidity could amplify volatility.
Event Risk Ahead: Caution prevails ahead of key macro events including Non-Farm Payrolls (NFP) and the FOMC statement.
📝 Strategy Notes:
Sell-on-Rally Zone: $3,268–$3,274 (if price retests and rejects)
Bearish Continuation Trigger: Break and close below $3,210
Invalidation for Bears: Sustained reclaim of $3,274 and a break above the trendline
Stay nimble and monitor for reactions around the highlighted zones as event-driven volatility can cause swift moves.

#GOLD #IDEA #GOLD #IDEA we now arE at 50% of continuation RANG .Will it drop continue ?
let's See.we will focus on M15 and M5 looking for set-up for sell

Technical move on Gold XAUUSD GOLD Update H1 Timeframe 🙌
- This Analysis is based on Educational Purposes using Technical aspect ❗️
- We set our trendline accordingly to Technical Analysis
- There is a good selling Opportunity from 3278.00 - 3285.00 point
- Targets would be set according to charts 3264 - 3242.00 - 3230.00
Follow the Trend with 🔽
- Consistency
- Focus Mindset
- Confident
- Risk Management
Additionally: There is a high impact news which would fluctuate the market ❗️

Gold Price Analysis May 1The D1 candle has broken out in a bearish direction. It is not surprising that the price broke Dow and decreased according to yesterday's Plan.
Gold confirmed the selling side won, so today's strategy is to watch for SELL. The SELL point pays attention to the 2 break zones of 3270 and 3302. The BUY point with the Scalping element pays attention to 3216 and today's main support is 3195.
The current trading strategy is that gold is approaching the 3237 resistance. If it confirms closing above this zone, it will give a BUY signal to 3251 and consider the price reaction of the US session. If it breaks 3241, it will hold until 3270. On the contrary, if it does not break 3237, it can SELL to 3216 and trade according to the noted port zones.

GOLD buy limitthe gold went from bearish to bullish this week breaking the 4 hour structure with a clean move
and now i'm waiting for a discount price to get in the wave , targeting all times high as shown

XAUUSD:Sharing of the Latest Trading StrategyAll the trading signals today have resulted in profits!!! Check it!!!👉👉👉
The international gold price reversed its earlier upward trend. Trump signed a trade agreement with the UK, which dampened market sentiment. In terms of the trade agreement, any cooling down of the trade war and reduction of uncertainties are bearish for gold. Pay attention to the resistance at 3,370. If it fails to break through, just wait for a rebound and then go short, with the target set at the support level of 3,300 below.
Trading Strategy:
sell@3370-3360-3350
TP:3320-3300
The signals in the Signature have brought about continuous profits, and accurate signals are shared every day. Hurry up and click to get them!
👇 👇 👇 Obtain signals👉👉👉

Gold next is 3125 and 3070Gold is ready for a great retest lower.
Soon we will see gold trading below 3100 region.
Let us wait.

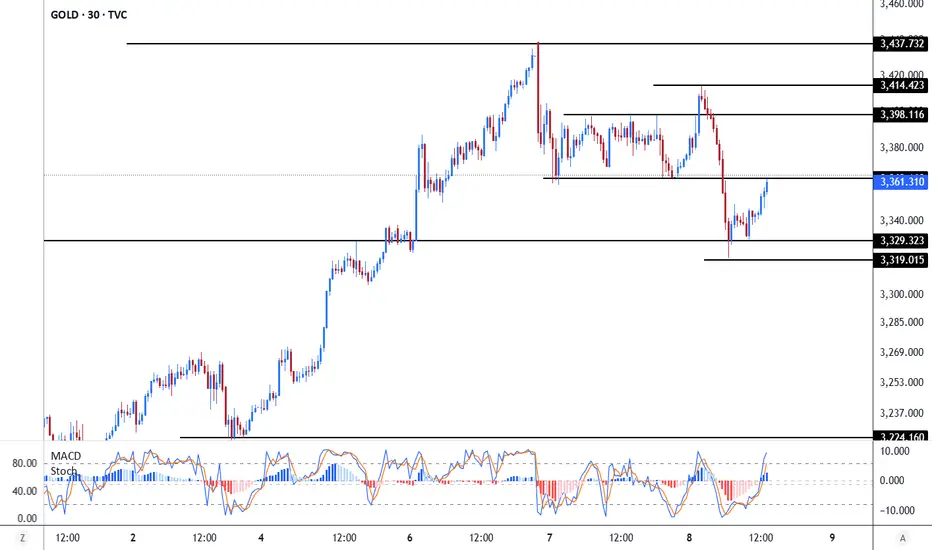
Gold Short-Term Outlook: Potential Rebound Toward Resistance Be The price is currently trading around the 3353 level, after bouncing from a key support zone at 3329 dollars.
In the first scenario, if the price continues to rise, it’s expected to reach the 3398 level — a very strong resistance area, as it aligns with a descending trendline and multiple previous highs. This zone could trigger a strong pullback, and we expect a new decline back toward the 3329 and 3319 levels respectively.
The MACD is giving a bullish signal, and the Stochastic is also moving up from the oversold area, which suggests the possibility of a temporary upward move.
The Fed’s interest rate decision makes a grand debut
After gold quickly rose and fell today, gold basically began to fluctuate sideways. Of course, this is also to welcome the heavy data of the Federal Reserve's interest rate decision; gold is likely to fluctuate like this before the data, so where will the Federal Reserve's interest rate decision go? And how to lay it out?
Judging from the recent market and data, there is a high probability that gold will keep interest rates unchanged, so gold as a whole will still maintain a volatile upward trend. The gold 1-hour moving average is still a bullish arrangement with a golden cross upward. The strength of the gold bulls is still there, and gold will continue to make more dips. Gold 3350 is still an important turning point for gold's long-short transition. After the gold Fed interest rate decision, then we will continue to go long on dips above 3350. After the Federal Reserve's interest rate decision, gold will continue to buy on dips above 3350.
Gold's short-term trend is still a bullish arrangement. Gold will continue to buy on dips without breaking 3350. If the gold data unexpectedly falls below 3350, then re-arrange it at that time.
Operational ideas:
Gold more than 3350, stop loss 3340, target 3400-3420;

GoldXAUUSD
- Point of Interest
- Symmetrical Triangle as corrective pattern in Short Time Frame
- Order Block
- Completed " 12345 " Impulsive Waves and " AB " Corrective Waves
- Fibonacci Level - 38.20% / 50.00%

Gold H4 | Pullback support at 38.2% Fibonacci retracementGold (XAU/USD) is falling towards a pullback support and could potentially bounce off this level to climb higher.
Buy entry is at 3,343.88 which is a pullback support that aligns with the 38.2% Fibonacci retracement.
Stop loss is at 3,270.00 which is a level that lies underneath an overlap support and the 61.8% Fibonacci retracement.
Take profit is at 3,431.43 which is a swing-high resistance that aligns with the 78.6% Fibonacci retracement.
High Risk Investment Warning
Trading Forex/CFDs on margin carries a high level of risk and may not be suitable for all investors. Leverage can work against you.
Stratos Markets Limited (tradu.com):
CFDs are complex instruments and come with a high risk of losing money rapidly due to leverage. 63% of retail investor accounts lose money when trading CFDs with this provider. You should consider whether you understand how CFDs work and whether you can afford to take the high risk of losing your money.
Stratos Europe Ltd (tradu.com):
CFDs are complex instruments and come with a high risk of losing money rapidly due to leverage. 63% of retail investor accounts lose money when trading CFDs with this provider. You should consider whether you understand how CFDs work and whether you can afford to take the high risk of losing your money.
Stratos Global LLC (tradu.com):
Losses can exceed deposits.
Please be advised that the information presented on TradingView is provided to Tradu (‘Company’, ‘we’) by a third-party provider (‘TFA Global Pte Ltd’). Please be reminded that you are solely responsible for the trading decisions on your account. There is a very high degree of risk involved in trading. Any information and/or content is intended entirely for research, educational and informational purposes only and does not constitute investment or consultation advice or investment strategy. The information is not tailored to the investment needs of any specific person and therefore does not involve a consideration of any of the investment objectives, financial situation or needs of any viewer that may receive it. Kindly also note that past performance is not a reliable indicator of future results. Actual results may differ materially from those anticipated in forward-looking or past performance statements. We assume no liability as to the accuracy or completeness of any of the information and/or content provided herein and the Company cannot be held responsible for any omission, mistake nor for any loss or damage including without limitation to any loss of profit which may arise from reliance on any information supplied by TFA Global Pte Ltd.
The speaker(s) is neither an employee, agent nor representative of Tradu and is therefore acting independently. The opinions given are their own, constitute general market commentary, and do not constitute the opinion or advice of Tradu or any form of personal or investment advice. Tradu neither endorses nor guarantees offerings of third-party speakers, nor is Tradu responsible for the content, veracity or opinions of third-party speakers, presenters or participants.

GOLD PLAN UPDATE 07/05/2025H4 is showing a reversal signal, but it looks more like a retest of the broken resistance zone.
By the book + looking at the D1 chart, there’s a high chance gold pushes higher after this retest.
To me, this current rally feels a bit shaky.
My view: gold might retest or break the previous high, but I don’t see it running too far before pulling back again.
That’s my medium-term outlook—not a short-term call. Let’s wait and see 😄

XAUUSD: Gold setting up for small buy opportunities 15 min TFHello,
XAUUSD is currently setting up for a potential short-term buying opportunity. Despite elevated volatility in recent sessions, we expect this trend to persist as the new U.S. administration continues rolling out its policies. While Trump has softened his tone on tariffs, he remains firm on maintaining them until the U.S. secures fairer trade agreements—consistent with his broader economic agenda.
Given the prevailing uncertainty, we still see limited but promising opportunities for gold buyers. Technically, gold appears to have completed a corrective phase and is positioning for a fresh rally. Our near-term target is set at \$3,500. Additionally, the MACD is approaching a zero-line crossover, signaling a possible shift in momentum that supports a cautious bullish stance.
The FED rate decision later today could be the catalyst for the small move.
Good luck.
Disclosure: I am part of Trade Nation's Influencer program and receive a monthly fee for using their TradingView charts in my analysis.

GoldXAUUSD
- Double Top as corrective pattern in Short Time Frame
- Break of Structure
- RSI - Divergence
- Completed " 12345 " Impulsive Waves
- Change of Characteristics
