Gold 4H – Big vs Little: The Conflict That Created ClarityJust price, structure, and volume — tracked in real time.
🧠 Chart Breakdown:
✅ Trend Reclaim (Early March) — Entered just after price bounced from the 200 EMA. Both systems aligned: Big Brother reversal and Little Brother trend crossover. I trusted the signal and it ran clean.
⛔ False Top (Late March) — Big Brother printed a red arrow under resistance. Little Brother still looked bullish, but I paused. That caution kept me out of the trap.
✅ Re-entry Confirmation (Early April) — Green triangle fired again after a textbook pullback. Bullish volume returned, and Little Brother confirmed. I re-entered long.
⛔ True Top (Mid-April) — Volume faded. Big Brother gave a second red warning. I exited longs here — structure rolled over fast after that.
🚨 Breakdown Confirmed (May 1–2) — The flush sealed it. Both systems aligned bearish. Structure broke. No more guessing — this trend has shifted.
This is how I trade with conviction. Tools don’t replace decisions — they sharpen them.
GOLDCFD trade ideas

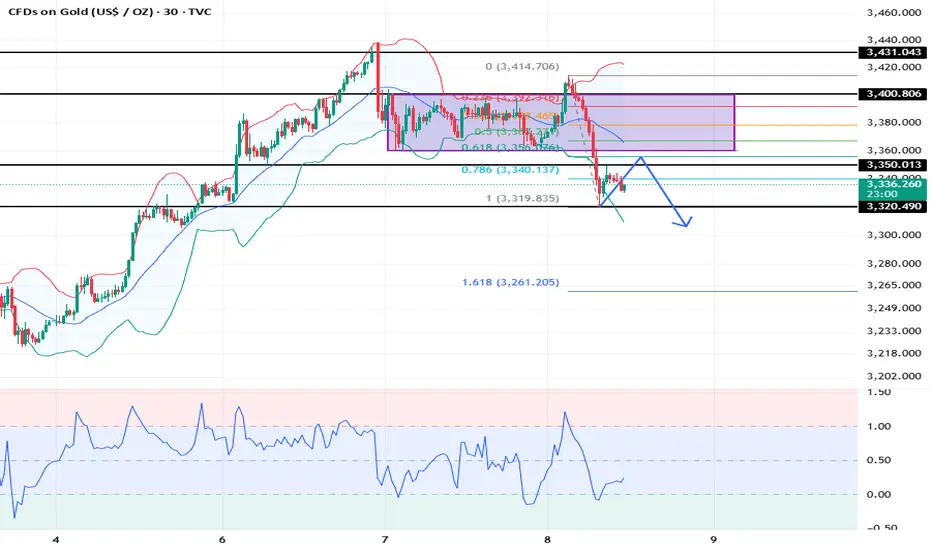
XAUUSD: 8/5 Today’s Market Analysis and StrategyGold technical analysis
4-hour chart resistance level 3410, support level 3310
1-hour chart resistance level 3380, support level 3310
30-minute chart resistance level 3350, support level 3320.
Trump said that he would hold a "large press conference" at 10 a.m. Eastern Time tomorrow, and may sign a trade agreement with the UK. Therefore, the news affected the gold price.
Russia implemented a ceasefire from 0:00 on May 8 to 0:00 on May 11 local time. The temporary ceasefire between Russia and Ukraine and the repeated situation in the Middle East may support the gold price in stages due to the risk aversion demand.
Recently, affected by the news, the daily operation range of gold is very large. Today, we will first look at the 3320-3360 range of fluctuations in the short term. If it breaks through, follow the trend and strictly stop loss!
Buy: 3323 SL: 3318
Sell: 3355 SL: 3360
More free analysis daily sharing
What’s America's Real Goal in a Possible India–Pakistan War?We are nearing the end of the petro-dollar era. The power balance of the new world order will be defined not by oil, but by the strategic resources essential for AI, electric vehicles, and cutting-edge technology.
Throughout the 20th century, the U.S. maintained its global dominance by controlling access to oil. From the Middle East to Latin America and Africa, wherever oil was found, the U.S. was there.
But today, the focus has shifted to rare earth elements, lithium, copper, and other strategic minerals.
Trump’s 2025 move to buy Greenland wasn’t a diplomatic joke—it was a signal. Behind-the-scenes deals in Ukraine for rare earth deposits tell the same story: whoever controls these "white gold" assets will lead the tech-driven world.
Now enters Pakistan, with mineral-rich lands spanning over 600,000 km², nearly three times the size of the UK. Experts estimate its underground reserves to be worth $8 trillion.
In Balochistan's Rekodik field alone, there are 12 million tons of copper and 20 million ounces of gold, with a copper purity of 0.53%, well above global standards. In the north, newly discovered lithium reserves could be a game-changer for the EV revolution.
This is no longer just about resources—this is about deciding the future balance of global power.

XAU/USD LONGXAU/USD LONG "break of a resistance area and retest it + 38.2% fib retracement + 50 ema dynamic support "

GOLD BUY SETUP INTERDAY+SWINGGold buy setup strong level for buy use proper risk management and must use of sl and tp
Buy from 3330-25
Sl 3305
Target 100-200-500 pips

X1: GOLD/XAUUSD Buy Risking1% to make 3.63X1:
Risking 1% to make 3.63%
GOLD/XAUUSD Long for day trade, with my back testing of this strategy, it hits multiple possible take profits, manage your position accordingly.
Risking 1% to make 3.63%
Note: Manage your risk yourself, its risky trade, see how much your can risk yourself on this trade.
Use proper risk management
Looks like good trade.
Lets monitor.
Use proper risk management.
Disclaimer: only idea, not advice

GOLD SELL ANALYSIS RESULTAs we predict yesterday gold move same to same and drop 500+ pips also we take sell trade in the morning.. now we are waiting for price came to aur buying zone and we will take buy
Stay tuned

Gold fluctuates at high levels and washes out repeatedly!The Asian and European sessions fluctuated repeatedly and stabilized above 3360. In the evening, the US session fell slightly and stabilized at the 3360 mark, ushering in a bottoming rebound. The daily K-line closed at a high level. The daily structure closed at a high level. It closed a little stronger, and the weekly line reached a high for the second time. It has not yet formed a high and fall. The continuous form is impacted by the news, waiting for further confirmation of the form. The previous wave of strong rebound in the 4-hour chart of gold, the overall gold price rebounded in the short term for two consecutive trading days, and yesterday it was under pressure and fell. The situation of shock, but now it has formed a stage support area above 3360. After the opening of the Asian session, the gold price rose strongly and returned to above 3390. At present, it has reached 3415. Pay attention to the support level of 3360 below. If the support is effective, the gold price is expected to rise again. If it enters a shock wash, it is recommended to adopt the idea of selling high and buying low. Therefore, the current trend, people who like shocks feel very comfortable, and people who look at one side feel uncomfortable. The early trading operation is still in the range of 3420-3360, and a new layout will be made after breaking through! Overall, the short-term operation strategy of gold is recommended to be short-selling on rebounds and long-selling on pullbacks. The short-term focus on the upper side is the 3420-3438 line of resistance, and the short-term focus on the lower side is the 3350-3360 line of support.

Gold. Long-term Elliott Wave Structure.I'm showing this beautiful weekly chart since 1971 when president Richard Nixon ended the international convertibility of the US dollar to gold. The path followed by gold since that time, is a text-book Elliott wave structure where long term wave 3 has ended. Wave 4 resides at 900 dollars per ounce.


Potential 1:3 Buys on GOLDOpportunity ahead as Gold reaches for ATH.
War news plus confirmations on 4 hour candles as bullish bias.
1:3 RR
SL - 3,351
TP 1- 3,415
TP 2 - 3,438
TP 3 - 3,499

Gold Intraday Trading Plan 5/7/2025Gold has broken every possible resistance and is going towards 3500 previous ATH. I am still expecting strong bullish move today.
I will look for buying opportunity from 3387.
1st target 4430
2nd target 3500

Risk aversion in the international situation is escalating! Gold has risen strongly again, breaking the shock, and there is basically no pullback. It is very likely that the risk aversion sentiment will be released directly, and gold will start to adjust again. Therefore, it is not suitable to chase more at this position now. It is better to wait patiently for the opportunity to fall back. Gold may rise and fall at any time. In the shock rise, it is very likely that the price will return to the starting point or lower in the later trend, but it can continue to rise. This is a feature of the shock. At the same time, the current market is not extremely strong and is still in the shock rise. Therefore, don't chase more, but retrace to support more.
Investment strategy: Gold 3340 short, stop loss 3050, target 3200

Xauusd.4h chart pattrentrend line and is showing strong bullish momentum, that supports your target of 3365. Here's a quick technical outlook based on your info:
Entry: 3272
Target: 3365
Trend: Bullish breakout (potential for continuation)
Upside Potential: 93 points
Suggested Stop-Loss (if not set): Near recent support or just below breakout zone (e.g., 3245–3250) for risk management
Watch for confirmation like:
Strong bullish candles on higher timeframes (e.g., 1H, 4H)
Volume increasing on the breakout
Retest of the trend line acting as support
Would you like a visual chart analysis or real-time gold price check?

Gold Climbs on Safe-Haven DemandGold climbed to nearly $3,360 per ounce on Tuesday, marking its highest level in over a week, as renewed tariff threats from President Trump increased safe-haven demand. Trump announced a 100% tariff on foreign films and signaled upcoming measures targeting pharmaceuticals. Investors are now focused on the Federal Reserve’s policy decision, with rates expected to stay unchanged despite Trump’s push for cuts.
Resistance is expected at $3,385, then $3,450 and $3,500. Support stands at $3,300, followed by $3,265 and $3,200.
Gold prices surge as risk aversion risesGold has now broken through strongly and stabilized above 3350. Gold fell back in the Asian session and went long. Gold bulls restarted and accumulated energy. Now gold bulls obviously occupy a dominant position. Gold fell back in the Asian session and could only go long. For the current market, don't chase it easily. The market fluctuates too much. Wait patiently for the opportunity to go long after the decline.
The 1-hour moving average of gold has begun to cross upward to form a golden cross. Gold bulls have begun to exert their strength. After gold broke through the 3350 line yesterday, gold fell back to around 3305 and continued to exert its strength. In the short term, 3350 is the key to the turning point of gold bulls and bears. Gold fell back to 3350 in the early trading, which is an opportunity to go long on dips.
The market changes rapidly. Since gold bulls are more powerful at the moment, gold will continue to go long. After the adjustment of gold bulls, the bottom rose. Then the gold bulls may have just begun, and the gold bulls are expected to continue to rise.
Buy range: 3350-3348, SL: 3338, TP: 3370-3380
Sell range: 3395-3397, SL: 3407, TP: 3375-3365
Key points:
First support: 3350, second support: 3340, third support: 3330
First resistance: 3390, second resistance: 3400, third resistance: 3410
For more free sharing, please click on my avatar

15-minute gold time frame analysis
To start the market structure, the 15-minute market is currently bearish, but to start an upward movement, it can be expected to reach the order block 3259-3263 and then continue towards the support area 3220-3210 and from this area it will rise towards the liquidity of the dynamic line of the 1 and 4-hour time frames. If the initial market rise closes above 3264, any lower market pullback is considered an upward trend.

As expected, gold prices continue to fall
📌 Gold driving factors
There are two aspects to look at the impact of April non-agricultural data on the gold market.
One is the data itself and the existing economic environment, and the other is combined with the technical aspect.
The market itself is troubled by the tariff issue. Whether it is the US stock market or the US dollar, they all need good economic data to boost. Once the April non-agricultural performance is poor, the market sell-off will be out of control, and it also means that the risk of US economic recession will increase.
Secondly, good data performance reduces the Fed's expectations for rate cuts. As we all know, the Fed's expectations for rate cuts or implementation of rate cuts are theoretically good for gold prices, and vice versa.
The cooling of the tariff issue may come soon, which is also not conducive to the rise in gold prices, but cooling does not mean the end, and the final achievement will definitely take some time.
📊Comment Analysis
Recently, we have been very good at controlling the gold market. Keeping an eye on the changes in fundamental news is the focus of research and judgment. Of course, the technical direction is also of reference value. The next market will revolve around fundamental news, especially in the context of tariffs.
The non-agricultural data exceeded expectations, and the tariff issue may see "dawn". If it can be confirmed in the near future, the risk aversion sentiment will subside in the short term, which is not conducive to the rise of gold prices. There is a high probability that there is room for retracement, so there is no rush to chase now.
💰Strategy Package
Operation ideas for next week:
Gold 3265 short, stop loss 3275, target 3230-3220;.
⭐️ Note: Labaron hopes that traders can properly manage their funds
- Choose the number of lots that matches your funds
- Profit is 4-7% of the capital account
- Stop loss is 1-3% of the capital account

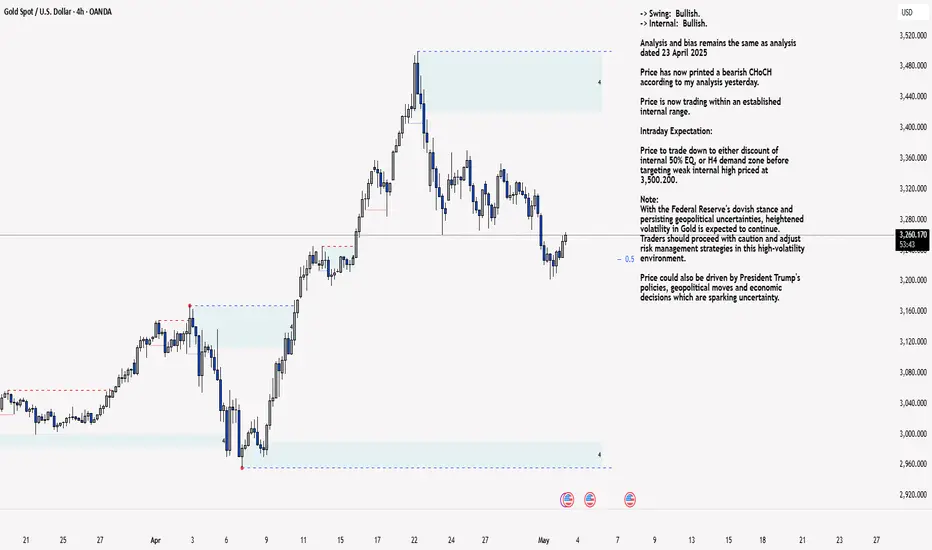
XAU/USD 02 May 2025 Intraday AnalysisH4 Analysis:
-> Swing: Bullish.
-> Internal: Bullish.
Analysis and bias remains the same as analysis dated 23 April 2025
Price has now printed a bearish CHoCH according to my analysis yesterday.
Price is now trading within an established internal range.
Intraday Expectation:
Price to trade down to either discount of internal 50% EQ, or H4 demand zone before targeting weak internal high priced at 3,500.200.
Note:
With the Federal Reserve's dovish stance and persisting geopolitical uncertainties, heightened volatility in Gold is expected to continue. Traders should proceed with caution and adjust risk management strategies in this high-volatility environment.
Price could also be driven by President Trump's policies, geopolitical moves and economic decisions which are sparking uncertainty.
H4 Chart:
M15 Analysis:
-> Swing: Bullish.
-> Internal: Bearish.
As mentioned in yesterday's analysis dated 01 May 2025 whereby I mentioned that I would continue to monitor price and depth of bullish pullback following the printing of a bearish iBOS followed by a bullish CHoCH.
Price did not pullback significantly enough to warrant a further bearish iBOS, therefore, I will apply discretion and not classify this as such, I have however marked in red.
Price has since continued bearish, subsequently printing a bullish CHoCH.
Internal structure is now established, however, I will continue to monitor price regarding depth of pullback as previous.
Intraday Expectation:
Price to trade up to either premium of internal 50% EQ, or M15 supply zone before targeting weak internal low priced at 3,201.955
Note:
With the Federal Reserve maintaining a dovish stance and ongoing geopolitical tensions, volatility in Gold prices is expected to remain elevated. Traders should exercise caution, adjust risk management strategies, and stay prepared for potential price whipsaws in this high-volatility environment.
Trump's tariff announcement will most likely cause considerably increased volatility and whipsaws.
M15 Chart:
XAUUSD LONG Buy At 3250 With SL3246 TPAt 3265
Reason: XAUUSD At 20 EMA. Below That, It Will Go To A Low Level. So Small Sl Below 20 Ema.

XAUUSD - Demand Zone Bounce or Just a Dead Cat? Gold (XAUUSD) is testing a critical demand zone after a strong bearish momentum, currently trading around $3,227. The drop of over 1.8% brings price back to a previously respected bullish order block highlighted in orange.
What’s happening?
Strong supply zone between $3,320 - $3,336 (blue box) triggered heavy selling.
Price broke through $3,280 and $3,234 support zones.
Now sitting on a key demand area, previously a reversal point — watch closely for bullish structure or further breakdown.
Key Levels:
Demand Zone: $3,210 – $3,234 (orange box)
Resistance to Watch: $3,234 (minor) & $3,280
Support Below: $3,200 psychological round number
Possible Scenarios:
1. Bullish Rejection: Watch for bullish engulfing or double bottom near current price.
2. Breakdown: Clean break and close below $3,210 may signal continuation to $3,180 or lower.
RSI, volume, and any candlestick confirmation will be key for entry timing.
---
#Gold #XAUUSD #SupplyAndDemand #Forex #Trading #PriceAction #SmartMoney #LuxAlgo #TechnicalAnalysis

Gold Potential Bullish ContinuationAfter a considerable retracement, Gold price still seems to exhibit signs of overall Bullish momentum as the price action may form a credible Higher Low with multiple confluences through key Fibonacci and Support levels which presents us with a potential long opportunity.
Trade Plan:
Entry : CMP 3220
Stop Loss : 2946
TP 0.9 - 1 : 3490

GOLD MAP TO THE PIPRealy Hopw Yu Guys Had Taken the The sells and Are Buying Right now
Levels on the Chart
