XAUUSD - Gold Trend Before FOMC!Gold is trading above its EMA200 and EMA50 on the 4-hour timeframe and is trading on its uptrend line. A continued upward move in gold will put it in the supply zone, where it is possible to look for short positions. A downward correction in gold will also open up long positions.
Gold traders endured another turbulent week, marked by the second consecutive decline in prices—once again underscoring the market’s acute sensitivity to economic news and developments.
Adrian Day, CEO of Adrian Day Asset Management, offered a cautiously humorous take on the situation by likening it to the Peggy Lee song that asks, “Is that all there is?” He pointed out that gold has pulled back by over 7% from its recent high in less than two weeks.Although this correction is notable, it hasn’t been deep enough to flush out all short-term traders or weak-handed investors from the market.
Day added that rising fears of a U.S. recession—which typically exert early downward pressure on gold—alongside the possibility of easing U.S.-China trade tensions, may limit investment demand for gold in the short term. Concluding his comments, he maintained a cautious stance, saying that further downside remains likely and that his outlook for the coming week is bearish.
Meanwhile, U.S. President Donald Trump, in a new interview with NBC, addressed several key economic and political issues. He stated that if necessary, the deadline for selling TikTok would be extended, and some tariffs on Chinese goods might become permanent. Nevertheless, he indicated that he is also considering reducing certain tariffs in the future.
Trump emphasized that small businesses do not require additional assistance and that the Federal Reserve should cut interest rates. He confirmed that Jerome Powell will remain Fed Chair through the end of his term in 2026. He also mentioned potential successors for his own position, naming Vance and Rubio as possibilities.
After a week dominated by employment data, the upcoming week will be entirely focused on monetary policy. The centerpiece will be the May FOMC meeting, the Fed’s rate decision, and Jerome Powell’s press conference on Wednesday. While markets broadly expect the Fed to hold rates steady, Powell’s official remarks and answers to press questions—especially following his sharp tone earlier in April—will be under close scrutiny.
It is widely expected that the Federal Reserve will leave its key interest rate unchanged on Wednesday, as policymakers assess how President Trump’s tariffs gradually impact various sectors of the economy. Markets are currently pricing in a potential rate cut starting in July. The Fed’s dual mandate is to maintain low inflation and high employment, and it may face a dilemma if tariffs negatively affect both indicators, as many economists now warn.
Immediately following the Fed meeting, senior policymakers including Barr, Kugler, Waller, and Cook will travel to Iceland to attend the Reykjavik Economic Conference. On Friday, they will participate in panels discussing artificial intelligence, labor market trends, and monetary research—topics that could offer insights into the Fed’s long-term policy direction.
Simultaneously, traders are also awaiting two key reports: the ISM Services Index for May, due today, and weekly jobless claims figures set for release on Thursday. Together, these reports will help complete the picture of the U.S. economy as critical monetary policy decisions approach.
GOLDCFD trade ideas

(XAU/USD – Gold Spot, 1H Chart) Long🔍 Technical Analysis (XAU/USD – Gold Spot, 1H Chart)
🔹 Chart Structure & Trendlines
Descending Trendline Breakout: Price has decisively broken above the long-standing descending trendline, indicating a potential bullish trend reversal.
Horizontal Support/Resistance:
Key support zone: Around 3260–3270, shown with horizontal cyan lines and multiple bounce points (green arrows).
Key resistance zones:
Minor resistance at 3334.48.
Strong resistance at 3358.62 (previous structural high).
🔹 Price Action Insights
Double Rejection & Breakout: After testing the descending trendline twice (red arrows), price finally broke above it with strong bullish momentum.
Retest Expected: Price may retest the 3260–3270 support zone (previous resistance and trendline convergence), which aligns with standard breakout-retest-continuation behavior.
Projected Targets:
Target 1: 3334 (recent high/resistance).
Target 2: 3358 (next major resistance).
🔹 Bullish Structure Confirmation
Higher lows and higher highs are forming.
Bullish engulfing breakout candle above resistance zone.
🌐 Fundamental Analysis – Key Drivers for Gold (XAU/USD)
🔸 Global Economic Context
U.S. Dollar Weakness: If recent U.S. economic data (jobs, inflation) shows signs of cooling, it weakens the dollar, boosting gold prices.
Fed Policy Outlook: Markets are closely watching the Federal Reserve’s stance on rate cuts. Dovish signals (rate cuts or pause) tend to support gold due to its inverse relationship with real yields.
🔸 Geopolitical & Safe-Haven Demand
Any rise in geopolitical tensions (e.g., Middle East, Eastern Europe) increases demand for gold as a safe-haven asset.
Recent market uncertainty may explain the breakout move shown on the chart.
🔸 Inflation & Commodities Correlation
Persisting inflation keeps gold attractive as an inflation hedge.
Rising oil prices also tend to support gold prices due to commodity correlation and inflationary spillovers.
📈 Conclusion & Outlook
Technical Bias: Bullish (breakout confirmed with clean structure).
Fundamental Bias: Mildly bullish to bullish, depending on Fed tone and macroeconomic prints.
Short-term Strategy: Look for a retest around 3260–3270 as a potential long entry zone targeting 3334 and 3358.
Risk Management: Use stops below 3250 to protect against false breakouts.

Gold's Momentum ContinuesI've been waiting for price to tap 3211 to look for the buys setup.
This is a classic 1,2,3 bullish flag that has potential to see Gold to ATH once more

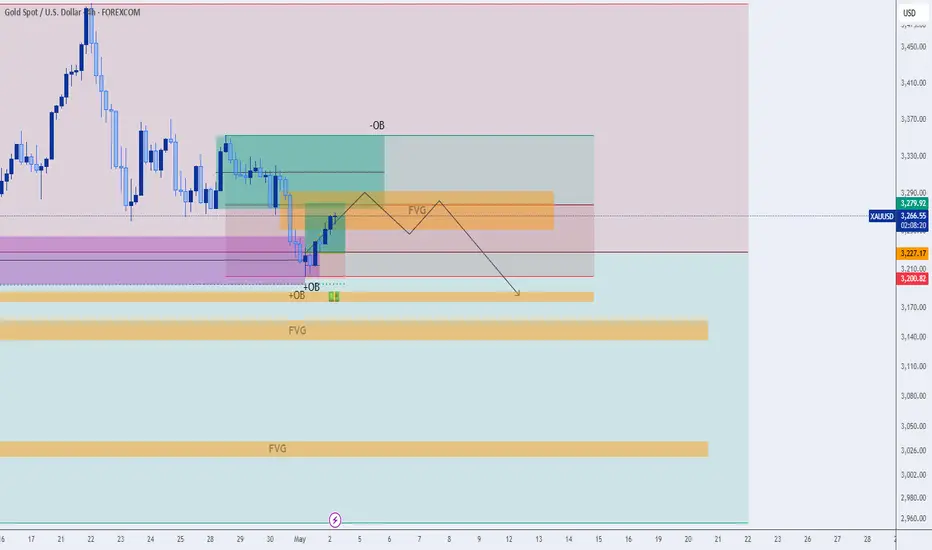
Gold Outlook: After Breaking 3,260 — Is 3,000 the Magnet?Gold Weekly Forecast
Gold closed last week below the previous weekly lows at 3,260, confirming bearish intent. Price has now left behind multiple imbalances from the bullish leg that started at the 3,000 level.
We could first see a retracement to the small imbalance zone around 3,300, followed by a bearish continuation back to the main support/imbalance zone near 3,000.
Sideways price action is likely early in the week — but unless bulls reclaim 3,300+, momentum favors a retest of the base.
Bias: Bearish
Key Zones:
• Resistance / Rebalance: 3,300
• Support / Imbalance Target: 3,000
—
Weekly forecast by Sphinx Trading
Drop your view in the comments.
#Gold #XAUUSD #GoldForecast #LiquidityVoids #TechnicalAnalysis #SphinxWeekly #SmartMoney #FVG #3kLevel

XAUUSD Sell IdeaAll eyes on XAUUSD this week. A bearish flag has been printed on the hour chart. I am expecting price to create Monday's high at around 3246 then drop 46 points towards 3200.

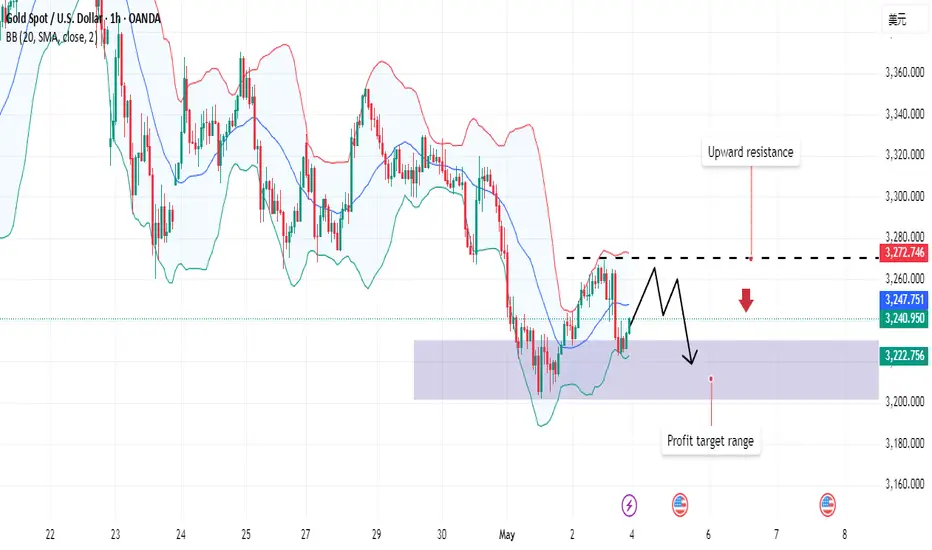
Gold fell as expected. What will happen next week?Gold fell within the range expected by Quid. Although it rebounded slightly, the final result did not change. Will the direction of gold change next week?
Quid's analysis:
Gold's 1-hour moving average is downward, and there is a trend of continuous downward development; gold is currently under pressure from the 3270 line, so 3270 will still be the key turning point for gold bears next week. Although gold has rebounded slightly, the magnitude of the decline is not large; if the upward resistance level of 3270 fails to break through next week, it may be in a sideways fluctuation.
The downward trend will not reverse for the time being, unless major news is released on the weekend, which directly affects the gold market.
Quid believes that the ups and downs of the market are normal. Gold has fallen by about $300 from its high point, and the overall trend in the near future is still downward; it continues to fall after a small rebound, which means that the strength of gold bears is still there.
Quide believes that it is always easy to follow its trend; violating its rules always makes oneself exhausted; the market is always right, and standing on the opposite side of the market will always be taught a lesson by the market. In the face of the overall trend, traders should not be lucky, and the market will not forgive your mistakes again and again.
Operation strategy:
Short around 3270, stop loss at 3280, take profit around 3220;
Daily Analysis: 30‑04‑2025Spot gold closed yesterday with a 1.5% loss at 3239, marking its third consecutive day of decline. However, the market opened today with some buying activity. Since the full impact of the trade war has yet to materialize, weak economic data from both the U.S. and China—combined with a statement from China’s Ministry of Commerce indicating it is considering a negotiation offer on tariffs—has been interpreted as a sign of easing tensions.
Given these developments, potential gains in gold prices may remain limited in the short term. In this context, as long as the price fails to break above the 3270 resistance level, 3200 remains a likely target. The next support and resistance levels are seen at 3180 and 3300, respectively.

Gold Technical Update (4H Time Frame) / Gold BullishAs we mentioned last week, gold was consolidating on the 4H time frame. After the breakout, all our projected targets were successfully achieved as of yesterday.
Currently, gold is forming a bullish flag pattern on the 4H chart — a continuation pattern that often signals the potential for further upside.
If gold sustains above the 3275–3280 zone, we may see renewed bullish momentum with the following potential targets:
Target 1: 3300
Target 2: 3340
Target 3: 3360
Target 4: 3400
⚠️ This is a technical analysis-based outlook. Traders are advised to manage their positions with proper risk-reward strategies and stay updated with market developments.

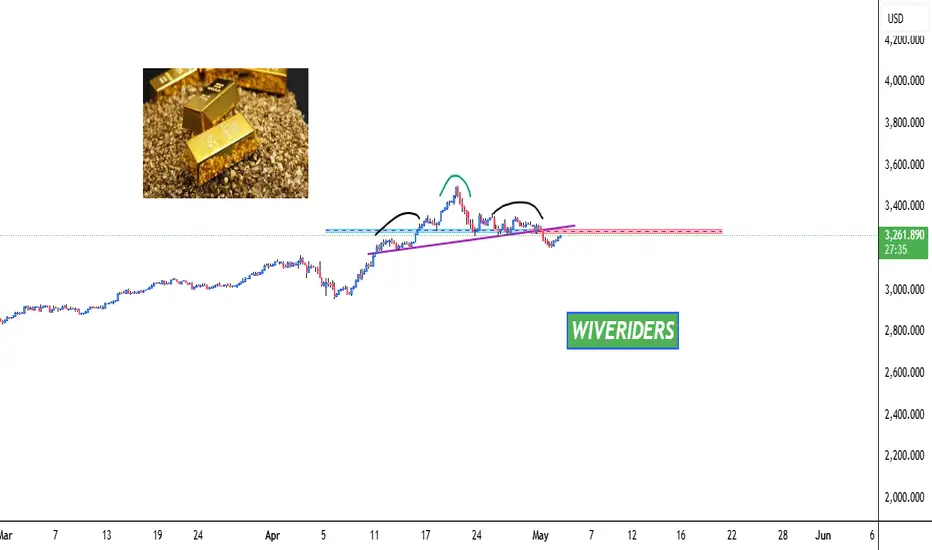
GOLD Formed Bearish Head and Shoulders Pattern🚨 TVC:GOLD Formed Bearish Head and Shoulders Pattern 🚨
TVC:GOLD has formed a bearish head and shoulders pattern and appears to be making a pullback to the neckline before a potential drop. However, if the price breaks out above the right shoulder, the bearish pattern could be invalidated.
📈 Technical Overview:
Pattern: Bearish Head and Shoulders
Neckline: Current pullback area.
Bearish Confirmation: A drop below the neckline could confirm the bearish move.
Invalidation: If the price breaks out above the right shoulder, the bearish pattern may be invalidated.
Gold on Edge – Will NFP Trigger the Next Big Move?🚨 Gold at a Crossroads – Will NFP & White House Comments Trigger a Volatility Spike? ⚡
🧭 Macro Overview
Gold enters the US session with a mild rebound after a sharp selloff, following its historic climb to $3,500/oz. The recent drop was driven less by fundamentals and more by aggressive profit-taking, especially from retail flows in Asia, notably China.
Rather than a trend reversal, this correction looks like a healthy technical reset, just ahead of two major catalysts:
1️⃣ US Non-Farm Payrolls (May edition)
2️⃣ White House remarks on tariffs and trade strategy
These two factors will likely define gold’s direction heading into next week — either toward deeper support zones or a potential recovery rally into resistance.
📊 DXY & Macro Market Lens
The US Dollar Index (DXY) has bounced off its base near 98.xx, currently testing the 100.00 level. Whether the dollar strengthens further depends largely on today’s labour data and fiscal signals from Washington.
Traders should remain tactically neutral, relying on intraday timeframes like H1/H2 and respecting key price structure.
🔺 Key Resistance Levels
3,260
3,275
3,285
3,312
🔻 Key Support Levels
3,244
3,230
3,215
3,200
🎯 Trade Plan – Friday 3rd May, 2025
🔵 BUY ZONE A:
Entry: 3,232 – 3,230
SL: 3,226
TP: 3,236 → 3,240 → 3,244 → 3,248 → 3,252 → 3,256 → 3,260
🔵 BUY ZONE B:
Entry: 3,214 – 3,212
SL: 3,208
TP: 3,218 → 3,222 → 3,226 → 3,230 → 3,235 → 3,240
🔴 SELL ZONE:
Entry: 3,276 – 3,278
SL: 3,282
TP: 3,272 → 3,268 → 3,264 → 3,260 → 3,250
⚠️ Final Notes
Volatility may spike sharply during the NY session as NFP and political news collide.
This is the kind of session where traders can either capitalize massively or get caught offside — stay disciplined.
Avoid emotional entries — let price come to you, wait for confirmation, and stick to your TP/SL.
📣 Conclusion
We’re likely in a calm-before-the-storm scenario. Gold hasn’t made its real move yet — but when it does, it’ll be swift.
Prepare. Execute. Protect your capital.

#XAUUDA Short Signal? A "close below 3250 short signal" for #XAUUSD** (Gold Spot/U.S. Dollar) indicates a potential bearish trading opportunity if the price closes below the key level of **3,250** on the 15-minute chart. Here's the breakdown:
### Key Observations:
1. **Current Price**: 3,251.365 (slightly above 3,250).
2. **Critical Level**: 3,250 acts as a psychological and technical #support/#resistance level.
3. **Bid/Ask Spread**:
- **SELL (Bid)**: 3,250.770
- **BUY (Ask)**: 3,251.590
#Signal Interpretation:
- #Short_Signal_Trigger**: A confirmed close **below 3,250** on the 15m chart suggests weakening bullish momentum and potential downward movement.
- **Targets**: The next support levels to watch are **3,248 → 3,244 → 3,240**, with stronger support near **3,215–3,207**.
- **Invalidation**: A rebound above **3,256–3,260** would negate the bearish bias.
### Execution Tips:
- **Confirmation**: Wait for a full 15m candle to close below 3,250 to avoid false breakdowns.
- **Risk Management**: Place a stop-loss just above recent resistance (e.g., 3,256–3,260) to limit downside risk.
- **Context**: Monitor broader market conditions (e.g., USD strength, geopolitical events) that could impact gold prices.
This setup aligns with a classic technical trading strategy, leveraging price action around key levels. Always validate with additional indicators (e.g., RSI, volume) if available.

Bearish GoldLooking to retest 3165 level, very important level since it was broken and never retested. A break thereof might lead to lower levels

XAUUSD Scalping SetupThis chart shows a potential scalping buy setup on the 15-minute XAUUSD chart. After a strong bearish drop, price found support near the 3,220 level, forming a bullish rejection with increasing volume—an early sign of buyers stepping in. The RSI is recovering from oversold levels, suggesting room for upward movement. The marked red zone around 3,270 represents a likely resistance or supply area, where price may face selling pressure again. A short-term buy could be considered as price pushes up from the current level, targeting the red zone for a quick profit. This setup anticipates a bounce toward resistance before a potential reversal or continuation of the larger downtrend.

GOLD GOLD ,as market makers continues to take profit to correct overbought market we are seeing many support level fail to hold price.the 3rs and 4hr ema+sma is giving a signal of buy which is confirmed by market structure.

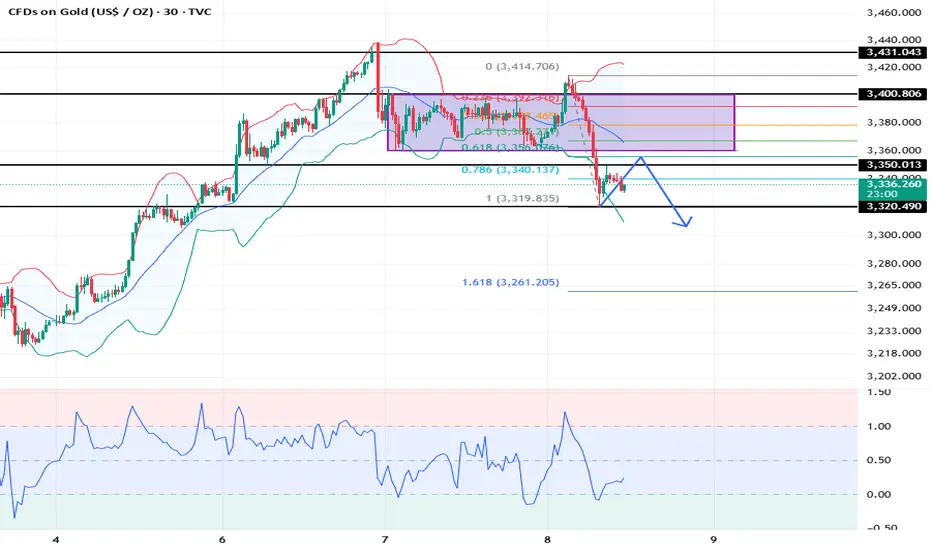
XAUUSD: 8/5 Today’s Market Analysis and StrategyGold technical analysis
4-hour chart resistance level 3410, support level 3310
1-hour chart resistance level 3380, support level 3310
30-minute chart resistance level 3350, support level 3320.
Trump said that he would hold a "large press conference" at 10 a.m. Eastern Time tomorrow, and may sign a trade agreement with the UK. Therefore, the news affected the gold price.
Russia implemented a ceasefire from 0:00 on May 8 to 0:00 on May 11 local time. The temporary ceasefire between Russia and Ukraine and the repeated situation in the Middle East may support the gold price in stages due to the risk aversion demand.
Recently, affected by the news, the daily operation range of gold is very large. Today, we will first look at the 3320-3360 range of fluctuations in the short term. If it breaks through, follow the trend and strictly stop loss!
Buy: 3323 SL: 3318
Sell: 3355 SL: 3360
More free analysis daily sharing
Gold fluctuates at high levels and washes out repeatedly!In terms of short-term operation ideas for gold, it is recommended to short on rebound and long on pullback. The short-term focus on the upper side is 3420-3438 line resistance, and the short-term focus on the lower side is 3350-3360 line support.

The exclusive bearish view on gold is in line with expectations!Gold's 1-hour moving average high also began to turn around, and the bulls were hit. If the rebound pressure is 3350, it is short. At present, gold has fallen below yesterday's 3350 rising platform, so it will fall back and pay attention to the vicinity of 3303! There is nothing to hesitate. The rebound of 3350 is an opportunity to increase positions and short, and the target is near 3305! Since the bullish volume of the gold market has been released, the bulls need to be repaired in the short term to rise further. Gold will go short in the afternoon. On the whole, it is recommended to rebound and short as the main operation strategy for gold in the short term, and to go long as the callback. The short-term focus on the upper side is 3350-3360 resistance, and the short-term focus on the lower side is 3300-3305 support.

What’s America's Real Goal in a Possible India–Pakistan War?We are nearing the end of the petro-dollar era. The power balance of the new world order will be defined not by oil, but by the strategic resources essential for AI, electric vehicles, and cutting-edge technology.
Throughout the 20th century, the U.S. maintained its global dominance by controlling access to oil. From the Middle East to Latin America and Africa, wherever oil was found, the U.S. was there.
But today, the focus has shifted to rare earth elements, lithium, copper, and other strategic minerals.
Trump’s 2025 move to buy Greenland wasn’t a diplomatic joke—it was a signal. Behind-the-scenes deals in Ukraine for rare earth deposits tell the same story: whoever controls these "white gold" assets will lead the tech-driven world.
Now enters Pakistan, with mineral-rich lands spanning over 600,000 km², nearly three times the size of the UK. Experts estimate its underground reserves to be worth $8 trillion.
In Balochistan's Rekodik field alone, there are 12 million tons of copper and 20 million ounces of gold, with a copper purity of 0.53%, well above global standards. In the north, newly discovered lithium reserves could be a game-changer for the EV revolution.
This is no longer just about resources—this is about deciding the future balance of global power.

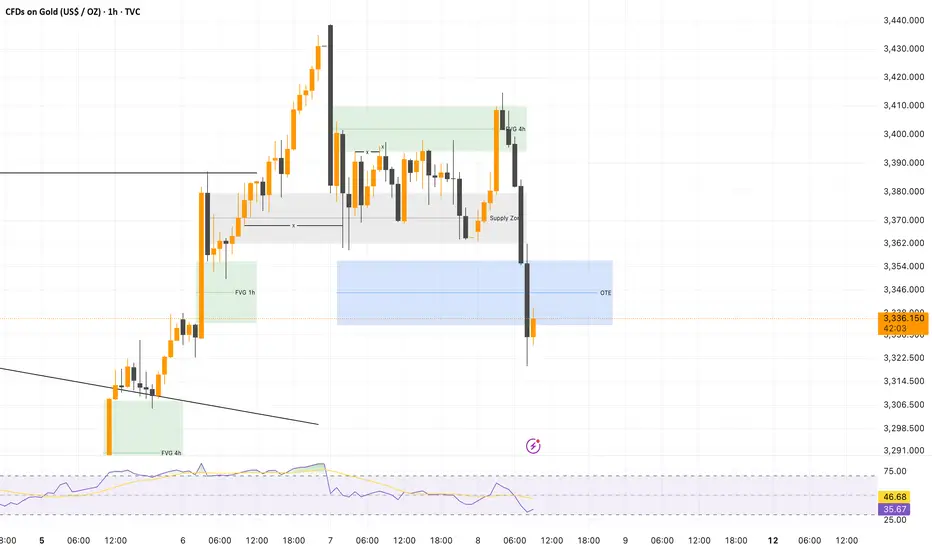
Gold (XAU/USD) Analysis – 1H
🏛 1. Current Market Structure
📉 Gold just made a sharp drop into the OTE zone, breaking through the Supply Zone without much resistance.
🔎 This move suggests a liquidity sweep, possibly targeting deeper levels before any significant recovery.
🌍 2. Bigger Picture Outlook
⚠️ With the 4H FVG now acting as a strong resistance, the market is testing the OTE zone for potential support.
💰 If this zone fails to hold, we could see a deeper correction towards the next major demand area around $3,300.
🔍 3. Key Technical Observations
🟩 4H FVG: Now acting as a supply block, capping recent bullish attempts.
🟦 OTE Zone: Major liquidity area, potential bounce point if buyers step in.
⬜️ Supply Zone: Clearly lost its strength, now likely to act as resistance on any retest.
🎯 4. Short-Term Expectations
📉 Bearish Scenario:
Continuation through the OTE
Deeper liquidity grab toward $3,300
Potential stop hunt before a bullish reversal
📈 Bullish Scenario:
Strong bounce from the OTE
Reclaim of the Supply Zone
Potential push back toward $3,400+ if volume supports it
🔥 5. Upcoming Catalysts
🕰 US Economic Data: Short-term volatility expected.
📊 Volume Confirmation: Critical for validating a bullish recovery.
🔎 Order Flow: Watch for fakeouts and liquidity traps around the OTE.
✅ Conclusion
👉 Gold just tapped a key OTE zone – a make-or-break level for the current structure.
📍 Key levels to watch:
4H FVG (~$3,380 - $3,400)
OTE Zone (~$3,320 - $3,330)
Deeper liquidity areas if the sell-off intensifies
⏳ Stay alert, as the market is likely to remain volatile in the short term.
XAUUSD H4 Bullish Bounce Based on the H4 chart analysis, the price is falling toward our buy entry level at 3267.47, a pullback support that aligns close to the 78.6% Fibonacci retracement.
Our take profit is set at 3352.49, a pullback resistance.
The stop loss is placed at 3202.42, a swing low support.
High Risk Investment Warning
Trading Forex/CFDs on margin carries a high level of risk and may not be suitable for all investors. Leverage can work against you.
Stratos Markets Limited (tradu.com):
CFDs are complex instruments and come with a high risk of losing money rapidly due to leverage. 63% of retail investor accounts lose money when trading CFDs with this provider. You should consider whether you understand how CFDs work and whether you can afford to take the high risk of losing your money.
Stratos Europe Ltd (tradu.com):
CFDs are complex instruments and come with a high risk of losing money rapidly due to leverage. 63% of retail investor accounts lose money when trading CFDs with this provider. You should consider whether you understand how CFDs work and whether you can afford to take the high risk of losing your money.
Stratos Global LLC (tradu.com):
Losses can exceed deposits.
Please be advised that the information presented on TradingView is provided to Tradu (‘Company’, ‘we’) by a third-party provider (‘TFA Global Pte Ltd’). Please be reminded that you are solely responsible for the trading decisions on your account. There is a very high degree of risk involved in trading. Any information and/or content is intended entirely for research, educational and informational purposes only and does not constitute investment or consultation advice or investment strategy. The information is not tailored to the investment needs of any specific person and therefore does not involve a consideration of any of the investment objectives, financial situation or needs of any viewer that may receive it. Kindly also note that past performance is not a reliable indicator of future results. Actual results may differ materially from those anticipated in forward-looking or past performance statements. We assume no liability as to the accuracy or completeness of any of the information and/or content provided herein and the Company cannot be held responsible for any omission, mistake nor for any loss or damage including without limitation to any loss of profit which may arise from reliance on any information supplied by TFA Global Pte Ltd.
The speaker(s) is neither an employee, agent nor representative of Tradu and is therefore acting independently. The opinions given are their own, constitute general market commentary, and do not constitute the opinion or advice of Tradu or any form of personal or investment advice. Tradu neither endorses nor guarantees offerings of third-party speakers, nor is Tradu responsible for the content, veracity or opinions of third-party speakers, presenters or participants.

GOLD BUY WITH LIMIT ORDER!!Xauusd price made a sharp rejections off the VAH on the bigger time frame price is heading for a retest to the POC point at 3,306 and am expecting a liquidity sweep from that point then holding till new highs is created 3,500 is my target
JOIN AND ENJOY..........

XAUUSD GOLD - CLEAN SETUP FOR SHORT. XAUUUSD 1D TF
Gold is looking for correction and seems to follow technical EMAs.
