Hanzo | Gold15 min Retest – Confirm the Next Move🆚 Gold – Hanzo’s Strike Setup
🔥 Timeframe: 15-Minute (15M)
——————
💯 Main Focus: Bullish Breakout at 3327
We are watching this zone closely.
💯 Main Focus: Bearish Breakout at 3300
We are watching this zone closely.
📌 If price breaks with high volume, it confirms Smart Money is in control, and a strong move may follow.
———
Analysis
👌 Market Signs (15M TF):
• Liquidity Grab + CHoCH at 3361
• Liquidity Grab + CHoCH at 3336
• Strong Rejections seen at:
➗ 3270 – Major support / Key level
➗ 3300 – Proven resistance
🩸 Key Zones to Watch:
• 3300 – 🔥 Bullish breakout level X 3 Swing Retest
• 3345 – Strong resistance (tested 5 times)
• 3270 – Equal lows
• 3370 – Equal highs
GOLDCFD trade ideas

GOLD BUY ANALYSIS.Just like how i shared about the bearish move that we are now currently seeing on PEPPERSTONE:XAUUSD , it is happening live at the moment. this post contains the zone where i think team team bullish will step in to defend gold. im also trading this setup as well with full confident. for further info, pls see the info of the video.

Technical analysis of short-term gold operations!!!On Wednesday, the gold price generally showed a downward trend. The highest price rose to 3327.91 on the day, and the lowest price fell to 3266.79, closing at 3288.16. In view of the fact that gold fell under pressure during the early trading on Wednesday and broke through the four-hour and daily support as expected, and then the US market rebounded again and came under pressure, and finally ended in a big negative state at the daily level. The price has fallen below the daily support, so we need to pay attention to the continuation of the band decline in the future.
From a multi-cycle analysis, first observe the monthly rhythm. The price rose for three months in the early stage and then a single-month correction appeared. Recently, it has risen for four months and then a single-month correction appeared. Therefore, according to the rhythm, four consecutive positives have appeared. For May, we must pay attention to market risks. From the weekly level, the gold price is supported by the support level of the 3040 area. From the perspective of the medium-term, we can continue to maintain a bullish view, and the price drop is only a correction in the medium-term rise. From the daily level, the current price resistance is in the 3007 area, which is the key watershed of the band trend. If the price is below this position, the subsequent band will be treated as short. At the same time, for the short-term four-hour price resistance, it is around 3290, so the subsequent price will be treated as short under the four-hour resistance. In general, the price can be treated as short under the four-hour resistance and the daily resistance.

GOLD BULLISH MOMENTUM SOONGold recently touched its all time high 3500 but it reversed immediately
so we expecting gold to go bullish it surpass the highlighted supply zone and bearish if its below it
Buy!Hello all. as I see here, market returned from an LOZ and it needs a Node to go Higher. I think it is a good Option to go buy.

GOLD...LONGPYTH:XAUUSD
Market structure suggests is preparing for its next move.
The AND level will likely play a critical role in the upcoming direction.
** If structure breaks and confirms the shift, a new bias might form after the retest. **

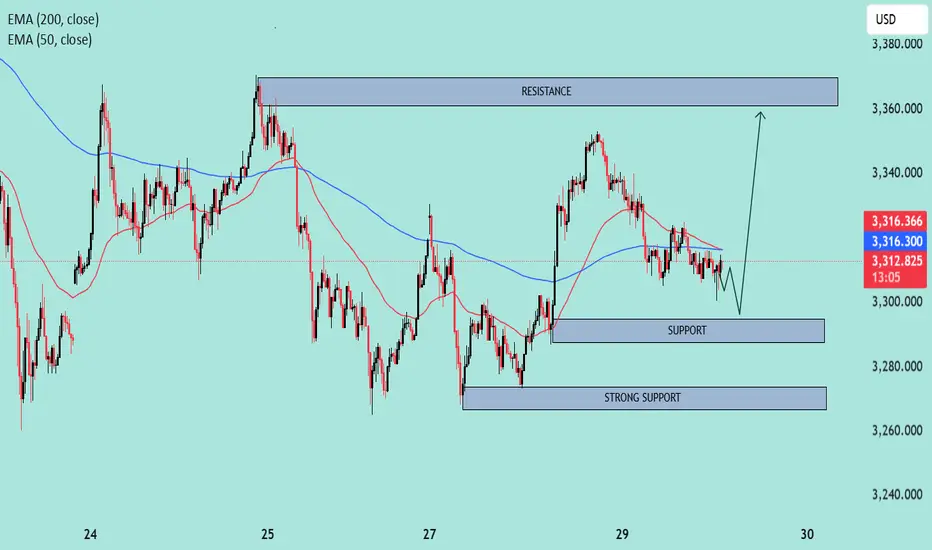
XAUUSD – Bullish Reversal Setup Near Support🟦 Chart Context:
Type: Intraday (likely 15m or 1h timeframe).
Indicators Used:
EMA 50 (Red): 3,316.497
EMA 200 (Blue): 3,316.332
Current Price: 3,312.650
🔍 Technical Analysis:
1. Trend & Moving Averages:
EMA Crossover (Bearish): The 50 EMA is slightly above the 200 EMA, but both are flat and converging, suggesting a neutral to slightly bearish short-term sentiment.
Price below both EMAs indicates bearish pressure in the immediate term.
2. Key Zones:
Resistance Zone: 3,355 – 3,370
Price was previously rejected from this zone, indicating strong supply and likely sell orders.
Support Zone: 3,295 – 3,305
Price has bounced here multiple times, suggesting active buyers.
Strong Support: 3,265 – 3,275
A broader and more historically respected area that could lead to a significant reversal if tested.
3. Price Action:
Currently forming lower highs and lower lows, which is a classic sign of short-term weakness.
A small descending triangle appears to be forming near the support level (bearish bias), but the drawn forecast suggests a potential fakeout breakdown followed by a bullish reversal.
4. Expected Scenario (as per chart projection):
Price might dip briefly into the 3,295–3,305 support, triggering liquidity grab (stop hunts).
A potential bullish rally towards the 3,355–3,370 resistance zone is expected.
This suggests a buy-the-dip strategy near support with tight risk management.
📈 Trade Outlook:
🟢 Bullish Bias:
If the support at 3,295–3,305 holds and price reclaims the 200 EMA convincingly.
Target: 3,355–3,370 resistance zone.
🔴 Bearish Bias:
If price breaks below the strong support (3,265), expect continuation lower.
Downside targets would then extend towards 3,240–3,250.
✅ Conclusion:
Current bias: Neutral to short-term bearish unless the lower support holds.
Key action zone: Watch price reaction around 3,295.
Strategy suggestion: Monitor for a bullish reversal signal at support; avoid chasing trades in the middle of the range.
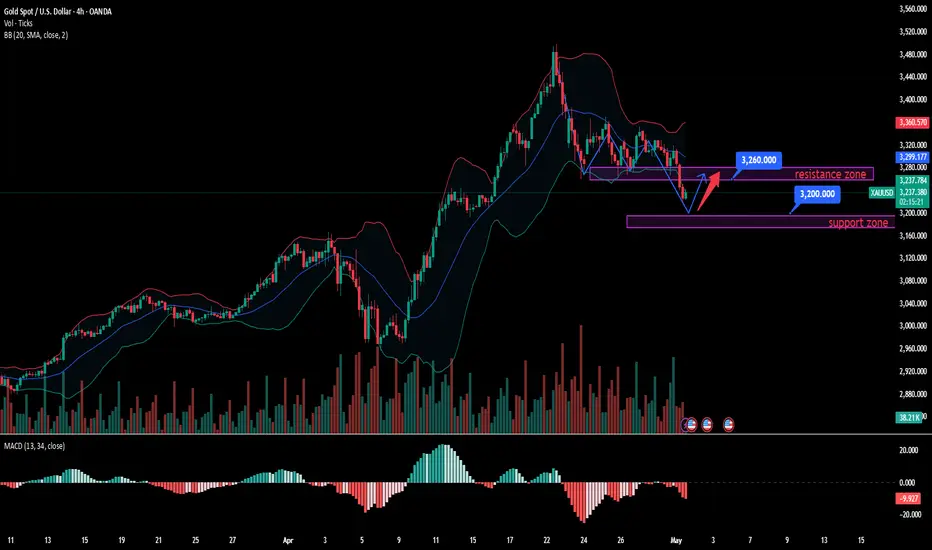
XAUUSD:Sharing of the Latest Trading StrategiesYesterday, catalyzed by the ADP and GDP data, gold rebounded. However, today the United States and Ukraine reached an agreement, and the Trump administration hinted at a possible reduction in tariffs on some trading partners. The market's expectation for the relaxation of the trade situation has increased, leading to a decline in the safe - haven demand for gold. Currently, the key support level has been broken. The support at 3,260 has turned into resistance, and the important technical support below is at 3,220. Above this level, a rebound can be expected. If 3,220 is broken, the strong support at 3,200 will be the next target. But before it is broken, it is advisable to go long. There will be important data such as the non - farm payrolls released on Thursday and Friday. Do not blindly chase the short - side.
The signals in the introduction have brought about continuous profits, and accurate signals are shared every day. Hurry up and click to get them!
👇 👇 👇 Obtain signals👉👉👉
GOLD drops sharply to $43, important support areaOANDA:XAUUSD encountered a sudden sell-off in early Asian trading on Thursday (May 1). The current price of gold is around $3,245/ounce, down sharply by $43 on the day and at a key technical position.
OANDA:XAUUSD fell for a third consecutive day as signs that trade talks between the United States and China may be progressing reduced demand for safe-haven assets, Bloomberg reported on Thursday. China Central Television said the United States has been in touch with China through various channels.
Bloomberg noted that concerns about the global trade outlook were also eased by news that the Trump administration was close to announcing the first of a series of deals that would reduce planned tariffs on several countries.
OANDA:XAUUSD have risen about 25% this year, largely as investors flocked to the safe-haven asset as U.S. President Donald Trump’s rapidly shifting trade policies have roiled markets and stoked fears of a global economic slowdown.
However, inflows into gold ETFs, central bank buying and strong speculative demand from China will also provide fundamental support for gold prices.
Looking ahead, Friday’s US non-farm payrolls report could reveal the initial impact of Trump’s trade policies on the economy.
Technical Outlook Analysis OANDA:XAUUSD
On the daily chart, gold is trading at a crucial support area for long-term bullish expectations with support from Ema21 converging with the 0.50% Fibonacci retracement. If gold is sold below $3,228, it could continue to decline further with a target of around $3,163 in the short term, the price point of the 0.618% Fibonacci retracement.
On the other hand, the Relative Strength Index (RSI) is also approaching the 50 level after a period of correction, which in this case acts as the nearest support.
It can be said that with the current position, gold has the most support with EMA21 converging with Fibonacci retracement 0.50% in terms of trend, and RSI approaching 50 is support in terms of momentum.
During the day, the current position still shows that gold has the potential to increase in price and the notable positions will also be listed as follows.
Support: 3,245 - 3,228 USD
Resistance: 3,267 - 3,292 USD
SELL XAUUSD PRICE 3295 - 3293⚡️
↠↠ Stop Loss 3299
→Take Profit 1 3287
↨
→Take Profit 2 3281
BUY XAUUSD PRICE 3195 - 3197⚡️
↠↠ Stop Loss 3191
→Take Profit 1 3203
↨
→Take Profit 2 3209

Gold is short, gold may plummet!As the current price is basically fluctuating within the large range of 3260-3370, the overall trend is fluctuating downward, the high point is constantly moving down, and the low point is tested many times. The more tests are made, the greater the probability of breaking. Therefore, the continuity of the rebound is not strong. In the morning, we stepped back to 3319 and bought more. In the afternoon, we rebounded to 3323 and left the market with a small profit and then went short. It basically maintained a weak consolidation at a low level. This trend means that there will be further declines.

Gold is looking bearish gold will downfall Hi dear trader according to my Anylysis market looks bearish gold is in sell trend Gold sell from my given entry point in chart

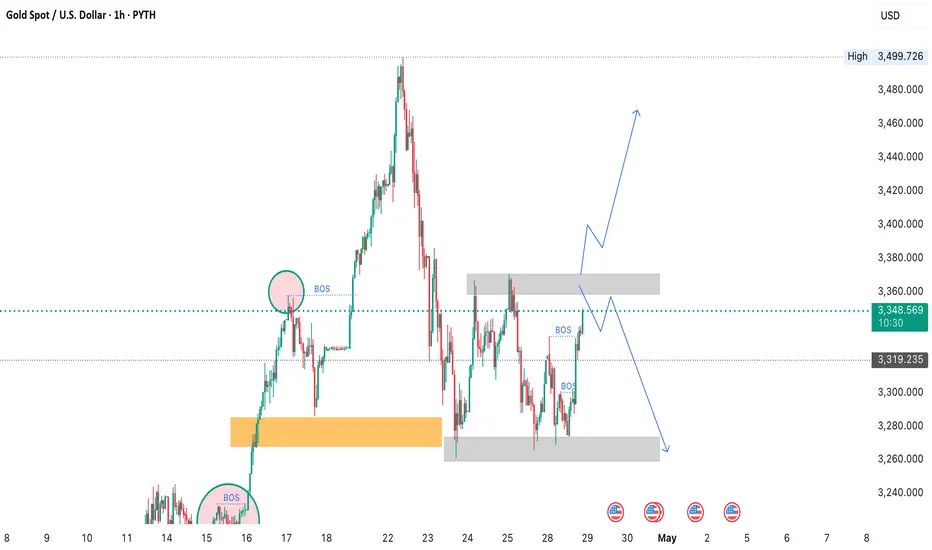
XAUUSD waiting for breakoutThis XAU/USD 1-hour chart shows a symmetrical triangle pattern forming, which typically signals a potential breakout as price compresses between converging trendlines
Potential Scenarios:
• Bullish Breakout:
If the price breaks above the upper trendline (~3345–3350 area) with strong volume and RSI follow-through, the next targets could be:
• Short-term: 3380–3400
• Medium-term: 3450 and possibly retest the recent high of 3500
• Bearish Breakdown:
A break below the lower trendline (~3280–3270 area) with RSI dropping below 40 could lead to:
• Short-term: 3240
• Medium-term: 3200 or even 3160

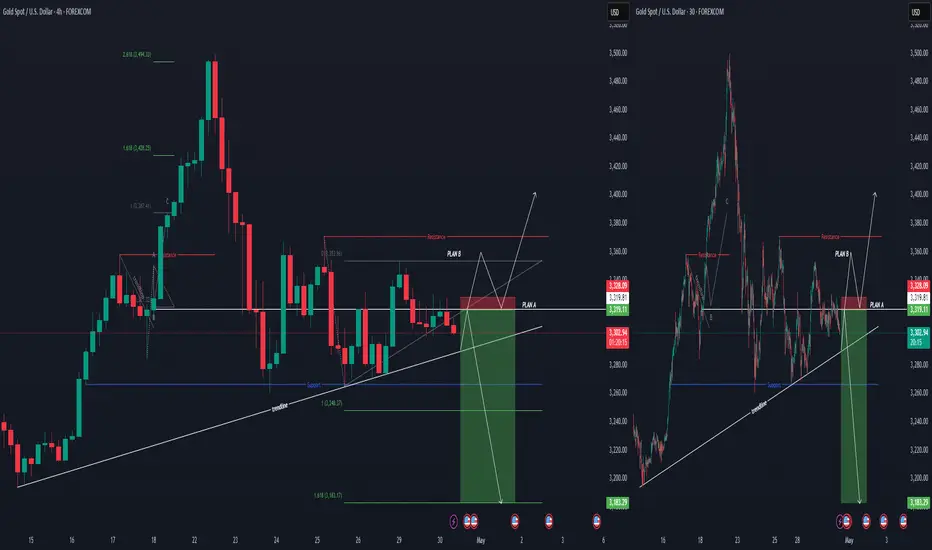
XAUUSD TRADE IDEA
Hi everyone,
here is my gold price movement forecast. My forecast tends to lean towards temporary strength for gold. Therefore, if there is a rejection at the trendline on the H4, I will wait for the price to come back to 3320 before shorting gold... If the price successfully breaks the entry price and makes a new high, I will look for opportunities to long towards 3402.
good luck all
**My trading strategy is not intended to be a signal. It's a process of learning about market structure and sharpening my trading my skills also for my trade journal**
Thanks a lot for your support
Gold still has a chance to reboundCurrently, gold's bulls and bears are still oscillating within a large range. The key pressure above and the upper edge of the range are maintained near 3365-70, while the lower edge of the large range and the support are maintained near 3260. It is very likely that there will be multiple shocks and choices within this range again.
Gold retreats to around 3302-00 during the day, go long, target around 3330-50, stop loss 3295.

Gold Intraday Trading Plan 5/1/2025Gold tested 3270 again yesterday and this support was still held strongly. There is a wedge line, indicating increasing pressure on the support. It will likely be broken soon. If so, I will sell towards 3240. However, if the wedge line is broken, I will buy towards 3370. Let's see how the market plays out today.

xau longnot many great trades past week, not trading large accs as 2 pending payout.
look at this, if 15m holds, will look to long it.
news looking good for xau today

No need to hesitate, gold continues to be bullish
I just told you that you can go long near 3298. Gold once retreated to around 3275 during the European session.
I think if you want to go long, there is definitely a chance, and I have been emphasizing this.
I am still in a stable state, and I only suggest going long near 3290 during the US session.
As of now, gold has reached around 3330, which has reached my two target positions.
Since gold can stand at 3330, it will definitely continue to rise in the future.
At present, gold is a W-shaped structure, and it will definitely hit the top near 3360 in the future.
So, my suggestion here is still to go long. But maybe gold will not be given a position below 3300.
Therefore, if there is a subsequent retracement of gold, you can focus on entering the market near 3300-3310 and go long. The final target is still around 3360.

XAUUSD_2HUpdate Gold
Wave ABC which is currently in wave B in a corrective triangle of five waves abcde
and could continue to fall for wave C to $3166
Main and important resistance 3360
Short resistance 3321

Gold: Bearish Shooting Star Reversal?The trend in gold is higher and no doubt it can go higher still.. BUT
There is a possible short setup
because:
A) It's very overbought relative to its weekly average
B) A Weekly shooting star reveral pattern took place on the weekly chart
C) The daily chart shows a possible breakdown
Thoughts?

The Golden Code: Unlocking the Markets with Fibonacci Sequence “Mathematics is the language in which God has written the universe.” – Galileo Galilei
If this is true, then the Fibonacci sequence is the poetry of that language, especially in trading.
📚 What is Fibonacci? Why Should Traders Care?
Fibonacci is more than just a sequence of numbers — it’s a universal law of growth and proportion. From galaxies to sunflowers, and now to the charts on your TradingView screen, Fibonacci is everywhere.
In trading, Fibonacci retracement levels are used to identify potential reversal zones, where price is likely to bounce or stall, making it one of the most powerful tools in a trader’s arsenal.
But few truly understand its depth, and fewer still use it intelligently.
Let’s dive into the power of the Fibonacci sequence, how it influences retracements, and how you can use it to your trading advantage, whether you’re a scalper, swing trader, or position trader.
🧠 The Fibonacci Sequence: Where It All Begins
The Fibonacci sequence is a series of numbers where each number is the sum of the two preceding ones:
0, 1, 1, 2, 3, 5, 8, 13, 21, 34, 55, 89, ...
Some Math somebody? Take your seats and calculators away! 😂😂
📉 Fibonacci Retracement Levels & How They're Calculated
These levels are percentages based on relationships between Fibonacci numbers.
✅ 0.236 (23.6%)
Divide a number by the one three places ahead:
Example: 13 ÷ 55 = 0.236
Another: 21 ÷ 89 = 0.236
✅ 0.382 (38.2%)
Divide a number by the one two places ahead:
Example: 21 ÷ 55 = 0.382
Another: 34 ÷ 89 = 0.382
✅ 0.500 (50.0%)
Not directly from Fibonacci, but commonly used due to psychological midpoint in markets.
✅ 0.618 (61.8%) – The Golden Ratio
Divide a number by the next number:
Example: 34 ÷ 55 = 0.618
Another: 55 ÷ 89 = 0.618
This is the famous Golden Ratio, which appears in nature, art, and financial markets.
✅ 0.786 (78.6%)
Derived from the square root of 0.618:
√0.618 = 0.786
📈 Fibonacci Extension Levels & How They're Calculated
Extensions project price targets beyond the retracement.
✅ 1.000 (100%)
A full projection of the original move.
✅ 1.272 (127.2%)
Square root of 1.618:
√1.618 = 1.272
✅ 1.618 (161.8%) – The Golden Extension
Divide a number by the previous one:
Example: 55 ÷ 34 = 1.618
Another: 89 ÷ 55 = 1.618
✅ 2.000 (200%)
A full double of the original move.
✅ 2.618 (261.8%)
1.618 + 1.000 = 2.618
This creates ratios that are found in nature, architecture, music, and, yes, price movements.
🔍 Fibonacci Retracement: Mapping Pullbacks with Precision
When price moves impulsively in one direction, it often retraces a portion of that move before continuing in the same direction.
Fibonacci retracement is used to map this pullback.
Here’s how traders use it:
Identify a clear impulsive move (either bullish or bearish).
Plot the Fibonacci retracement tool from swing low to swing high (for bullish moves), or from swing high to swing low (for bearish moves).
Watch how price reacts around key levels:
38.2% = Shallow pullback
50% = Midpoint (psychological)
61.8% = Golden Zone
78.6% = Deep retracement (but still valid)
🔥 Pro Tip: Most institutional traders love the 61.8% retracement, often placing hidden liquidity and traps around that area.
🔄 Fibonacci Extensions: Predicting Take-Profit Zones
Once price retraces and continues its trend, Fibonacci extensions help identify possible target zones:
Common extension levels:
1.272
1.618 → Golden Target
2.000
2.618
For example:
After a bullish retracement to 61.8%, price often rallies to 1.272 or 1.618 extensions, making these ideal profit-taking zones.
🔄 Real-Life Market Behavior: Fibonacci in Price Action
Let’s take a real example:
🟨 Example: XAU/USD Bearish Retracement
Impulsive rally from $2,832.99 to $2,930.77.
Price pulls back to $2,880 – exactly at the 50% Fibonacci retracement.
Followed by a strong continuation to the upside.
Price reach for the 127.20% and beyond to 161.80% Fibonacci extension of the original rally before pausing for some times — textbook Fibonacci behavior.
💡 This isn’t magic. It’s structure, order, and smart money playing on the same field.
🧬 Fibonacci + Confluence = Confirmation
Fibonacci works best when combined with other tools:
Support/Resistance
Order Blocks
Imbalances
Trendlines
Candlestick Patterns
✅ A 61.8% retracement + bullish order block + bullish engulfing = a high-probability long setup.
✅ A 78.6% retracement + unfilled imbalance = possible stop-hunt trap or liquidity grab.
🧠 Fibonacci Psychology: Why It Works
Fibonacci works because it reflects natural human behavior:
Fear and greed create overextensions and pullbacks.
Traders place stops and entries near these key ratios, causing self-fulfilling reactions.
Algorithms and institutional models often base trade entries on Fibonacci confluences.
💥 Common Mistakes Traders Make
❌ Using Fibonacci on every small swing – noise, not signal
❌ Forcing the retracement tool to “fit” your bias
❌ Ignoring higher time frame structure
❌ Using Fibonacci alone without confluence
Remember: Fibonacci is a guide, not a guarantee.
📈 How to Trade with Fibonacci (Step-by-Step)
First, identify market structure (trending or ranging).
Second, mark swing high and swing low.
Third, plot retracement tool accordingly.
Fourth, look for confluence zones:
38.2%, 50%, 61.8%...
Price action signals (e.g., pin bars, engulfing)
Institutional concepts (order blocks, imbalances)
Enter with confirmation, not just based on levels.
Set stop loss below/above structure or 78.6% line.
Target extension levels or previous high/low.
🌀 Fibonacci in Different Trading Styles
Scalpers
Use Fibonacci on 1min–5min timeframes to catch micro pullbacks and entries.
Swing Traders
Use Fib retracements from daily or 4H structure to plot entries and targets.
Position Traders
Use weekly/monthly Fibonacci zones for macro views and long-term targets.
🧠 Final Thoughts: Fibonacci Is Structure, Not Sorcery
The Fibonacci sequence is a map of order in a chaotic world. In trading, it helps bring discipline, clarity, and precision.
It’s not about being right every time, it’s about stacking probabilities in your favor.
🧭 Ready to Master Fibonacci?
If you’ve read this far, drop your thoughts in the comments and share your favorite Fibonacci setup!
Let’s build a community of traders who use mathematics and structure, not hope and guesswork.
Follow for more educational breakdowns, trading insights, and strategy walkthroughs — posted weekly.

GOLD Is Going Up! Long!
Take a look at our analysis for GOLD.
Time Frame: 2h
Current Trend: Bullish
Sentiment: Oversold (based on 7-period RSI)
Forecast: Bullish
The market is on a crucial zone of demand 3,278.91.
The oversold market condition in a combination with key structure gives us a relatively strong bullish signal with goal 3,328.53 level.
P.S
We determine oversold/overbought condition with RSI indicator.
When it drops below 30 - the market is considered to be oversold.
When it bounces above 70 - the market is considered to be overbought.
Disclosure: I am part of Trade Nation's Influencer program and receive a monthly fee for using their TradingView charts in my analysis.
Like and subscribe and comment my ideas if you enjoy them!

XAUUSD | Bearish Order Block Rejection in Premium | Short Setup🔥 XAUUSD – 5M Timeframe Smart Money Setup | April 30, 2025
Gold just printed the kind of setup Smart Money waits for: liquidity sweep + order block retest + Fibonacci confluence — all in the Premium Zone.
📍 Price Action Breakdown:
We marked a Clear Bearish Order Block after a strong move down.
Price retraced cleanly back into the 61.8%–79% Fibonacci Premium Zone — the exact area where Smart Money sells to retail buyers.
Price wicked into the OB, filled the imbalance, and showed strong bearish rejection.
Entry triggered on confirmation candle after tap.
🎯 Key Setup Elements:
✅ OB in Premium
✅ Bearish BOS before entry
✅ Fibonacci rejection (61.8–79%)
✅ Clean mitigation of the OB
✅ Low time frame confirmation entry
🧠 Smart Money Flow:
Retail: “Gold’s recovering! Time to buy!”
Smart Money: “Thanks for the liquidity. Here’s your SL.” 🫡💸
Every wick into that OB zone is a buy stop getting sniped by institutions.
💥 Trade Setup:
Entry: OB rejection zone at 3,328–3,332
SL: Above 3,332 (wick high / OB invalidation)
TP:
TP1: 3,314
TP2: 3,306
TP3: 3,299 (full RR completion)
Risk:Reward ~ 1:3+
📈 Risk Management Note:
Trailing SL advised once we reach TP1. Let price prove itself. Gold is volatile, but this structure is textbook.
🔮 What to Watch Next:
BOS below 3,320 confirms further bearish momentum.
Any re-entry into OB without momentum = trap.
🎤 Final Thoughts:
This is a play straight out of the institutional handbook — it’s not about chasing, it’s about letting price come to you.
Patience = Profit. 🧠💰
🗣️ Drop “GOLDEN SNIPER” in the comments if you caught this too.
💾 Save this chart — it's a lesson in precision.
👥 Tag your scalping squad — no excuses on this clean setup.

gold to 3270on chart buyside has been raided price proceeded south. currently price is failing to uphold on 15 min bullish fvg. i want to see price accelerate to smooth lows at 3270
