Gold (XAU/USD) – Bearish Head & Shoulders Pattern in PlayGold (XAU/USD) on 4hr timeframe chart is showing signs of a potential trend reversal after forming a classic Head & Shoulders pattern on the chart. The structure is well-defined, with both shoulders forming around the $3,360 zone and a prominent head at $3,435. The neckline support lies between $3,285–$3,295, which has now been broken multiple times, signaling possible continuation to the downside.
📉 Key Bearish Targets: TP1: $3,245
TP2: $3,190
TP3: $3,115
❌ Invalidation:
A strong close above $3,376, invalidate the setup.
#XAUUSD #Gold #HeadAndShoulders #TechnicalAnalysis #PriceAction #BearishSetup #ChartPatterns
GOLDCFD trade ideas

#XAUUSD:From Our Last Analysis 534+ Pips What Next?We published our analysis on gold on April 24th, highlighting the bullish market presence. The price indeed reversed from our zone, enabling us to make a significant move of over 234 pips. We anticipate a continuous price increase from our entry zone, potentially reaching 3500$. There are several reasons behind this belief. Firstly, the escalating war-like tension between India and Pakistan could lead to a surge in gold prices, potentially surpassing the previous high. Secondly, the heightened tensions among global investors are expected to result in an extreme bullish movement in gold prices.
Given the volatility of gold, we recommend trading cautiously and taking extra precautions while trading gold.
Wishing you good luck and safe trading!
Thank you for your support! 😊
If you’d like to contribute, here are a few ways you can help us:
- Like our ideas
- Comment on our ideas
- Share our ideas
Team Setupsfx_
❤️🚀

XAUUSD - Buy Looks like a Wyckoff to me 📈
A Wyckoff within a bigger Wyckoff 🔄
Did I mention Wyckoff? 😅
Anyway, listening to all the guff on YouTube about this tariff palaver, things don't look good-not at all. 😬
Shipping is reduced 🚢, ports are starting to feel it ⚓, and there's talk of layoffs, so there will be a knock-on effect-more job losses. 📉
I asked GPT what it thought about the whole thing and it said an estimated 1 million job losses. Not good. 😟
Latest: Trump's lies are coming home to roost 🐓-Amazon is displaying tariff-related product price increases separately. 😂
Also, Shein and others-what else can they do? It only makes logical sense for businesses to separate and display things like GST so Tariffs no different, it helps people see the true cost of the product. 🧾
Trump is calling it a political and hostile act 🎭
What, showing the truth? 😂
This is from a man who owns Truth Social. 🤦♂️
So, expecting gold to continue higher 🏆
Banks are in the accumulation phase-looks like they're heading for a breakout then probable retest of once was resistance now turned support zone, then entering the markup phase (head higher). 🏦💹
That would be the plan! 📝
Let’s see! 🙂

XAUUSD TRIANGLE PATTERN IN 15-MI Created This XAUUSD Chart Analysis In 15M Tf
Entry Point : SELL XAUUSD MADE TRIANGLE PATTERN
Resistance zone : 3315
Target Will Be : 3288
NOTE : THIS CHART IS BASED ON PERSONAL ANALYSIS FOR LEARNING PURPOSES. PLEASE USE PROPER RISK MANAGEMENT


New gold price range: 3170-3260New gold price range: 3170-3260
As shown in the figure:
The downward trend is obvious, and there is still room below
As the Asian market plummeted after the holiday, the US market was unable to pull up, and it continued to fall today, completely breaking through the range.
The new range is 3170-3260
Technical analysis:
1: As long as the gold price is below 3260, today's strategy only participates in short selling
2: Fully test the new support level of the 3160-3180 range and try to buy the bottom and go long
Today's data is worth paying attention to
I think the data of these two days is bearish on Thursday and bullish on Friday
According to this rhythm, gold is relatively in line with the current range fluctuations

XAUUSD Bearish - SELLMarket Overview
Asset: Gold (XAU/USD)
Timeframe: 1H
Current Trend: Downtrend
Market Context:
Fundamental Drivers: Gold faces downward pressure due to a strengthening US Dollar, driven by the Fed’s hawkish outlook on April 28, 2025, with no anticipated rate cuts in Q2 2025. Rising US 10-year Treasury yields (near 4.6%) are reducing demand for non-yielding assets like Gold.
Recent Price Action: Gold rallied to the $2,450–$2,460 zone but was rejected, forming a lower high after failing to break above the 50-period EMA, consistent with a broader downtrend from the March 2025 high ($2,500).
Sentiment: Bearish sentiment prevails, with risk-on markets (e.g., S&P 500 gains) diminishing Gold’s safe-haven appeal.

GOLD In these areas, there is a possibility of gold falling to 2957.253.
It may correct a little before that and then fall.

xau longnot many great trades past week, not trading large accs as 2 pending payout.
look at this, if 15m holds, will look to long it.
news looking good for xau today

Gold has little momentum to continue rising - continues to fall 🔔🔔🔔 Gold news:
➡️ Gold prices reverse course during Monday’s U.S. trading session, recovering strongly from an intraday low of $3,268.03 to hover around $3,330. In the absence of major macroeconomic data, investors remained focused on trade developments. Mixed headlines regarding U.S.-China trade negotiations stirred some concerns after a quiet start to the day, with cautious optimism leading earlier sessions in Asia and Europe, thereby putting pressure on demand for the U.S. Dollar.
➡️ However, gold struggled to maintain its overnight rebound and faced renewed selling pressure during Tuesday's Asian session. Signs of easing U.S.-China trade worries and optimism about potential trade deals from the U.S. continued to support a risk-on sentiment, weighing on the appeal of the safe-haven metal.
Personal opinion:
➡️ Positive information about tariff negotiations is appearing more and more, and the parties are also easing trade tensions. So the gold price decrease is still maintained or at least difficult to increase further, unless there is a strong enough announcement to push the gold price up
➡️ Analysis based on important resistance - support levels and Fibonacci combined with trend lines to come up with a suitable strategy
Plan:
🔆Price Zone Setup:
👉Sell Gold 3357 - 3360
❌SL: 3365 | ✅TP: 3352 - 3346 – 3340
👉Buy Gold 3270 - 3273
❌SL: 3265 | ✅TP: 3278 - 3283 – 3289
FM wishes you a successful trading day 💰💰💰

Gold (XAU/USD) – Bearish Pennant Breakdown SetupGold is forming a bearish pennant on the 4H chart, suggesting a potential continuation of the prior bearish leg. A confirmed break below the $3,275 support area may trigger further downside toward the key targets.
Fundamentally, gold faces pressure from a firmer USD and rising real yields, which could accelerate selling momentum.
Pattern: Bearish Pennant
Sell Entry: Below $3,275
Targets:
* Target 1 – $3,260
* Target 2 – $3,240
* Target 3 – $3,200
Bias: Bearish
Trade Status: Setup forming – trade inactive until confirmed breakdown
Disclaimer: This is not financial advice. Please conduct your own research and manage risk accordingly.
Support: If you found this helpful, like and follow for more trade ideas!

We are long overdue for a pullbackSince gold have pumped like no tomorrow, we are expecting a healthy fullback. One good tool to look for a turn, is the VWAP.
And, as you can se, we are long over due for a meeting.

Wide fluctuations, short at high levels and long at low levelsIn terms of news, we need to pay close attention to the conflict between Russia and Ukraine and the recent conflict between India and Pakistan. Initial jobless claims and PMI data will be released on Thursday, and the unemployment rate and non-farm data for April will be watched on Friday.
Technical side, from the 4-hour analysis, the upper side continues to focus on the short-term suppression of 3320-3330, and further focuses on the suppression of 3345-56. The intraday rebound relies on 3320-3330 to short and continue to fall. The lower support is 3300-3290, and the short-term long-short strength and weakness watershed is 3270-3260. Before the daily level loses this position, continue to see long-short fluctuations, and participate in high-altitude low-multiple cycles. Do not chase orders.
Intraday trading strategy
SELL 3320-3330
TP 3300-3290
BUY 3260-3270
TP 3300-3310
If you agree with this point of view, or you have a better idea, please leave a message in the comment area. I look forward to hearing different voices.
OANDA:XAUUSD FX:XAUUSD FXOPEN:XAUUSD FOREXCOM:XAUUSD TVC:GOLD

4/29 Gold Trading SignalsThe buy orders initiated around 3273 yesterday have already delivered solid profits.
After a slight rally at today’s opening, gold prices have pulled back.
Currently, the candlestick formation shows no clear directional trend, while some short-term technical indicators are pointing downward.
Before any corrective signals appear, we need to closely watch the support near 3306.
As long as this level holds, the short-term bullish momentum still has a chance to continue.
On the news side, today's scheduled data releases are of minor impact.
Focus instead on developments regarding the India-Pakistan situation and US Treasury Secretary Bessent’s press conference.
If geopolitical tensions escalate, gold may break out to new highs.
🔹 Today's Trading Strategy:
Sell within 3407-3428 zone
Buy within 3258-3223 zone
Flexibly trade between 3346-3313 / 3378-3336 / 3273-3316 zones
Please manage your positions carefully and stay alert for unexpected market moves.

PRICE DROPPED LOW! BEST TIME TO BUYPrice dropped low! A buy opportunity is envisaged from the current market price. First target is at the price level of 3320. This is a good opportunity to capitalise on gold
What is ICT FVG ? – ICT Fair Value Gap Explained Step by Step !ICT FVG knowns as Fair Value Gap, is a three-candle formation having an un-retraced area between the high and low of 1st and 3rd candlestick.
A fair value gap is indicated by an imbalance and it acts as a level of support and resistance in the price chart.
This blog post will teach you all about the ICT FVG from their formation to identification and their use in trading.
You can jump to the section you are most interested in from below or can continue reading the whole article for better understanding.
Table of Contents
What is ICT FVG (Fair Value Gap)?
How to Identify an ICT Fair Value Gap?
Types of ICT FVG
(I) Bullish Fair Value Gap
(II) Bearish Fair Value Gap
ICT FVG Trading Strategy
Best Time Frame for ICT FVG Identification
Best Pair for ICT FVG Trading
Final Thoughts
What is ICT FVG (Fair Value Gap)?
ICT fair value gap is a three-candle structure indicating a gap between the high and low of 1st and 3rd candlestick.
The gap between three candles is created because price does not retrace in that area and leaves it open.
You can see the example of ICT FVG in the picture below :
ICT FVG acts as a magnet for price and price retrace back to the fair value gap to balance the price delivery.
After retracing to the FVG price then reverses and continues its trend .
How to Identify an ICT Fair Value Gap ?
To identify an ICT FVG, you need to look for a large candlestick with most body range.
After identifying the large candlestick, mark the high of candlestick prior to the large candle and low of the subsequent candlestick .
There will be a visible gap between the high and low of the two candlesticks which indicate the ICT fair value gap .
Types of ICT FVG
On the basis of price move the ICT FVG has two types which are explained below :
(I) Bullish Fair Value Gap
A bullish fair value gap in ICT terms appears during an uptrend with a three-candle pattern.
It happens when the middle candle has a large body , leaving a gap between the high of the first candle and the low of the third candle .
In an uptrend , a fair value gap can serve as strong support, with the price often retracing to fill the gap before moving higher .
You can see the example of bullish fair value gap in the picture below :
(II) Bearish Fair Value Gap
A bearish fair value gap appears in a downtrend within a three-candle pattern.
It forms when the middle candle has a large body, creating a gap between the low of the first candle and the high of the third candle .
In bearish trend a fair value gap can act as a good resistance and mostly price tends to fill this gap before moving lower .
You can see the example of bearish fair value gap in the picture below .
ICT FVG Trading Strategy
To trade using an ICT fair value gap, you need to go through below steps.
Step 1 – Determine Market Trend: First of all we need to identify the market trend of any asset whether it is bullish or bearish.
You can use ICT Daily Bias to anticipate the direction of price move.
In bullish trend price makes higher highs and higher lows, while in bearish trend price makes lower lows and lower highs
Step 2 – Identify Premium and Discount Zone: You would be looking for the premium fair value gap in bearish trend, while in bullish trend you would be looking for discount FVG.
Step 3 – Identify Large Candle:Once you have determined the trend, next step is to find a large candle with large body & small wicks.
If market is in bullish trend, we look for strong bullish candle with most body range while in bearish trend we look for large bearish candle with most body range.
Step 4 – Study Preceding & Proceeding Candles: Once you have identified one large candle, now study the one candle before it & the one candle after it.
Both of these candles should have such a structure that their bodies should not overlap the body of middle candle thus confirming a fair value gap between the wicks of first & third candle.
Step 4 – Mark Fair Value Gap: In bullish trend the gap between the high of first candle and the low of third candle.
While in bearish trend the gap between the low of first candle and the high of third candle will be marked as your fair value gap.
Step 6 – Execute the Trade: If the price is in bullish trend, we will wait for price to retrace and test the discount fair value gap to balance the move.
When price tests the discount fair value gap you can execute a buy trade with other technical confirmations like rejection or structure shift in lower time frame.
In the picture given below you can see price is in bullish trend making higher highs and higher lows.
It retraces back to test the fair value gaps and rejects from the fair value gaps, eventually going higher.
In a bearish trend, you would wait for the price to retrace up and test the premium fair value gap to balance the bearish price delivery.
When the price visits this gap, it can offer sell opportunities, especially when combined with additional confirmations like rejection or a shift in market structure.
In the image below, the market is in a downtrend, forming lower highs and lower lows.
It repeatedly tests bearish fair value gaps and rejects from these levels, leading to further price declines.
Best Time Frame for ICT FVG Identification
ICT FVG can serve different purpose, like it can be used as a tool to find the Daily Bias using higher timeframe like 1-Day.
But if you are using the fair value gap as a PD Array to find trade entry then you would be looking for a fair value gap in lower timeframes like 15-Minutes or lower than that.
Best Pair for ICT FVG Trading
Initially the ICT introduced the fair value gap using the index trading like Nasdaq and S&P-500 and it yielded best results in that market.
After that he demonstrated some examples of forex pairs using the FVG and it was equally good for that market too.
So, now a days ICT FVG serve as a key tool for traders in every market.
Final Thoughts
While trading using a fair value gap we should keep in mind that every fair value gap in the market is not tradeable , to trade using fair value gap, we should use it in conjugation with other strategies like demand & supply or support & resistance . At these levels fair value gaps can act as a more reliable tool to take a trade.
You can also check this article how traders use fair value gap to open the right trade.
Plus to mitigate your risks, you should always trade with stop loss in place as no strategy is foolproof in trading.

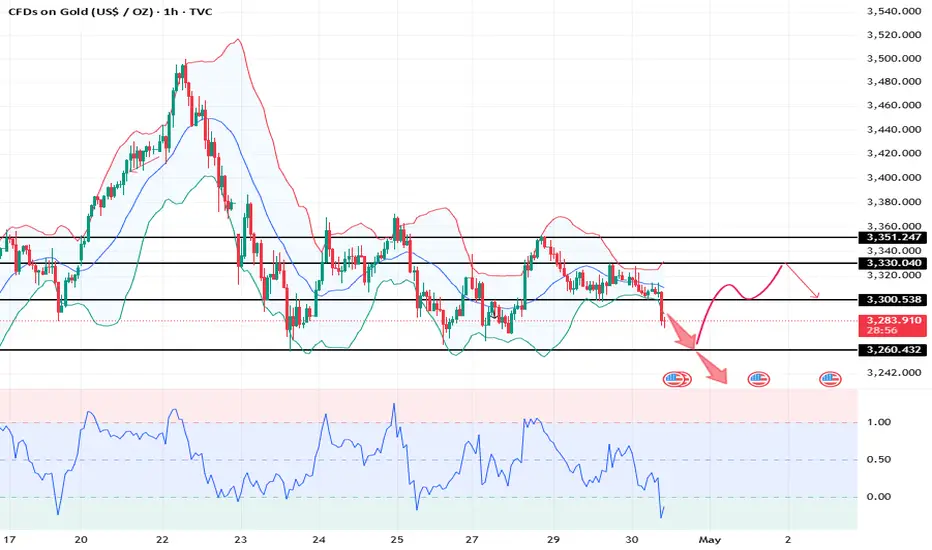
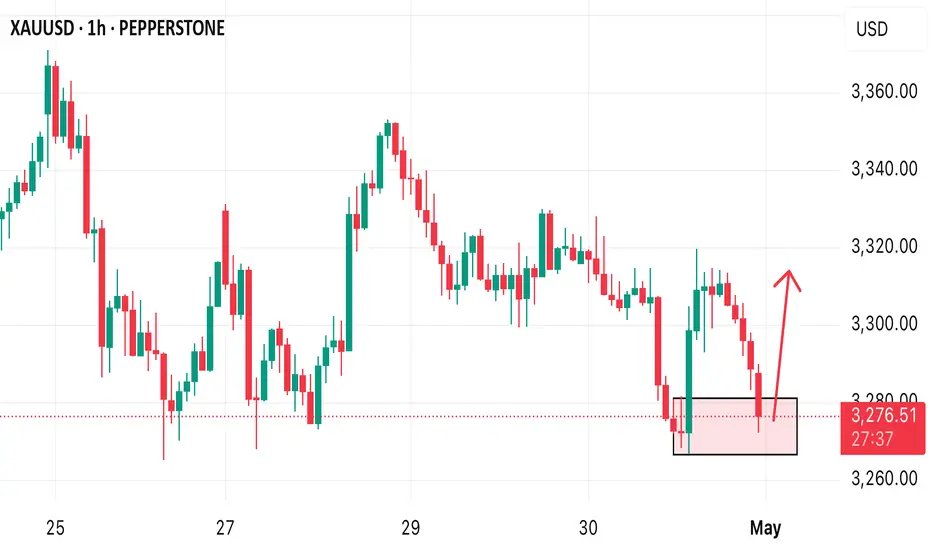
Potential Bullish Reversal in XAU/USDAn observable lateral range structure emerges on the gold (XAU/USD) 1-hour chart, with a clearly respected support zone. The proposed idea suggests a potential 'W' pattern forming at the lower part of the range, indicating accumulation. If confirmed by favorable price action, an upward move toward the upper range resistance is anticipated. This entry aims to capitalize on a technical rebound from support, targeting a prominent liquidity zone above.

GOLD RISKY LONG|
✅GOLD will soon retest a key support level of 3260$
So I think that the pair will make a rebound
And go up to retest the supply level above at 3323$
LONG🚀
✅Like and subscribe to never miss a new idea!✅
Disclosure: I am part of Trade Nation's Influencer program and receive a monthly fee for using their TradingView charts in my analysis.

Gold continues to chase gains
As gold broke below the 3300 mark in the European session, the market once again tested the 3270 first-line support, which is the edge of the lower track of the channel. It is expected that the market will continue to fluctuate widely.
Therefore, in terms of operation, it is recommended to go long on gold at 3270-3272, with a stop loss of 3267 and a target of 3330-3360.
If you have any better suggestions, please leave me a message below, thank you

#BEARISH MOVE EXPECTEDIn this analysis we're focusing on 1H time frame for gold. In this analyze we are using downward trendline along with the combination of price action. When price enter in our supply area, so our first step is to observe how price will react and if price give any bearish confirmation then we'll execute our trade. Confirmation is very important.
Always use stoploss for your trade.
Always use proper money management and proper R:R ratio.
This is my analysis not a financial advice.
#XAUUSD 1H Technical Analysis Expected Move.

Again Sell at 3305As Market is moving still in Falling wedge from 3330-3270
Key area 3305-3307
What possible scenario we have?
Bearish scanario:
- market Is in falling wedge channel
-if market give closing below 3305 (body of candle)then ready for the next Drop towards 3280 then 3250
Bullish Scenario:
- 3305 multiple rejection support resistance cluster
-if candles remains above 3305-3308 then buy owards 3330 then 3380 target
Overall im on bearish on THIS chart

The Golden Code: Unlocking the Markets with Fibonacci Sequence “Mathematics is the language in which God has written the universe.” – Galileo Galilei
If this is true, then the Fibonacci sequence is the poetry of that language, especially in trading.
📚 What is Fibonacci? Why Should Traders Care?
Fibonacci is more than just a sequence of numbers — it’s a universal law of growth and proportion. From galaxies to sunflowers, and now to the charts on your TradingView screen, Fibonacci is everywhere.
In trading, Fibonacci retracement levels are used to identify potential reversal zones, where price is likely to bounce or stall, making it one of the most powerful tools in a trader’s arsenal.
But few truly understand its depth, and fewer still use it intelligently.
Let’s dive into the power of the Fibonacci sequence, how it influences retracements, and how you can use it to your trading advantage, whether you’re a scalper, swing trader, or position trader.
🧠 The Fibonacci Sequence: Where It All Begins
The Fibonacci sequence is a series of numbers where each number is the sum of the two preceding ones:
0, 1, 1, 2, 3, 5, 8, 13, 21, 34, 55, 89, ...
Some Math somebody? Take your seats and calculators away! 😂😂
📉 Fibonacci Retracement Levels & How They're Calculated
These levels are percentages based on relationships between Fibonacci numbers.
✅ 0.236 (23.6%)
Divide a number by the one three places ahead:
Example: 13 ÷ 55 = 0.236
Another: 21 ÷ 89 = 0.236
✅ 0.382 (38.2%)
Divide a number by the one two places ahead:
Example: 21 ÷ 55 = 0.382
Another: 34 ÷ 89 = 0.382
✅ 0.500 (50.0%)
Not directly from Fibonacci, but commonly used due to psychological midpoint in markets.
✅ 0.618 (61.8%) – The Golden Ratio
Divide a number by the next number:
Example: 34 ÷ 55 = 0.618
Another: 55 ÷ 89 = 0.618
This is the famous Golden Ratio, which appears in nature, art, and financial markets.
✅ 0.786 (78.6%)
Derived from the square root of 0.618:
√0.618 = 0.786
📈 Fibonacci Extension Levels & How They're Calculated
Extensions project price targets beyond the retracement.
✅ 1.000 (100%)
A full projection of the original move.
✅ 1.272 (127.2%)
Square root of 1.618:
√1.618 = 1.272
✅ 1.618 (161.8%) – The Golden Extension
Divide a number by the previous one:
Example: 55 ÷ 34 = 1.618
Another: 89 ÷ 55 = 1.618
✅ 2.000 (200%)
A full double of the original move.
✅ 2.618 (261.8%)
1.618 + 1.000 = 2.618
This creates ratios that are found in nature, architecture, music, and, yes, price movements.
🔍 Fibonacci Retracement: Mapping Pullbacks with Precision
When price moves impulsively in one direction, it often retraces a portion of that move before continuing in the same direction.
Fibonacci retracement is used to map this pullback.
Here’s how traders use it:
Identify a clear impulsive move (either bullish or bearish).
Plot the Fibonacci retracement tool from swing low to swing high (for bullish moves), or from swing high to swing low (for bearish moves).
Watch how price reacts around key levels:
38.2% = Shallow pullback
50% = Midpoint (psychological)
61.8% = Golden Zone
78.6% = Deep retracement (but still valid)
🔥 Pro Tip: Most institutional traders love the 61.8% retracement, often placing hidden liquidity and traps around that area.
🔄 Fibonacci Extensions: Predicting Take-Profit Zones
Once price retraces and continues its trend, Fibonacci extensions help identify possible target zones:
Common extension levels:
1.272
1.618 → Golden Target
2.000
2.618
For example:
After a bullish retracement to 61.8%, price often rallies to 1.272 or 1.618 extensions, making these ideal profit-taking zones.
🔄 Real-Life Market Behavior: Fibonacci in Price Action
Let’s take a real example:
🟨 Example: XAU/USD Bearish Retracement
Impulsive rally from $2,832.99 to $2,930.77.
Price pulls back to $2,880 – exactly at the 50% Fibonacci retracement.
Followed by a strong continuation to the upside.
Price reach for the 127.20% and beyond to 161.80% Fibonacci extension of the original rally before pausing for some times — textbook Fibonacci behavior.
💡 This isn’t magic. It’s structure, order, and smart money playing on the same field.
🧬 Fibonacci + Confluence = Confirmation
Fibonacci works best when combined with other tools:
Support/Resistance
Order Blocks
Imbalances
Trendlines
Candlestick Patterns
✅ A 61.8% retracement + bullish order block + bullish engulfing = a high-probability long setup.
✅ A 78.6% retracement + unfilled imbalance = possible stop-hunt trap or liquidity grab.
🧠 Fibonacci Psychology: Why It Works
Fibonacci works because it reflects natural human behavior:
Fear and greed create overextensions and pullbacks.
Traders place stops and entries near these key ratios, causing self-fulfilling reactions.
Algorithms and institutional models often base trade entries on Fibonacci confluences.
💥 Common Mistakes Traders Make
❌ Using Fibonacci on every small swing – noise, not signal
❌ Forcing the retracement tool to “fit” your bias
❌ Ignoring higher time frame structure
❌ Using Fibonacci alone without confluence
Remember: Fibonacci is a guide, not a guarantee.
📈 How to Trade with Fibonacci (Step-by-Step)
First, identify market structure (trending or ranging).
Second, mark swing high and swing low.
Third, plot retracement tool accordingly.
Fourth, look for confluence zones:
38.2%, 50%, 61.8%...
Price action signals (e.g., pin bars, engulfing)
Institutional concepts (order blocks, imbalances)
Enter with confirmation, not just based on levels.
Set stop loss below/above structure or 78.6% line.
Target extension levels or previous high/low.
🌀 Fibonacci in Different Trading Styles
Scalpers
Use Fibonacci on 1min–5min timeframes to catch micro pullbacks and entries.
Swing Traders
Use Fib retracements from daily or 4H structure to plot entries and targets.
Position Traders
Use weekly/monthly Fibonacci zones for macro views and long-term targets.
🧠 Final Thoughts: Fibonacci Is Structure, Not Sorcery
The Fibonacci sequence is a map of order in a chaotic world. In trading, it helps bring discipline, clarity, and precision.
It’s not about being right every time, it’s about stacking probabilities in your favor.
🧭 Ready to Master Fibonacci?
If you’ve read this far, drop your thoughts in the comments and share your favorite Fibonacci setup!
Let’s build a community of traders who use mathematics and structure, not hope and guesswork.
Follow for more educational breakdowns, trading insights, and strategy walkthroughs — posted weekly.

XAUUSD: 30/4 Today’s Market Analysis and StrategyGold technical analysis
The resistance level of the four-hour chart is 3330, and the support level is 3260.
The resistance level of the one-hour chart is 3307, and the support level is 3275.
The resistance level of the 30-minute chart is 3300, and the support level is 3280.
The 4H cycle is a horizontal box operation. This week is a data week. The gold price is greatly affected by the news. Wait for the NFP data on Friday to break the box operation. Due to the recent market fluctuations, the entry position is very critical. For the time being, focus on the previous support of 3300 today. If the US market stands at 3300, it can be bullish to the 3320~3330 area. On the contrary, if it falls below the 4H and daily support of 3260 US dollars, it may touch the monthly support level of 3230~3200.
There are many news about the US market data today. Wait for the data to be released before trading! Avoid losses caused by increased liquidity during the news release.
Trading strategy:
Buy: 3265 SL:3260
Buy: 3300 SL:3295
Sell: 3330 SL:3335
Sell: 3260 SL:3265
Only provide trading direction, specific entry price, SL/TP need to wait for real-time liquidity confirmation