Gold Trade Plan 5/5/2025Dear Traders,
If we take a look at the gold chart, it is currently in a descending channel, and the price is trying to reach the top of that channel. Given these conditions, I believe the price will reach the target zone around 3285–3290 by midweek. If we observe a rejection at that level, we can enter a sell position, with the first target being the midline of the channel and the final target being the bottom of the channel. If the descending channel is strongly broken and the price stabilizes above it, a new update will be necessary.
Trend-base Fibo Extension AB=CD 3290
Fibo Retracement(1.618)= 3298
Top Of Descending Channel : 3290-3300
So we Are looking for Reversal 3290-3300 Area !
If you enjoyed this forecast, please show your support with a like and comment. Your feedback is what drives me to keep creating valuable content."
Regards,
Alireza
GOLDCFD trade ideas

GOLD - The Timeless Standard Bitcoin Can Only Dream Of ✨💰
1/ Bitcoin’s Aspirations vs. Gold’s Reality
Bitcoin proclaims to be “digital gold” , promising decentralization and stability. But the truth is clear: while Bitcoin is shaken by extreme wealth concentration and constant media hype, gold has built a centuries-long reputation for trust and enduring value. 🔥🏆
2/ The Digital Gold Revolution
Gold isn’t a relic—it's evolved! 🚀 Today, through blockchain tokenization, you can own digital gold that’s 100% backed by physical gold safely stored in vaults. 🏦🔐 This fusion of ancient value and modern tech shows that gold means business, while Bitcoin just tries to copy its legacy.
3/ Concentration vs. Distribution
Check this out: over 90% of Bitcoin is hoarded by a few whales 🐋, leaving everyday holders with crumbs. In contrast, gold’s market has naturally spread out over centuries of global trade. 🌍📈 This organic distribution reinforces stability and genuine market confidence.
4/ Liquidity, Custody & Security
🔹 Gold Is Easy to Custody
Gold is already stored securely in banks and reputable vaults all over the world, and its ownership transfers digitally. You can withdraw or trade anytime without relying on untrustworthy crypto exchanges or wallets vulnerable to hacks . 🔓💼 Meanwhile, Bitcoin’s security is often subject to risks and platform issues.
5/ Real-World Utility vs. Speculative Hype
Gold isn’t just an asset—it’s a workhorse! ⚙️ From use in electronics to medicine and aerospace, gold’s real-world applications generate organic demand. No aggressive, 24/7 hype machine is needed here. In contrast, Bitcoin runs on media-fueled life support, with bots and influencers relentlessly (and tediously) pushing its narrative . 😴📢
6/ Stability You Can Count On
Gold has weathered economic storms with calm resilience 🌪️➡️☀️, proving itself as the ultimate safe haven. Bitcoin, however, is notorious for its wild 80%+ price crashes, making it a volatile bet for long-term wealth preservation. 🏛️💚
7/ Finite Supply: Strength or Vulnerability?
Bitcoin’s fixed supply is often touted as a key advantage. Yet this scarcity makes it vulnerable to manipulation by a few major holders. 😬 Gold, on the other hand, sees a natural and gradual expansion through mining, ensuring a balanced, organic market flow. ⚖️🌿
8/ Institutional Adoption: Not the Magic Fix
State and corporate Bitcoin deals are usually quiet, behind-the-scenes OTC transactions that rarely impact open market prices. 🤫 Gold’s widespread institutional acceptance is built on centuries of trust and real-world use—no constant screaming into the void required. 📣🚫
9/ Gold: No Need for Hype, Just Legacy
Gold stands proudly without the constant need for promotion. 🌟 Its legacy of stability, digital adaptability, and secure custody speaks volumes. Bitcoin, burdened by relentless crypto spam and hype, can only watch from the sidelines. 🎭🗣️
10/ Invest in Timeless Security
When it comes to long-term wealth preservation, gold is your steadfast asset. It offers proven security, with both digital tokenization and secure physical storage, ensuring smooth withdrawals and trades every step of the way. 🏦🔐 Bitcoin, by contrast, survives on a steady diet of media noise and desperate promotions. 🚑🤖
Gold remains the reliable, time-tested choice in today’s fast-paced world of trends and fleeting hype. Whether you’re safeguarding your wealth or seeking an asset that seamlessly bridges digital innovation with physical security, gold’s enduring legacy is the real deal. 🌟💎
If you’d like to explore how tokenized gold is revolutionizing traditional finance or uncover more about its industrial applications and secure custody mechanisms, there’s always another layer of brilliance waiting to be discovered. 🚀🔍
TVC:GOLD TVC:SILVER INDEX:BTCUSD NASDAQ:MSTR NASDAQ:MARA NASDAQ:COIN CRYPTO:BTCUSD CRYPTOCAP:BTC.D

#XAUUSD SELL CHART This chart shows a short trade setup for gold (CFDs on Gold, US$/OZ) on the 45-minute timeframe. Here's a breakdown of what it suggests:
Entry Zone: Around the 3,314–3,315 level.
Stop Loss: Above 3,355, indicating the trade gets invalidated if the price breaks above this resistance zone.
Target Point: Near 3,234, aligning with a previous support area.
Risk/Reward Ratio: Looks favorable, with a larger potential reward (green zone) than the risk (red zone).
The yellow arrow suggests expected downward movement after hitting resistance.
Do you want help analyzing whether this setup aligns with current market fundamentals or technical indicators?

XAUUSD Bullish or bearish Detailed AnalysisXAUUSD is currently trading around 3380, continuing its bullish momentum as previously anticipated. The price action has followed the projected path, delivering substantial profits for those positioned early. The next key resistance level is at 3450, aligning with the upper boundary of the ascending channel.
Fundamentally, gold's rally is supported by heightened safe-haven demand amid ongoing geopolitical tensions and a weakening U.S. dollar. Investors are closely watching the upcoming Federal Reserve meeting, with expectations leaning toward a dovish stance, which could further bolster gold prices .
Technical indicators suggest that the bullish trend remains intact, with the price maintaining its position above key moving averages. However, traders should be cautious of potential pullbacks as the market approaches overbought conditions.
In summary, XAUUSD is on track toward the 3450 target, supported by both technical and fundamental factors. Traders should monitor key resistance levels and macroeconomic developments to manage their positions effectively.

Gold trend analysis: Don't chase the rise in the US marketThe 1-hour moving average of gold begins to turn, so the unilateral decline of gold has temporarily come to an end. However, the rise of gold has reached the key resistance area in the early stage, which is the starting point of the early stage near 3330. It is obviously not appropriate to chase long at this position, so the short-term may begin to adjust. Gold will go short near 3300 in the US market. The market changes rapidly. If gold breaks upward and does not fall back, there will be no opportunity to go long. There is no need to chase gold. Go short first and wait for the decline and adjustment.
Gold strategy: It is recommended to go short at 3325-28, stop loss at 3337, and target at 3308-3295-3280;

XAUUSD Daily AnalysisGold long-term trend is still bullish. based on ICHIMOKU the Xauusd is in supposed correction. daily support level (3228) was touched. the price is near important support level (3188).
For next weeks:
Support levels:
3188
3166
Resistance levels:
3351
3381
After that waiting for Ichimoku to give us the exact road map.

Gold Spot (XAU/USD) – Bullish Double Bottom BreakoutHello guys!
Yesterday we got our profit from gold!
It is a new one:
Gold has formed a clear double bottom on the 1H timeframe, accompanied by a bullish divergence—a classic signal of potential reversal. Following the breakout above neckline resistance, the price is currently in a retest phase, revisiting the breakout zone (now turned support).
🔹 Pattern: Double Bottom
🔹 Signal: Bullish Divergence
🔹 Breakout: Confirmed
🔹 Support Zone: ~$3,300–$3,305
🔹 Target: ~$3,375–$3,385
The bullish scenario remains valid as long as the price holds above the support area. A failure to hold may invalidate the setup and lead to further consolidation or decline.
📌 Watch for bullish price action near the retest zone for potential entries.

Gold (XAU/USD) Analysis – Technical + Fundamental OutlookTechnical Outlook
Gold is currently trading inside a descending channel and has reached the midline, which is acting as dynamic resistance.
📍 Key Levels:
Resistance: 3310 – 3320 (aligned with the midline of the channel) – price has not yet confirmed a breakout above this zone
Next Bullish Targets: 3350 – 3358 / 3385 – 3390
Support Zone: 3270 – 3280 (potential bullish re-entry area)
🟣 All key price levels are marked on the chart with light purple lines for clarity.
🟠 RSI is near 65, showing bullish momentum but approaching overbought territory, signaling a possible short-term pullback.
🔁 Likely scenario: A minor correction toward 3270–3280 followed by continuation toward 3350+ if support holds.
Fundamental Context
The ISM Services PMI came in stronger than expected (51.6 vs. 50.2 forecast), reflecting economic resilience in the U.S. This typically supports the USD and weighs on gold, but:
Rising tariff threats from Trump raise recession concerns.
Services Prices Index rose to 65.1, signaling growing inflation pressures.
These inflation concerns may impact the Fed’s upcoming rate decisions.
Central bank demand and geopolitical risks continue to support gold medium-term.
Summary
Despite being inside a descending channel, gold is showing short-term bullish strength. A confirmed break above 3320 could open the way toward 3350+. Otherwise, a pullback to the 3270–3280 area may offer the next setup.

#GOLD Buy 3222 - 3211#GOLD Buy 3222 - 3211
Stoploss 3189
Breakeven 3222.5
TakeProfit 1: 3224
TakeProfit 2: 3232
TakeProfit 3 :3246
TakeProfit 4: 3258
TakeProfit 5: 3270
Trade at your own risk
Protect your capital
The Wizard 🧙♂️ FDT
Thu May 01 25' 08 AM EST

Hellena | GOLD (4H): SHORT to 38.2%-50% Fibo lvl 3228.Colleagues, last week we got a stoploss, but I still believe that we should expect a correction in wave “2”. We will try to catch this movement this week.
I believe that the price will correct to the area of Fibonacci 38.2% - 50% levels (3228.41).
Perhaps the price will slightly renew the maximum of wave “1”, reaching the level of 3438. In this case I recommend to work with pending limit sell orders.
And some data:
The prevalence of bulls according to CME reports additionally increased by 13%.
The 23% increase in market volume, meanwhile, indicates a likely strong momentum pattern during the trading week.
Despite the 13% increase in buyers, selling patterns towards the balance level of the week (3200.00) are recommended for the current trading week.
Manage your capital correctly and competently! Only enter trades based on reliable patterns!

Bulls slow down the highs and don’t chase the bullsGold operation strategy:
1. When gold rebounds, go short at 3336-45, stop loss at 3353, target at 3280-3295, continue to hold if it breaks;
2. When gold falls back to 3280-3295, go long, stop loss at 3274, target at 3325-30, continue to hold if it breaks;

Your ULTIMATE Guide For Time Frames in Gold, Forex Trading
If you just started trading, you are probably wondering what time frames to trade. In the today's post, I will reveal the difference between mainstream time frames like daily, 4h, 1h, 15m.
Firstly, you should know that the selection of a time frame primarily depends on your goals in trading. If you are interested in swing trading strategies, of course, you should concentrate on higher time frames analysis while for scalping the main focus should be on lower time frames.
Daily time frame shows a bigger picture.
It can be applied for the analysis of a price action for the last weeks, months, and even years.
It reveals the historical key levels that can be relevant for swing traders, day traders and scalpers.
The patterns that are formed on a daily time frame may predict long-term movements.
In the picture above, you can see how the daily time frame can show the price action for the last years, months and weeks.
In contrast, hourly time frame reflects intra week & intraday perspectives.
The patterns and key levels that are spotted there, will be important for day traders and scalpers.
The setups that are spotted on an hourly time frame, will be useful for predicting the intraday moves and occasionally the moves within a trading week.
Take a look at the 2 charts above, the hourly time frame perfectly shows the market moves within a week and within a single day.
4H time frame is somewhere in between. For both swing trader and day trader, it may provide some useful confirmations.
4H t.f shows intra week and week to week perspectives.
Above, you can see how nicely 4H time frame shows the price action on EURUSD within a week and for the last several weeks.
15 minutes time frame is a scalping time frame.
The setups and levels that are spotted there can be used to predict the market moves within hours or within a trading session.
Check the charts above: 15 minutes time frame shows both the price action within a London session and the price action for the last couple of hours.
It is also critical to mention, that lower is the time frame, lower is the accuracy of the patterns and lower is the strength of key levels that are identified there. It makes higher time frame analysis more simple and reliable.
The thing is that higher is the time frame, more important it is for the market participants.
While lower time frames can help to predict short term moves, higher time frames are aimed for predicting long-term trends.
❤️Please, support my work with like, thank you!❤️
I am part of Trade Nation's Influencer program and receive a monthly fee for using their TradingView charts in my analysis.

Gold – False Break Signals More DownsideIn my commentary yesterday, I highlighted the importance of the 3360 support zone. While Gold initially found a bid around this level, the sharp reversal from the 3415 Asian session high suggests a failed breakout.
Key Observations:
• The quick rejection above 3360 now looks like a false break, reinforcing the bearish outlook.
• The recent high around 3415 appears to be a lower high following the 3500 ATH, confirming potential trend weakness.
• Given this structure, a drop back to at least the 3270 support zone seems highly probable.
Disclosure: I am part of Trade Nation's Influencer program and receive a monthly fee for using their TradingView charts in my analyses and educational articles.

Gold is expected to fall below 3300, continue to short gold!Fundamentals:
1. Pay attention to whether the geopolitical conflicts escalate, including the situation between India and Pakistan, Russia and Ukraine, and the situation between the United States and Iran, etc.
Technical aspects:
Although the gold price gradually rebounded after hitting 3320 points, the current rebound momentum is relatively weak. The gold price has turned from strong to weak, and the short-term "M"-shaped top structure formed by 3435 points and 3414 points above has suppressed the upward space of the gold price. Therefore, we still focus on shorting gold after the rebound. First, we focus on the resistance area of 3355-3365 points above. If the gold price rebound fails to successfully break through this area, the gold price will fall again and is expected to continue to fall to around 3280 points.
Trading strategy:
Consider shorting gold after gold rebounds to the 3355-3365 area, target price: 3340

BUY GOLD TO 3,308...Gold price made a strong rejections off the VAL on the volume profile chart now price is heading for the POC level at 3,308 and VAH at 3,363 which is a take profits level am selling from there down to 3,160
JOIN AND ENJOY

Gold Eiffel Tower The GOLD GTFO is still in play.
What saved Gold was the stopping for the market crash when Trumnpchenko manipulated the markets. Had the crash continued Gold would have crashed with it. As it is the last safe haven for money to pile into and people just give up and sell everything in sight.
If you were an early buyer of gold and sold above $3,000 then you have a nice 50% gain.
Take your money and RUN! All the way to the bank! Don't be a dick for a tick. If you are then you will ride it all the way back down.
When will it top no one can know. But what pros do is take their money and RUN! So be a pro! ;)
Click like follow subscribe!

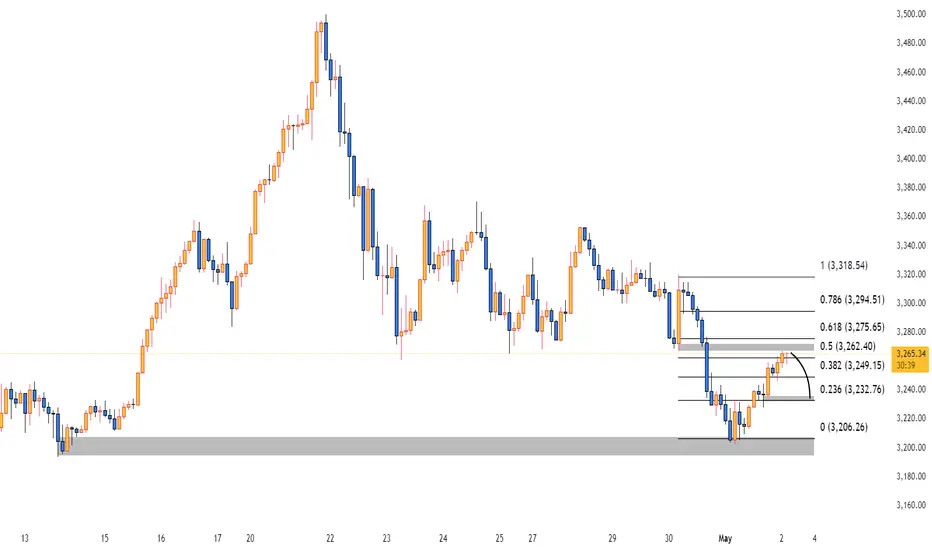
XAUUSD Analysis🟡 XAUUSD Analysis – May 2, 2025
Chart Overview:
Price is reacting near the 0.5–0.618 Fibonacci retracement zone (~3262–3275), a key supply area.
A bearish rejection candle is forming at 3264.51, showing resistance.
The projection curve on the chart suggests a potential pullback to the 0.236 (3232.76) or even 0 (3206.26) level.
🧠 Fundamental Catalyst (Today’s NFP):
If the NFP comes out weak (138K or lower) as expected:
USD may weaken → gold could break above 3275 and aim for 3294 or higher.
If NFP beats expectations significantly (e.g., above 200K):
Strong USD → This bearish setup could play out → Gold may drop toward 3232 or 3206.
📉 Signal (Short-term idea):
Bias: Bearish below 3275
Entry: Sell near 3265–3275 (supply zone)
TP1: 3232
TP2: 3206
GOLD/USD showing short-term corrections during the downtrendPrice Action Overview
Current Price: $3,389.030
Change: -47.536 (-1.38%) at the time of the snapshot.
Recent High: Around $3,453
Support Levels:
$3,370.793
$3,236.478
$3,201.685
Resistance Levels:
$3,393.756
$3,453.443
Technical Indicators & Patterns
Price Zones:
A red shaded area near the top indicating a strong resistance zone.
Multiple green shaded boxes below suggesting prior demand zones (support).
Trade Markers:
"B" = Buy signals (e.g., on May 3–4, where a rally followed)
"R" = Resistance/reversal points
"T" = Possibly a target or technical level
Volume Spikes:
Notable spike on April 23 (2.619M) and another smaller one around April 30 (568.623K).
Price Movements:
Recent Rally: A sharp upward movement from early May, rising from support near $3,200 to resistance at ~$3,450.
Corrections: Several pullbacks marked (-0.80%, -0.95%, etc.), showing short-term corrections during the downtrend and consolidation phases.
Percentage Gains/Losses:
Ranges from minor gains (0.67% to 1.19%) to losses (e.g., -0.95%) across various candles, highlighting short-term trading opportunities.

XAUUSD Still in Major Bullish Trend with Potential CorrectionOANDA:XAUUSD remains in a major bullish trend. Minor trend indicates potential correction before continuing upward. Correction target is the 200 EMA to fill the gap. Stochastic has already flipped downward, showing confluence with divergence.

GOLD Price Analysis: Key Insights for Next Week Trading DecisionGold ended last week under pressure as investors booked profits following improved risk appetite, driven by easing trade tensions and a strong U.S. labor market report.
📰 NFP came in at +177K in April, with the unemployment rate steady at 4.2%, matching forecasts—possibly keeping the Fed cautious on policy easing.
Technically, Gold remains bullish but is now testing the $3,200 support zone, and sellers are gaining momentum.
As we head into next week, gold price action is at a critical decision point, and whether buyers or sellers will take control is unclear.
In this video, I break down the key technical zones, share my trading plan, and discuss potential opportunities to help navigate the uncertainty ahead.
Disclaimer:
This is my take based on experience and what I see on the charts. It’s not financial advice—always do your research and consult a licensed advisor before trading.
#GoldAnalysis #XAUUSD #GoldPrice #ForexTrading #TechnicalAnalysis #FundamentalAnalysis #GoldOutlook #FedRateDecision #NFP #GoldBreakdown #GoldBulls #GoldBears #USJobsReport #ForexMentor

GOLD (XAUUSD): Your Plan to Buy
The recent fundamentals pumped Gold prices again.
The market is currently trading above a significant
daily resistance.
To confirm a validity of a breakout and to avoid a trap,
I suggest paying close attention to a minor horizontal
range on a 4H time frame.
Your signal to buy will be a 4H candle close above 3388.
It will confirm a breakout and increase the chances that the price will go up.
Goal will be 3435
❤️Please, support my work with like, thank you!❤️
I am part of Trade Nation's Influencer program and receive a monthly fee for using their TradingView charts in my analysis.

Hanzo : Gold15m : Reversal Zone / Next Move is Confirmed🆚 Gold – Hanzo’s Strike Setup
🔥 Timeframe: 15-Minute (15M)
——————
💯 Main Focus: Bearish After Retest at 3354
We are watching this zone closely.
———
👌 Market Signs (15M TF):
• Liquidity Grab + CHoCH at 3350
• Liquidity Grab + CHoCH at 3400
• Strong Rejections seen at:
➗ 3325 – Major support / Key level x5 Retest
➗ 3360 – Proven resistance

#XAUUSD: Gold to continue rising,$4000 by end of the year targetGold has unexpectedly declined to 3335 in response to the anticipated price increase following the unfolding conflict in Asia. Currently, two regions exhibit price reversals.
The XAUUSD price is progressing in accordance with our previous analysis. Both analyses have successfully reached the take-profit target, and we anticipate further bullish momentum in the near future. However, price movement is subject to potential reversals in two areas. Both targets are long-term oriented, indicating potential swing moves that may take time to complete. Stop-loss, intraday target, and position decisions should be based on individual analysis and overall market assessment. Strong fundamentals are essential for price to reach the designated target area.
We acknowledge our bias in this analysis, but it does not guarantee the realisation of the described outcome.
Upon trade activation, you can establish two targets. You have the flexibility to select your own take-profit based on your analysis and trade management strategies.
We appreciate your unwavering support.
For those who wish to contribute, we offer several avenues for assistance:
- Liking our ideas
- Commenting on our ideas
- Sharing our ideas
Thank you for your continued support.
If you feel inclined, we would be grateful for your generosity.
Best regards,
Team Setupsfx_❤️🚀
