ICP out of steam under 6.65Looks like 6.55ish is a decent short. 6.6 for tight sl, can go in super fat if it's really out of steam.
This may be a scalp but market bullishness is pretty much exhausted IMO especially after the PPI print, so I'm YOLO'd in 20x with a massive hunk of my account and a tight SL.
If it falls, whatever it's still just a couple points but upside can be pretty good.
Keep the risk management tight, don't be a loser.
Just wait a bit for it to confirm, enter a little tiny bit, check it holds under that 6.65 point. Put more in. Put more in as it falls. 6.65 is your cut point so just size it really fast and early to watch that area.
ICPUSDT.P trade ideas

ICP/USDTFor those holding onto ICP since forever, wait no longer. This baby will skyrocket and will drop the jaws of everyone.
Ideally, I am expecting a 1000% move upwards, but realistically will take some time to get there as it will take break stops on the way up. but buying now means your risk: reward ratio is skewed to your favour
SL @ 4.5
TP1 @ 17$
TP2 @ 30$

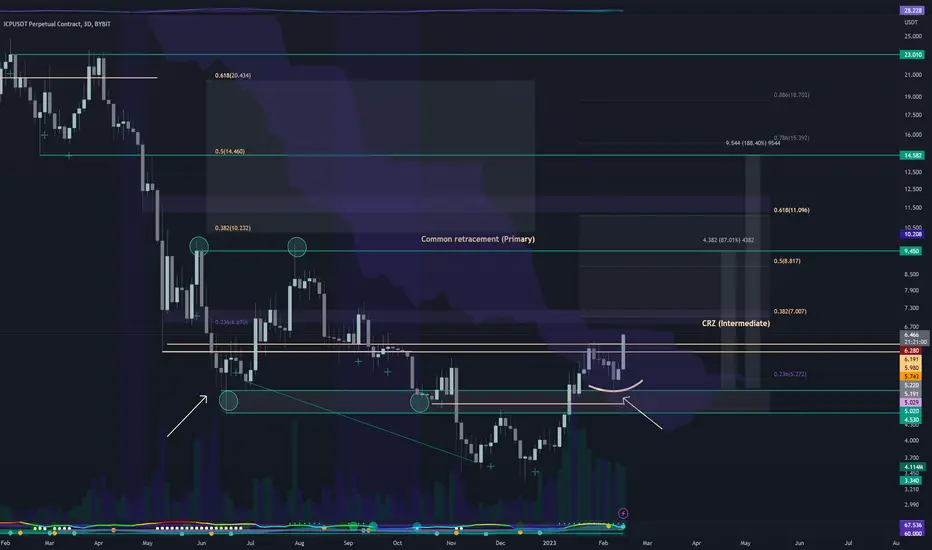
$ICP Major Support / Resistance flipICP looking great here still after recovering into the range and a successful checkback.
Breaking local highs here with overhead resistance at 7$.
Historically its straight up and down between here and 9.45 which is what the green circles represent. 14.58 would be the next resistance levels above that where the wave began that brought us into this part of the range originally if you look left.
Common pattern in the crypto market right now and one of the cleanest examples that hasnt already completed the return.
ICP : INCREASE VIEWStudy shows that ICP are interested in the next increase trend as the moment data shows.
We will follow up to see if it's ably to get confirmed.

(ICPUSD) has good growth potential to values of $14.30Bitcoin has shown growth to values of $25,000. By April and possibly including the month of April, Bitcoin may gradually reach around $30,000.
Altcoins currently have good entry points for a mini alt season.
Stop profit trade at a 1:7 ratio.
I have selected coins that are interesting to buy in this mini alt season and that have potential for growth.
— The coin ICP is a buy point at $6.20
— The zone ICP for profit-taking is $14.30

IS ICP BULLISH? OR A FAKE-OUT TO THE DOWNSIDEWe see ICP breakout out of its descending trendline and retracing to its weekly level of 5.319
so far it has created bullish market structure in the higher timeframes (HH,HL)
I would be more inclined to entering a nice long positions upon weekly close.
If you think you've gotten awesome content from my TA, please smash that like (boost) button!
It keeps me motivated to continue hitting the charts for y'all!!
I'd also love to see requests on any chart you'd like me to look at!
So please leave a comment on what Analysis you'd like me to do next! <333333

The price is likely to decline furtherThe first important support of the ICP is considered in the range of $4.6-4.8, but due to possible selling pressure, and because the last ceiling and floor in the 4-hour timeframe have not yet been broken to the upside, the price is likely to decline further. On the support side, there is a support range of $4.4 to $4.3. Therefore, considering the good price movement in the daily timeframe, we expect a strong positive reaction from these two support levels. Also, using the Fibonacci correction tool, the support range of 50% of the correction wave has been placed on the first static support, so this support is more confirmed.

Icpusdt Testing Trendline Testing Trendline In Daily Timeframe
Incase Of Breakout Expecting 200 To 250% Bulish Wave
Keep Eyes On That entry Can Be taken Once trendline Got Cleared
NOTE Always Wait For Breakout To Be Confirmed And Keep In Mind Icp Will Remain Bearish Until trendline Breakout

ICP/USDT waiting for a pullback! Hey, guys ✌️
Another one that caught our attention is ICP/USDT pair. Well won't talk long here but with opening of the stock market tmrw we see a good chance for a drop here bringing price back to where it was on the Friday (if we will have this kind of scenario we might form a H&S pattern as well)
If you like ideas provided by our team you can show us your support by liking and commenting.
Yours Sincerely,
Swallow Team 🔱
Disclamer:
We are not financial advisors. The content that we share on this website are for educational purposes and are our own personal opinions.

ICP Monster Move ImminentICP is getting ready to be squeezed up and destroy bears. Buy ICP right now!

Short if break FLAG-pattern (ICP)Short if break FLAG-pattern by short from High 2-leg in Breakeven to last trading reng

Back to pocketWe could be on our way back to the starting pocket, hopefully get a bullish reaction and continue the journey upwards, pressure is down for sure

ICP Trading plan for those who are out of position / long setupSo , today I decided to share with you my trading plan for this coin , this is due to the fact that most likely now a lot of people have missed the growth and comfortable entry points for altos , and in the market as a whole , and there are probably such among my readers , too , so right now I will tell you the whole plan for recruiting positions with excellent medium - termgoals .
Let 's start with the current situation , we have a clearly formed head and shoulders figure , its border is broken , which means it is confirmed . I believe that the price will continue its decline to the key support block of 5.2-4.9$, this decline fits perfectly into the structure of the market, it will demolish the stops on a similar decline in Bitcoin, thereby cooling the overheating. Why is the decline in this particular block ? This. the range is very strong and valid , and also confirmed by time , pay attention to how the price reacted in these price values .
Now , after we have identified a block that is comfortable for a position set , we begin to gradually gain a position , in this range we gain 50% of the allocated amount and put a stop that I marked on the chart , the execution of this stop in my opinion breaks the ascending structure and shows weakness . In general, you scored 50% of the amount that you allocated for this transaction and set a stop, now it remains for us to observe and get a position according to the buyer's reaction (noted on the chart), IT is IMPORTANT to do this on a clear confirmation and fixing on local time intervals (4h), so you have carried out another set already with CONFIRMATION that on our market is extremely important .
Congratulations, the main work is done, now we are just waiting for the full absorption of sales (falling) and already after the breakdown of $ 6.1 we add the final remaining amount to the position and hold it to our goals, after a bold breakdown and exit for $ 6.2, you can safely transfer the stop to no loss, it is important to note that your amount of addition should decrease, thatit would be hard not to shift your entry point .
If you have any questions about the transaction , I will answer in the comments , write . There are also a lot of current setups on the channel . Good luck in trading

Mlets seee Let's see what will happen if psss or nor the laned ....
Its nor financial advice but but im goin go buy 39990 $

✴️ ICPUSDT | Internet Computer (Name Your Altcoin #8 ✅)The Internet Computer (ICPUSDT) has gone through a similar pattern compared to other altcoins projects but some varieties can be seen as is usual.
The first one is the potential, we can see a whooping 860% that can be achieved for this pair in the mid- to long-term, within 3-6 months.
Short-term there is a massive 171% to 500%+, this while ICPUSDT already printed 6 weeks of green.
Here there is still no volume and just two weeks ago ICPUSDT managed to close above EMA21.
While the RSI is strong above 40 on the weekly timeframe, it still remains below 50, the altcoins we've been seeing are already well above 50.
We can either say that this chart is not as strong as the others or that it is much earlier for this pair, both are true statements.
The fact that 6 weeks closed green is a strong bullish signal, hardly ever a new low is followed after this type of action when a hitting a new multi-year or all-time low.
If you were to see 6 green small candles at high prices or near resistance, the possibility is always there for a drop but at support, we can say that consolidation/accumulation is taking place.
The next detail is the low, it happened on the week of 19-Dec. while many altcoins produced their lows much later.
This low came in as a perfect hammer, lets' review it:
The hammer must have a small real body. ✔️
The lower wick must be at least twice as long as the real body. ✔️
To be valid as a reversal signal, it must come at support or near the bottom of a trend. ✔️
Confirmation comes with multiple session closing above the hammers high. ✔️
This candlestick pattern, the hammer, can be invalidated with a close below the wicks low, in this case 3.357.
If if you get a close below this level you can say that the hammer as a reversal signal has been invalidated. Here it remains valid and has been confirmed on the other hand.
On top of multiple sessions closing green afterward we also have a bullish break of EMA10 and EMA21.
Now, any type of consolidation can happen but the stage is set for growth.
Once we reach this point, patience is all that is required to win.
Name your altcoin #8.
Namaste.

ICP longICP bounced off the ascending trendline and bounced off the support area. Bullish movement to resistance level at 6.13 is expected to happen.

ICPUSDT Analysis - 2 February 2023Hello Guys, Today's Analysis is on the ICPUSDT Symbol in a 15M Time frame, I Hope it Will be Useful for You, Don't Forget to Like, Follow, Comment

ICP to 6.50 in 36 hrIf we breakout of the current orderblock indicated on chart we could return to the top of the channel we were in 6.50 range
wait for entry until within the middle of the circle drawn on chart this confirming we have moved abov e the current liquidity block

ICP: Buy the breakoutHello traders!
Welcome back to another trade with Analyst Aadil1000x.
There is a breakout in ICP and the market is forming bullish patterns. This means the market will use this breakout to pump. We are setting buy limit at key reversal area.
ICP Buy Limit @ 5.71
Stoploss 5.604(-1.82%)
Target 1, 5.91(+3.45%)
Final Target 6.246(+9.42%)
Don't forget to hit the like button and follow to stay connected.

Internet Computer #ICP updateWhat is the Internet Computer and ICP?
The Internet Computer blockchain incorporates a radical rethink of blockchain design, powered by innovations in cryptography. It provides the first “World Computer” blockchain that can be used to build almost any online system or service, including demanding web social media, without need for traditional IT such as cloud computing services. As such it can enable full end-to-end decentralization.

Bottom of the ascending channelThe ICP support ranges are considered at $4.5 and $4.9, which can have a positive reaction. We expect the continuation of the upward trend from the desired support range. This week, if the bottom of the ascending channel is broken, the main wave could end, and a correction could begin.

ICP: Approaching ResistanceThe Internet Computer (ICP) technical analysis:
Trade setup : Bullish breakout from consolidating in a Sideways Channel ($3.50-$5.00). It’s now approaching 200-day moving average (resistance) around $6 and it’s overbought (RSI ~ 70), so it’s likely to get rejected here and pull back some near-term. Wait for price to either 1) break above $6 to resume uptrend with upside potential to $7.50, or 2) pull back near $5 support for a swing entry.
Trend : Uptrend on Short- and Medium-Term basis and Neutral on Long-Term basis.
Momentum is Bullish but inflecting. MACD Line is above MACD Signal Line and RSI is above 55 but momentum may have peaked since MACD Histogram bars are declining, which suggests that momentum is weakening.
Support and Resistance : Nearest Support Zone is $5.00 (previous resistance), then $3.50. The nearest Resistance Zone is $6.00, then $7.50.

