ICXBTC trade ideas

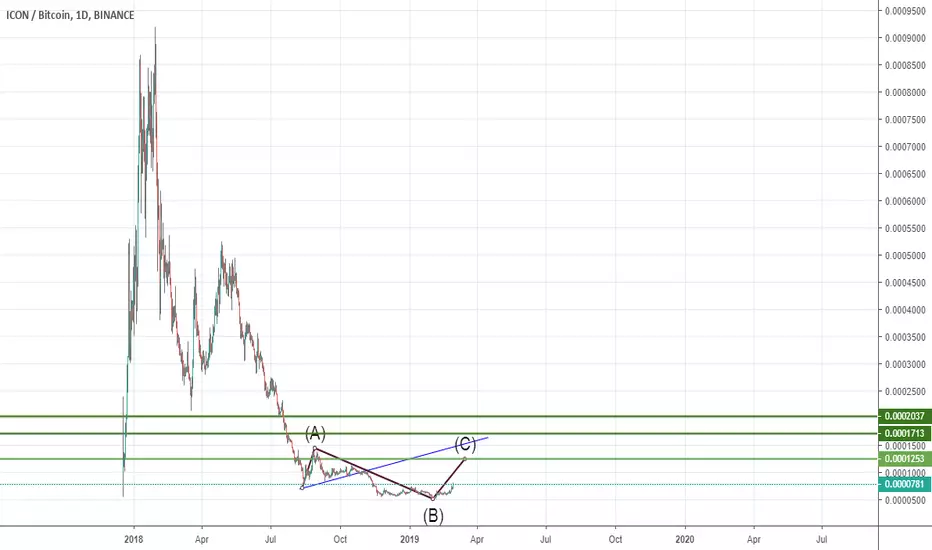
ICX Chart showing some bullish actionJust finished a long accumulation phase dating back from Nov 2018 till now.
ICX just broke out and should trade sideways for a little bit above 700 sats before a push near 1000 sats where the next resistance is.


ICX/BTC PA new all time lows on daily/hourlyICX/BTC PA new all time lows on daily/hourly
no support left, uncharted waters for this coin
bearish outlook

Icon (ICX) Long SetupICXBTC has been absolutely HAMMERED during the bear market. However, I've noticed some positive news recently for this coin, as well as a massive increase in volume. While I didn't catch the extreme lows, there is still plenty of potential upside. I'm practicing some VERY SMALL trades with high reward possibilities in order to build a trading stack from scratch. I've started out nicely with my BAT trade, that generated a 40% return right off the bat (no pun intended).
This setup is as follows:
BUY if we break above the ascending triangle resistance (around 735 to be safe)
Targets:
860
924
1028
1400-1500
This setup will be INVALIDATED if we break below the ascending triangle support and if we go below 675.
This is not financial advice. This is a trade that I'm currently in, with a very small position, just to try out some strategies.
-Victor Cobra


Possible long term trend reversal for ICONJust an observation that there the 8 day moving average and the 50 day moving average have now crossed on the daily (bullish) and it looks like we are about to set a new lower high (at 0.30c). Other oscillators also look bullish on the daily chart.

ICX/BTC Long1-Technical analysis:
#Classic Analysis: price is in historical supportive zone
& broke out 2 downtrend lines
#Indicators: chiko & span B cross
and kumo cross in Ichimoku indicator
2-Position details:
*Entry:After green zone’s breakout , get a good trigger in lower time frame
*Stop loss= 0.0000507-0.0000538
*Take profit 1=0.000107-0.000111
*Take profit 2=0.000138-0.000143
*Profit/Loss ratio= 1.2 minimum (based on TP1)


ICX is 50% profit in short termGuys, been calling how much profit potential ICX is for a while and the bottom from the last dip has been rounding off nicely. We have found support on the daily 25 and 50 EMA and now looking to attack the 100 DEMA and 200 DEMA. I expect a minor pullback on the daily from the 100 DEMA intersection but a more substantial pullback on the 200 DEMA intersection. I am not one for setting exact targets so far away from the event as crypto is very dynamic imo. I will update this idea with confirmation pushes. Thank you.


ICX scalp opportunity At Ladder Buy range from 700-720 sats. Resistance at top BB around 730 area. looking to get a good bounce from blue support trend line, (blue arrow is pointed to that area near 700 sats. can bounce from there to near 800 sats rage. if support trend is violated please use SL. mimic chart to follow trendiness in real time . good luck

ICON looking strongA number of encouraging signals on this chart. Not a project I know anything about. However looking at the 3-day chart is exciting, strong move to the upside on the Stochastic chart, RSI breaking previous resistance. Higher lows on the RSI. And now we're about to test price (again) set by the bottoming candle with increasing volume. I'm in.

MOONSHOT for ICXBTC [Binance] crossing 50EMA successfully.It's been 315 days after hitting the 50EMA again and successfully crossed the daily candle, potentially can go uptrend anytime. As tech giant company (Samsung) will be integrating a cryptocurrency wallet into their latest line of smartphones, the S10. ICON (ICX) is one of the offerings that the Samsung digital wallet will also offer is Digital ID.
TP1: 1100
Buying: Current price
Stop-Loss: 3% below your buying points


ICON Passive Breakout (Before The Jump!)Here is a quick trade idea to remind you about ICON (ICXBTC). This one has broken passively above EMA10 and EMA50 and it is looking bullish and ready to make a jump.
You can notice the green arrow and our targets in red.
The stop loss is marked in black. We use manual stop loss for trading altcoins (cryptocurrency).
RSI and MACD on the bull side.
Here is an active trade for ICON (ICXBTC) if you are looking for detailed trade instructions:
Remember to hit like...
Thanks for the continued support.
Namaste.

ICX/BTC scalp break outWe where keeping an eye on ICX over the last week with some healthy trades in this range which started to tighten up last night.
A small entry off the bottom of this range and we have now broken out of the pannent.
We are finding resistance here at the top of the range which was expected but hoping to see price hold about the down trend line. if so we will stay in and shoot for previous high.
If we fall back down below the white line we will stop out and look for another entry back down at the bottom of this range .
so far 4% shooting for 11%

ICXBTC Ichimoku and Volume Profile Looking Bullish12hour 100% Bullish Setup with price being above all lines and cloud being green. Look for pullbacks.
3hour 100% Bullish Setup with price being above all lines and cloud being green. Look for pullbacks.
1D Resisting 659. Nearest support is 634, then 611. Watch for pullbacks to support, we want to see clean bounces and strong buying volume off support.
1D Volume Profile shows that price is picking up and pushing away from POC around 636 price is rejecting the Value Area High 673.


Potential Bull flag?A break above this can take this asset above the falling wedge where its currently trapped. Set alerts and wait for chart to reveal itself.

