The analysis of PTBARSI showing that it on reversal stage and same goes to MACD showing us that is a good momentum for buying. I created big resistance due to the gap and used fib retracement to make sure the gap is valid. Prepare your money for "Menyerok" this stocks guys
PTBA trade ideas

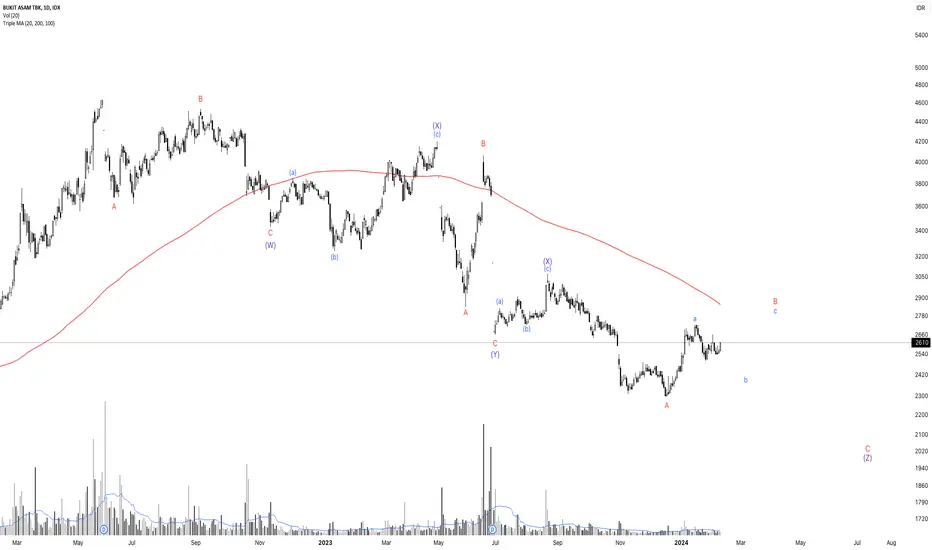
PTBA Elliott Wave Count Scenario 2In this scenario, we are also on the (b) wave of the (X) wave. I expect PTBA to drop again for a bit.
The 200-day MA could offer a strong resistance for the (c) wave. It could poke through, but I think its gonna continue to the downside afterwards.

PTBA Elliott Wave Count Scenario 1I believe we are in the B wave of the latest ABC correction to the upside. I'll post my other slightly different scenario than this one.
Please do share your ideas if you count any different from what I did. Thanks

Buy IfHave some planning for this
1. Wait for breakout fib618
2. Averaging 2x, start from fib05 area and the second start from fib382 area
This analysis just made for education purpose only
Trade with your decision
DisclaimerOn

PTBA in Retest ⚠️⚠️⚠️PTBA . Daily TF. Rising wedge pattern. Has broke the trendline support and go to the retest area (support that become resistance). Be carefull. It might do down if it rejected. Or if it enter the wedge area again and breakout the wedge, it is become bullish and cancel the bearish.


PTBATechnical Analysis is the forecasting of future financial price movements based on an examination of past price movements. Like weather forecasting, technical analysis does not result in absolute predictions about the future.

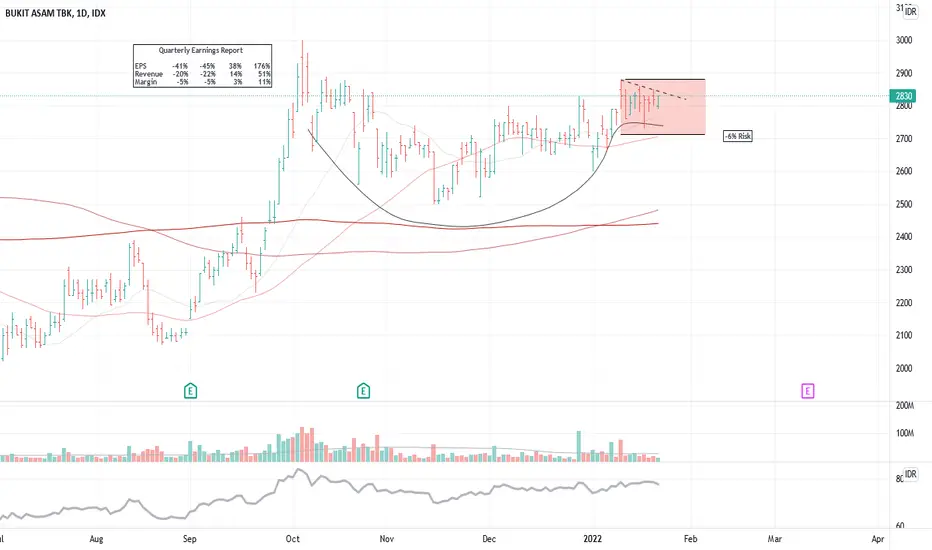
PTBA - CUP WITH HANDLESetting up a Cup with handle, the stock develops its handle area.
The fundamentals are outstanding, I like to see a break out very soon, I am watching this closely now.
PTBA possible to close the GAPPTBA is currently breaking its strong resistance at around 3030-3120. It can be seen on the chart that the price is breaking its strong resistance with a very strong bullish candle and supported by such a large volume. this has the opportunity to send the price up to the supply area around 3170-3830 where previously was a strong support area which was broken down in May 2019. As a result of the breakdown, we can see on the daily chart leaving the gap area right below the supply area that I marked . This indicates that there are a lot of sellers queuing up to sell in that area and we can use it as a price target.

PTBA inverted Head n ShoulderPTBA show inverter head and shoulder pattern in weekly timeframe
#riskdisclaimer

PTBA BULLPTBA, Fundamentals looking very strong, numbers looking good. The monthly chart indicates Positive movement. I think there will be momentum in Late Feb or Early March.
Once it crosses 3000 a key FIB level to watch, the upside is huge, April May June is a possible Dividend season, so all indicate positive.
if due to Macro situation, Fed Interest hike, Ukraine situation. market goes negative. then it can come to 2200 LVL but unlikely then I will buy more.
Anyway.. this is a personal POV, everyone should do their own analysis. and responsible for their decision.

PTBA possible Cup & Handle??Newcastle Coal is still high and PTBA supposedly will have great net profit for Q4-2021, so I think the possibility of this C&H pattern is very high. Hopefully PTBA can go above Rp 3200 per share.

IDX: PTBA FOR THIS WEEK 8-12 NOV 2021STRONG SUPPORT AT 2300
STRONG RESISTANCE AT 2700
I PREFER YELLOWTRADING PLAN
Disclaimer:
This information is for educational purposes and is not an investment recommendation or representative of professional expertise. This analysis used herein is for illustration purposes only. This personal opinion should not be considered specific investment advice. I am not responsible for any trades, and individuals are solely responsible for any live trades placed in their own personal accounts.

IDX: PTBA FOR THIS WEEK MEDIUM RESISTANCE AT 3110
STRONG SUPPORT AT 2700
I PREFER GREEN TRADING PLAN
Disclaimer:
This information is for educational purposes and is not an investment recommendation or representative of professional expertise. This analysis used herein is for illustration purposes only. This personal opinion should not be considered specific investment advice. I am not responsible for any trades, and individuals are solely responsible for any live trades placed in their own personal accounts.

IDX: PTBA FOR THIS WEEK STRONG SUPPORT 2300
STRONG RESISTANCE 2700
I PREFER GREEN TRADING PLAN
Disclaimer:
This information is for educational purposes and is not an investment recommendation or representative of professional expertise. This analysis used herein is for illustration purposes only. This personal opinion should not be considered specific investment advice. I am not responsible for any trades, and individuals are solely responsible for any live trades placed in their own personal accounts.

ptba loverptba lover fibonanciptba lover fibonanciptba lover fibonanciptba lover fibonanciptba lover fibonanciptba lover fibonanciptba lover fibonanciptba lover fibonanciptba lover fibonanciptba lover fibonanciptba lover fibonanciptba lover fibonanciptba lover fibonanciptba lover fibonanciptba lover fibonanciptba lover fibonanciptba lover fibonanciptba lover fibonanciptba lover fibonanciptba lover fibonanci
target 1 = 25xx
target 2 = 26xx

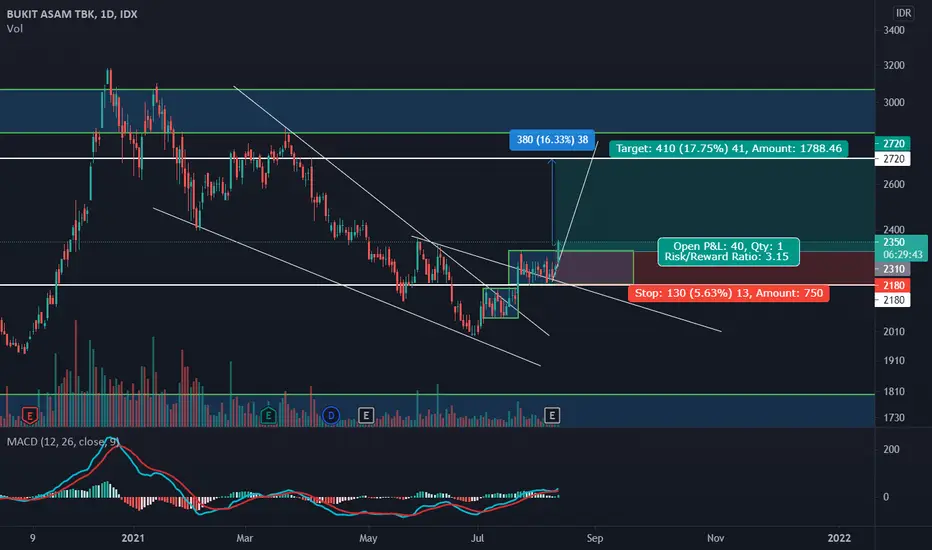
PTBA BUY ON BREAKOUTPTBA,
Still bearish, potential to make head and shoulders pattern, wait and see.
buy if break 2360.
TP 1 : 2740 (16,10%)
TP 2 : 3150 (33,42%)
TP 3 : 4560 (93,22%)
SL : 1870 (20,76%)

PTBA IS FORMING SYMMETRICAL TRIANGLE, POTENTIAl BREAKOUT TO 2400PTBA is forming symmetrical triangle after breaking the diagonal bearish trendline. PTBA already move above the dynamic support EMA 21&34, indicating that PTBA has chance to reach the target area 2400 after breaking the symmetrical triangle pattern.
Roadmap will be invalid if the price movement is moving below the support level 2170.

"PTBA" Break and Retest after rally from ICE NewCastle Coal Prices, PTBA break the trendline and retest the line. reversal just like before?


