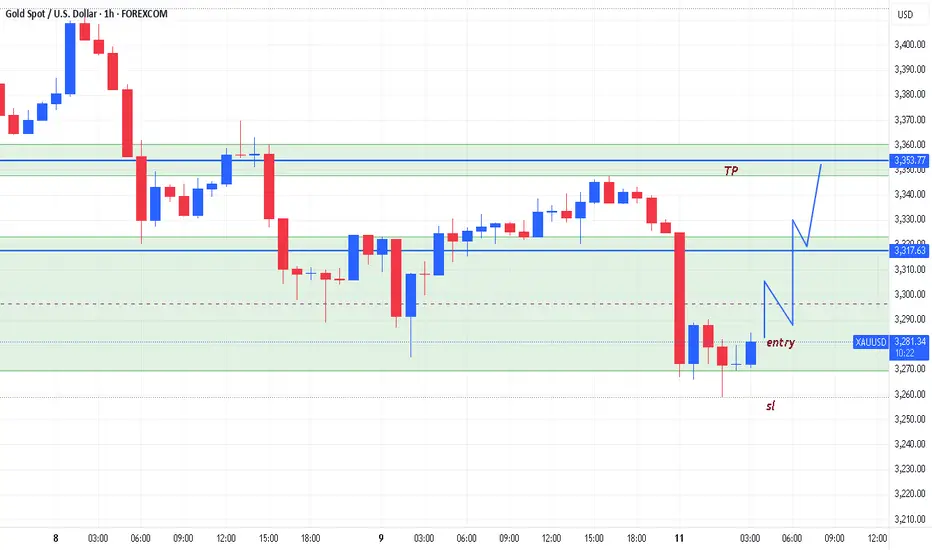
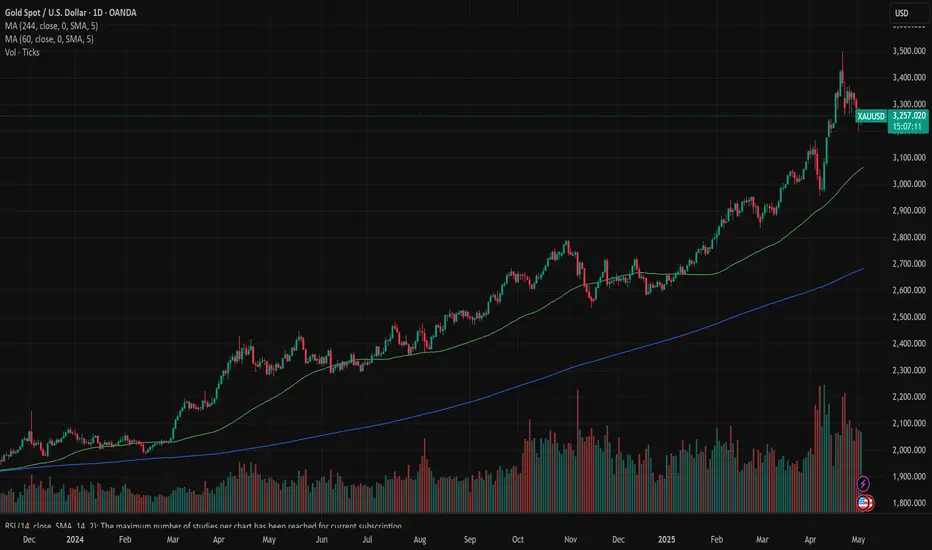
XAUUSD NEW KEY LEVELS📈 XAUUSD Trade Setup 📉
Please refer to the highlighted boxed zone 🟦 on the chart for key price action levels.
🔵 Buy Setup
Initiate a buy position if a candle breaks and closes above the boxed area.
Then, enter when the next candle breaks the high of the closing candle.
🔴 Sell Setup
Initiate a sell position if a candle breaks and closes below the boxed area.
Then, enter when the next candle breaks the low of the closing candle.
🎯 Target Levels
The blue lines 🔵 indicate our target levels.
Close 90% of your position to secure profits 💰.
Hold the remaining 10% for potential extended gains 🚀.
USCGC trade ideas

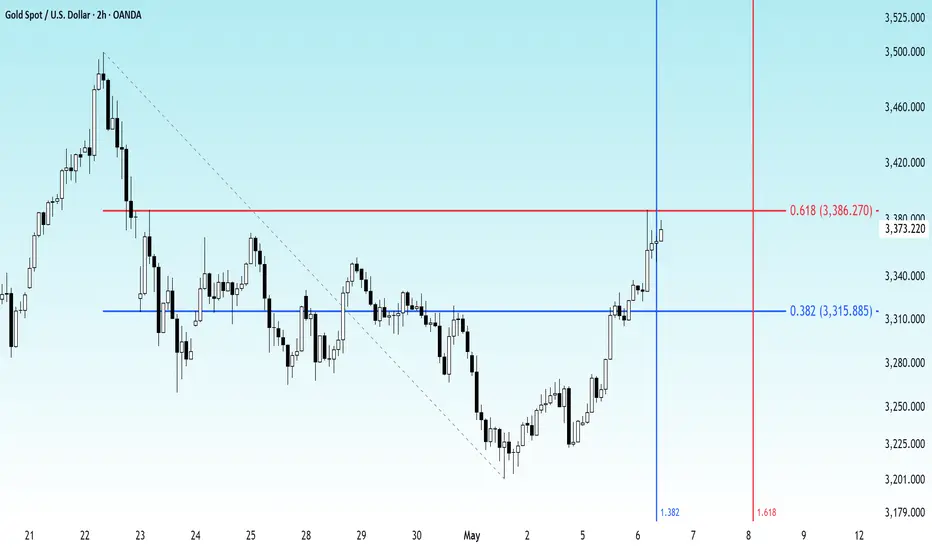
GOLD - A New High Is Coming?The price recently reached the 61.8% Fibonacci retracement level and at the same time, the has hit the 38.2% Fibonacci time level. This combination of price and time Fibonacci levels signals that the trend is strong and likely to continue. With this momentum, it is normal to expect a move towards a new high at 3580.
Gold falls, can it continue to fall before closing?Gold still fell in the morning, but it made a V-shaped reversal after bottoming out and rebounding, slightly breaking the morning high of 3323 and touching the pressure line of 3330. This trend is very subtle, which means that the support here is strong at 3274. You can be bearish but not too bearish. Focus on the support line of 3300 and see the rebound strength of the European session. If the European session stands on the pressure line of 3330, then consider shorting around 3360 in the evening, and the US session will be volatile. If the rebound strength of the European session is limited and it is always suppressed below 3330 and goes sideways, then you can continue to be bearish directly, and the support below is 3270-3253. If it breaks above 3330, then you have to pull back and do more.

Gold/ Silver ratio - approaching a resistance pointRatio is overbought in favour of gold
Silver could start outperforming if the overhead resistance hold

5.6 Gold Market Analysis5.6 Gold Market Analysis
Gold prices rose slightly today and then entered a volatile trend. It is expected that the market will continue yesterday's trend and rise steadily.
After the gold price rises, we will wait for the high to pull back to around 3350 before going long. In the morning, the gold price encountered resistance at 3380, so technically this suppression can be used as a key reference for the future market. If it does not break 3380, there is still a risk of falling.
The rise in gold prices in the past two days, whether it is caused by news or the opening of the Asian session, we must maintain a steady rhythm.
Today's support level is 3330, and the resistance level is 3380. The strategy is to go long on the decline.
Thank you for your attention, and I hope my analysis can help you.

Gold Buy Call #XAUUSDGold has broken out of a key resistance level at, $3,265 with strong bullish momentum and above-average volume, confirming the breakout. This move is supported by rising RSI and MACD crossover, indicating strength in the trend. The breakout from the consolidation zone signals renewed investor interest, likely driven by macro uncertainty and safe-haven demand.
Traders can consider initiating long positions at current levels with a stop-loss and take profit levels defined in the charts.

Falling towards pullback support?The Gold (XAU/USD) is falling towards the pivot and could bounce to he 1st resistance which has been identified as a pullback resistance.
Pivot: 3,361.29
1st Support: 3,310.00
1st Resistance: 3,490.34
Risk Warning:
Trading Forex and CFDs carries a high level of risk to your capital and you should only trade with money you can afford to lose. Trading Forex and CFDs may not be suitable for all investors, so please ensure that you fully understand the risks involved and seek independent advice if necessary.
Disclaimer:
The above opinions given constitute general market commentary, and do not constitute the opinion or advice of IC Markets or any form of personal or investment advice.
Any opinions, news, research, analyses, prices, other information, or links to third-party sites contained on this website are provided on an "as-is" basis, are intended only to be informative, is not an advice nor a recommendation, nor research, or a record of our trading prices, or an offer of, or solicitation for a transaction in any financial instrument and thus should not be treated as such. The information provided does not involve any specific investment objectives, financial situation and needs of any specific person who may receive it. Please be aware, that past performance is not a reliable indicator of future performance and/or results. Past Performance or Forward-looking scenarios based upon the reasonable beliefs of the third-party provider are not a guarantee of future performance. Actual results may differ materially from those anticipated in forward-looking or past performance statements. IC Markets makes no representation or warranty and assumes no liability as to the accuracy or completeness of the information provided, nor any loss arising from any investment based on a recommendation, forecast or any information supplied by any third-party.

Gold Trade Plan 12/05/2025Dear Traders,
The upward trend in gold continues. Considering the news from the U.S. and China, if the price breaks above the 3370 level and stabilizes above it, the bullish trend will continue. Otherwise, I expect a pullback to the 3270 level or lower.
If you enjoyed this forecast, please show your support with a like and comment. Your feedback is what drives me to keep creating valuable content."
Regards,
Alireza
Gold rises strongly and bulls restart!At present, the support of the 4-hour cycle is around 3330. If there is a chance of a decline, you can follow the bullish trend. In terms of short-term gold operation ideas, it is recommended to do more on pullbacks and short on rebounds. The upper short-term focus is on the 3415-3420 line of resistance, and the lower short-term focus is on the 3330-3350 line of support. Friends must keep up with the rhythm. It is necessary to control the position and stop loss, set stop loss strictly, and do not resist single operations.

Scalping Trade – Technical Analysis on Gold (1-Minute Timeframe)
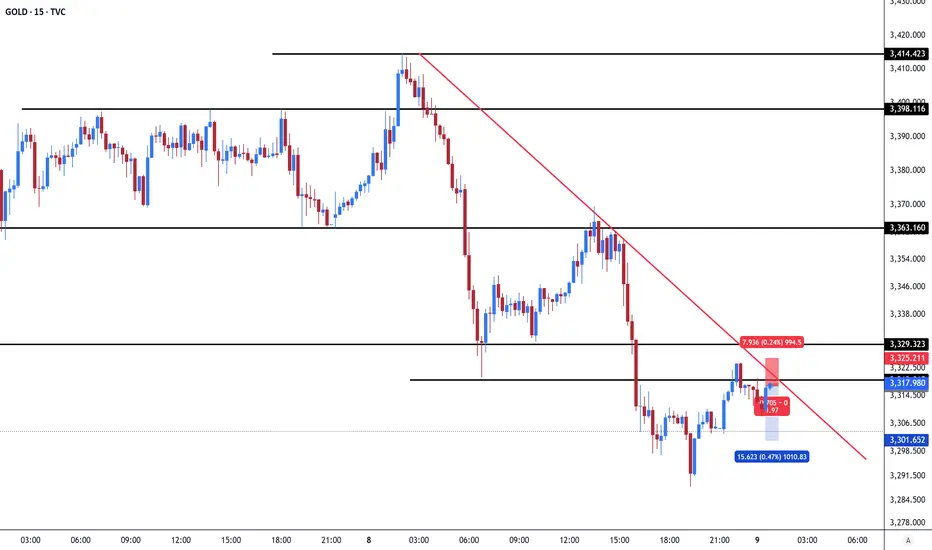
In this brief analysis, we examine a scalping opportunity on Gold (XAU/USD) using the 1-minute chart, focusing on a short-term technical setup supported by both price action and indicators.
The chart displays a well-defined downward trend, confirmed by two descending red trendlines. These trendlines have been respected consistently by the price, indicating a strong bearish structure. At the time of analysis, the price action approached a key resistance zone around the 3,319 level.
This resistance is notable for two reasons: it represents a horizontal level tested multiple times, and it coincides with a descending trendline, forming a confluence that increases the probability of a price rejection. This dual-resistance scenario presents a compelling case for a short entry.
A sell position was initiated near this resistance area. The stop loss is placed above the resistance zone, near 3,325, to protect against a breakout. The take profit is set around 3,301, targeting a recent support level established by a strong previous low. This provides a clean technical target within the current structure.
Supporting this trade idea, both the MACD and Stochastic Oscillator are showing overbought signals and have begun turning downward, suggesting weakening bullish momentum and the potential for a bearish reversal.
The trade offers a risk-to-reward ratio of approximately 1:1.97, which is considered favorable in scalping strategies, where precision and timing are critical.
gold analysisINSHA ALLAH GOLD will touch 3353 when gaining some pips then breakeven entry and hold to tp
3419 , gold price can reach today⭐️GOLDEN INFORMATION:
Gold price (XAU/USD) pulls back slightly from its intraday peak near a two-week high reached during Tuesday’s Asian session, but remains firm around the $3,360 mark, extending its winning streak for a second day. Improved US economic data has helped temper recession fears, offering modest support to the US Dollar. Meanwhile, signs of a potential thaw in US-China trade tensions have curbed safe-haven demand for gold, prompting some investors to adopt a wait-and-see approach ahead of the highly anticipated two-day FOMC policy meeting.
⭐️Personal comments NOVA:
Bulls regain the upper hand, uptrend nears 3400 ahead of market interest rate cut expectations
⭐️SET UP GOLD PRICE:
🔥SELL GOLD zone : 3418- 3420 SL 3425
TP1: $3410
TP2: $3400
TP3: $3385
🔥BUY GOLD zone: $3323 - $3321 SL $3316
TP1: $3330
TP2: $3340
TP3: $3358
⭐️Technical analysis:
Based on technical indicators EMA 34, EMA89 and support resistance areas to set up a reasonable BUY order.
⭐️NOTE:
Note: Nova wishes traders to manage their capital well
- take the number of lots that match your capital
- Takeprofit equal to 4-6% of capital account
- Stoplose equal to 2-3% of capital account

Gold Trade Plan 06/05/2025Dear Traders,
price broken 3320 (Means Market will continue Upward movement)
i expect price will be continue upward movement to 3400-3420 Area Today ,
If you enjoyed this forecast, please show your support with a like and comment. Your feedback is what drives me to keep creating valuable content."
Regards,
Alireza

GOLD - Trio Retest!Hello TradingView Family / Fellow Traders. This is Richard, also known as theSignalyst.
📈After rejecting the $3,500 round number and upper bound of the wedge, XAUUSD has been in a correction phase trading within the falling red channel.
📚 As Gold approaches the $3,100 - $3,150 support zone, I will be looking for buy setups on lower timeframes as it is the intersection of three rejections:
1- The lower bound of the falling red channel
2- The lower bound of the rising orange wedge
3- $3,100 - $3,150 support zone
📚 Always follow your trading plan regarding entry, risk management, and trade management.
Good luck!
All Strategies Are Good; If Managed Properly!
~Rich
Disclosure: I am part of Trade Nation's Influencer program and receive a monthly fee for using their TradingView charts in my analysis.

XAUUSD Still in Major Bullish Trend with Potential CorrectionOANDA:XAUUSD remains in a major bullish trend. Minor trend indicates potential correction before continuing upward. Correction target is the 200 EMA to fill the gap. Stochastic has already flipped downward, showing confluence with divergence.

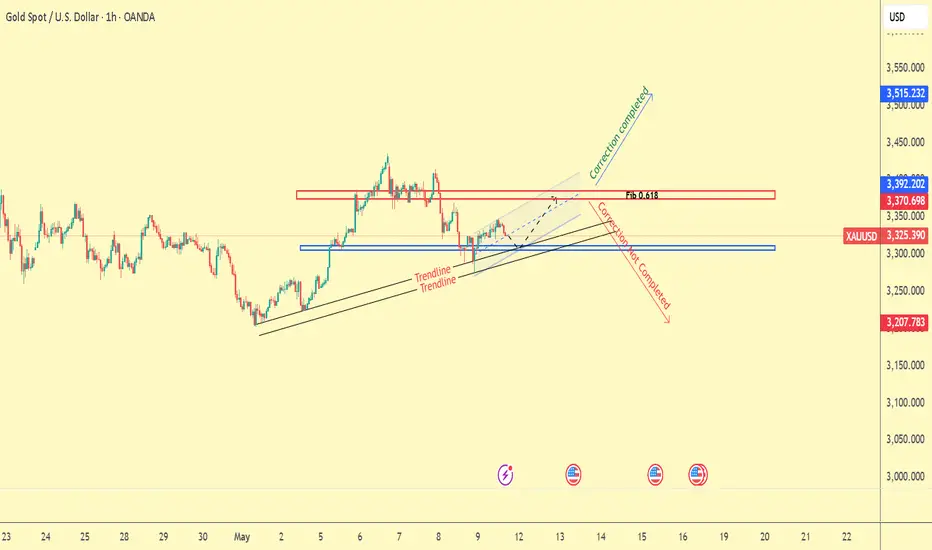
Fibonacci Confluence Fuels Gold’s Next Rally: Wave (Y) InsightThis 4-hour chart of XAU/USD is showcasing a WXY corrective pattern, a classic double zigzag (W)-(X)-(Y) correction after a strong impulsive move
Wave (W) has topped, marking the end of the first corrective leg.
A deep correction into the 0.5 Fibonacci retracement level occurred with wave (X), forming a potential higher low within the red demand zone.
Now, wave (Y) is anticipated, which typically mirrors or slightly exceeds the length of wave (W) but in a more corrective format.
Target 1: 3292.629
Target 2: 3372.161
Stop loss: 3201.955

Gold's volatile decline is in line with expectationsFrom the perspective of the 4-hour cycle, a big negative line closed down, breaking the support of the 5-day and 10-day moving averages. This wave may continue to fall to the Bollinger middle rail near 3300, but if it is a high-level shock, the Bollinger middle rail is not broken, and it may rise again to the high point of 3430. In this cycle, gold has experienced a big rise and fall, and now it is possible to rise or fall. In the short-term cycle, we will first pay attention to the support effect of 3360-3350 under weakness. If it does not break, we can continue to go long and bullish, with the upper target at 3400. On the whole, the short-term operation strategy of gold is recommended to be mainly short-selling on rebounds, supplemented by long-selling on pullbacks. The upper short-term focus is on the 3400-3405 line of resistance, and the lower short-term focus is on the 3350-3300 line of support.

Gold : Buy SetupGold :: 1 Hour chart
Buy Trade idea base on trendline
Wait for breakout and buy at retest area

bullish momentum, accumulating around 3400⭐️GOLDEN INFORMATION:
Gold price (XAU/USD) regained strong upward momentum during the Asian session on Thursday, rebounding sharply above the $3,400 level in the past hour and recovering much of its overnight pullback from a two-week high. The renewed demand for the safe-haven metal comes as US President Donald Trump downplayed expectations of an imminent resolution to the US-China trade dispute, stating he feels "no rush" to finalize an agreement. Heightened geopolitical tensions—including the ongoing Russia-Ukraine war, instability in the Middle East, and escalating military friction between India and Pakistan—further support gold's appeal as a defensive asset.
⭐️Personal comments NOVA:
Gold price continues to recover well around 3400, FED's speech is quite moderate, predicted early by investors, the market is positive in the recovery trend this week
⭐️SET UP GOLD PRICE:
🔥SELL GOLD zone : 3438- 3440 SL 3445
TP1: $3425
TP2: $3410
TP3: $3395
🔥BUY GOLD zone: $3352 - $3350 SL $3345
TP1: $3365
TP2: $3380
TP3: $3400
⭐️Technical analysis:
Based on technical indicators EMA 34, EMA89 and support resistance areas to set up a reasonable sell order.
⭐️NOTE:
Note: Nova wishes traders to manage their capital well
- take the number of lots that match your capital
- Takeprofit equal to 4-6% of capital account
- Stoplose equal to 2-3% of capital account

XAUUSD: Channel Up aiming for 3,750Gold has turned bullish again on its 1D technical outlook (RSI = 65.582, MACD = 62.840, ADX = 38.882) as it crossed above the 4H MA50 again, following a bottom on the HL trendline of the 4H Channel Up. The 4H RSI made a DB and the new bullish wave is already underway. We expect a similar +18% rally to the top of the Channel Up (TP = 3,750).
## If you like our free content follow our profile to get more daily ideas. ##
## Comments and likes are greatly appreciated. ##

Gold: trade tariffs relaxationAs trade tariffs “war” entered into relaxation mode, so the price of gold was easing during the previous week. The major event concerning trade tariffs during the previous week was the announcement from China's government that they are considering negotiations with the US Administration regarding imposed tariffs. Additional influx came also from better than expected US jobs data, in which sense, gold was trading with a modest negative sentiment during the week. The week started by testing the $3.350 short term resistance line, however, it ended at the level of $3.240.
The RSI turned away from the overbought market side, and ended the week at the level of 53. This level still does not represent a clear sign that the market is ready to take the turn toward the oversold market side. Moving averages of 50 and 200 days, without change, continue to move as two parallel lines with an uptrend.
Fundamentals have driven the price of gold to the ATH in a previous period, so fundamentals will continue to impact the price of gold also in the future period. Trade tariffs were the main driver, so as the trade war is settling down, the price of gold might ease also in the coming period. Gold is currently testing the level from the mid-April this year. In case that it is breached, then the next potential level for gold might be around $3.150. Certainly, it should be considered that the FOMC meeting is scheduled for May 7th, which might bring some volatility back on the market, considering current market sensitivity regarding potential Fed's rate cut. At this moment on charts, the price of gold has equal probabilities for a move both toward the up, and down side.
XAUSD FOMC - Gold Sniper Plan - May 7 - 2025💥 XAUUSD FOMC Sniper Plan – May 7, 2025
"We Don’t Chase Breakouts. We Build the Trap Before the Noise."
🌍 Macro & Geopolitical Context – What Really Matters Today
Markets are frozen in anticipation of tonight’s FOMC bombshell:
📌 20:00 UTC – FOMC Statement & Rate Decision
📌 20:30 UTC – Powell Speaks
Traders are split. Some expect a dovish tone to push gold through ATH. Others brace for a hawkish surprise.
But let’s get one thing straight:
Gold has already run thousands of pips. It doesn’t need help going higher — it needs a reason not to collapse.
That’s what Powell holds in his hands tonight.
Meanwhile, geopolitics stay hot in the background:
Middle East tensions simmer (again).
Trump pressure on Powell to step down adds political risk.
Global yields are compressing → gold remains macro-favored.
This is not a time for guessing. This is a time for traps.
🧠 Current Structure Snapshot (Price: 3431)
HTF is still bullish, but we're extended.
Last confirmed HH = 3488, with ATH = 3500
We're in a short-term retrace under a H4 CHoCH → excellent sniper conditions.
🧱 Key Structural Levels
Zone Type Price Range Context
🔼 R2 3488–3495 Last HH OB + extension sweep trap
🔼 R1 3448–3455 H4 OB + liquidity pocket under HH
🔽 S1 3378–3384 H4 OB + FVG + EMA 50 confluence
🔽 S2 3333–3340 D1 OB + CHoCH + imbalance zone
We don't use FIBO extensions for guessing entries. We use them to target the crowd who does:
Extension Price Range Use
1.272 3530–3535 TP3 only
1.618 3575–3580 Final exhaustion area
🎯 Sniper Setups – Real, Refined, Ruthless
🟢 Buy #1 – 3378–3384
Valid H4 OB
FVG tail fill + internal liquidity
RSI around 40 + EMA 50 bounce
SL: 3365
TP1: 3405 | TP2: 3430 | TP3: 3455
🧠 Our first reaction zone before news madness.
🟢 Buy #2 – 3333–3340
D1 OB + imbalance
Clean internal liquidity from 3300–3330
Confluence with CHoCH base
SL: 3315
TP1: 3370 | TP2: 3405 | TP3: 3448
💎 This zone is invisible to retail — perfect trap before spike.
🔴 Sell #1 – 3448–3455
H4 OB at premium
EMA rejection + FVG close
Pre-news stop hunt ideal here
SL: 3462
TP1: 3430 | TP2: 3405 | TP3: 3385
🎯 Don’t short gold randomly — short it here, where retail longs trap themselves.
🔴 Sell #2 – 3488–3495
Last HH OB before ATH
Strong fibo ext confluence
Sweeps = liquidity + exhaustion
SL: 3504
TP1: 3465 | TP2: 3430 | TP3: 3395
If they want to break ATH before Powell, we’ll be waiting above it.
⚙ EMAs in Sync
EMA Signal
21 Tested from below — sell confluence at 3448
50 Lining up near Buy #1
200 Far below — macro still bullish
🧠 Execution Plan
Stay flat before FOMC unless setups trigger with PA confluence
Anticipate whipsaws → SLs must be respected
If price consolidates above 3455 = bullish continuation likely
If it sweeps 3448–3455 and rejects = sell of the week
Drop a 🚀 and follow us: if you’re not trading emotion — you’re trading execution.
📌 Important Notice!!!
The above analysis is for educational purposes only and does not constitute financial advice. Always compare with your plan and wait for confirmation before taking action.

H4 frame accumulation 2 trend lines✍️ NOVA hello everyone, Let's comment on gold price next week from 05/12/2025 - 05/16/2025
🔥 World situation:
Gold prices advanced over 1% on Friday, rebounding as the US Dollar (USD) softened following a two-day winning streak, pressured by declining US Treasury yields. Renewed risk-off sentiment, fueled by persistent geopolitical tensions, bolstered demand for the safe-haven metal. At the time of writing, XAU/USD is trading near $3,338.
US equity markets slipped as investors adopted a cautious stance ahead of Saturday’s high-stakes meeting between US and Chinese delegations in Switzerland. While hopes for a de-escalation in trade tensions remain elevated, uncertainty continues to dominate sentiment.
Adding to the volatility, US President Donald Trump reignited trade concerns by stating on social media, “80% Tariff on China seems right! Up to Scott B.”
🔥 Identify:
Gold prices slow down, starting to accumulate more. Trade negotiations will appear more, putting selling pressure on gold prices in the near future.
🔥 Technically:
Based on the resistance and support areas of the gold price according to the H4 frame, NOVA identifies the important key areas as follows:
Resistance: $3402, $3435
Support : $3282, $3203
🔥 NOTE:
Note: Nova wishes traders to manage their capital well
- take the number of lots that match your capital
- Takeprofit equal to 4-6% of capital account
- Stoplose equal to 2-3% of capital account
- The winner is the one who sticks with the market the longest
