Gold falls under pressureAlthough gold surged in the morning, it continued to fall in the afternoon and fell to 3320. Currently, gold rebounded moderately, but it is still under pressure after the sharp drop. The adjusted golden section line position, the 0.5 position of this wave of decline is the 3320-3318 area. The price bounced when it was touched for the first time. Going down, we need to pay attention to the 0.618 position 3288 area, which is close to the four-hour lower track 3284 area. The two together become the support area. The excess range is the double-line lower track 3270 on the hourly chart. Tonight, it is still a rebound to short, and pay attention to the 3370-74 line resistance situation above.
USCGC trade ideas

Spot the trap ride the reversalI believe there will be many trapped long traders here as they are losing momentum. If all works out we are in for a treat today!

Gold fluctuates and tests new high again!Gold surged and then fell back, and the pattern needs to be sorted out; the stochastic indicator crosses at a high level, and runs downward, the indicator and the pattern resonate and adjust; the top and bottom conversion below, the support point of the sideways rise is in the range of 3380-3370; if it falls back and keeps going down, then the main trend is to pierce the trend and fall back to the range of 3390-3200; the range span is relatively large! In terms of short-term operation ideas, according to the suppression near 3440, the short-term correction is expected; the support position below is near 3290 and 3205; there are many short-term cards; deal with it according to the range;

XAUUSD:Sharing of the Latest Trading StrategyAll the trading signals today have resulted in profits!!! Check it!!!👉👉👉
On Tuesday, gold witnessed a surging rally. It perfectly achieved the feat of "killing both bulls and bears" within the day. Here is the latest trading strategy.
After a significant rally on Monday, gold continued its upward momentum on Tuesday, with the increase approaching the 3,400 mark. The bullish sentiment was extremely high. Leo issued a single trade prompt for VIPs to go short, and suggested going long during the European session when the price pulled back. Both the short and long trades successfully reached the take-profit targets. Currently, judging from the trend, it still remains in a bullish pattern. In the US session, continue to go long at a low level following the trend. Pay attention to the support in the 3,370 area below.
Trading Strategy:
buy@3370-3380
TP:3390-3400
The signals in the Signature have brought about continuous profits, and accurate signals are shared every day. Hurry up and click to get them!
👇 👇 👇 Obtain signals👉👉👉

Gold’s Got Its Groove Back: Morning Star Lights the Way to $3500Gold delivered a powerful signal pointing to a resumption of the bullish trend, completing a morning star pattern that saw it break out of the falling wedge it had been trading over the past fortnight. It would have been nice to catch the initial move, but all is not lost after the price broke above $3367 on Tuesday.
The price has run hard, so I’m reluctant to chase the move. But if we see a pullback and bounce from $3367, it would generate a bullish setup where longs could be established above the level with a stop beneath for protection. The obvious trade target would be the record high of $3500 set in April.
If the price were to reverse below $3367 and stay there, the setup would be invalidated.
Good luck!
DS

Sideway range, gold price accumulates below 3302⭐️GOLDEN INFORMATION:
Gold price (XAU/USD) kicked off the week on a positive note, rising toward the $3,271 level during Monday’s Asian session as a blend of geopolitical and economic concerns fueled demand for the safe-haven asset. The prolonged Russia-Ukraine conflict, coupled with renewed tensions in the Middle East, continues to elevate global risk sentiment. Meanwhile, lingering uncertainty surrounding US President Donald Trump's tariff agenda has added to investor caution, further supporting the appeal of gold as a hedge in times of instability.
⭐️Personal comments NOVA:
Gold price continues to accumulate, low amplitude at the beginning of the week, waiting for the most important interest rate information this week
⭐️SET UP GOLD PRICE:
🔥SELL GOLD zone : 3302- 3304 SL 3309
TP1: $3290
TP2: $3280
TP3: $3270
🔥BUY GOLD zone: $3204 - $3206 SL $3199
TP1: $3215
TP2: $3224
TP3: $3240
⭐️Technical analysis:
Based on technical indicators EMA 34, EMA89 and support resistance areas to set up a reasonable SELL order.
⭐️NOTE:
Note: Nova wishes traders to manage their capital well
- take the number of lots that match your capital
- Takeprofit equal to 4-6% of capital account
- Stoplose equal to 2-3% of capital account

XAU/USD: Strategic Analysis on ThursdayThe interest rate decision of the Federal Reserve is in line with market expectations and does not go beyond the scope of the widespread market anticipation before.
In terms of gold, the price of $3,350 serves as a crucial dividing line at present. If the gold price can successfully stop falling and stabilize near this price level, forming an effective support, it indicates that the bullish forces still dominate, and the upward market trend in the future is expected to continue. Conversely, once this price level is broken, the bearish sentiment in the market will rapidly heat up, and the price is likely to further decline, seeking a new support level below $3,320.
The geopolitical situation continues to deteriorate. The most intense military conflict in nearly a decade has broken out between India and Pakistan, and the civil war in Sudan is also escalating. These conflicts not only pose a serious threat to the regional and global peace and stability but will also have a significant impact on the commodity market. As a traditional safe-haven asset, the safe-haven attribute of gold will be further stimulated, and its price is expected to receive strong support. At the same time, the war may lead to uncertainties in energy supply, thus driving up the prices of energy sources such as crude oil.
XAUUSD
buy@3350-3360
tp:3390-3400
I am committed to sharing trading signals every day. Among them, real-time signals will be flexibly pushed according to market dynamics. All the signals sent out last week accurately matched the market trends, helping numerous traders achieve substantial profits. Regardless of your previous investment performance, I believe that with the support of my professional strategies and timely signals, I will surely be able to assist you in breaking through investment bottlenecks and achieving new breakthroughs in the trading field.

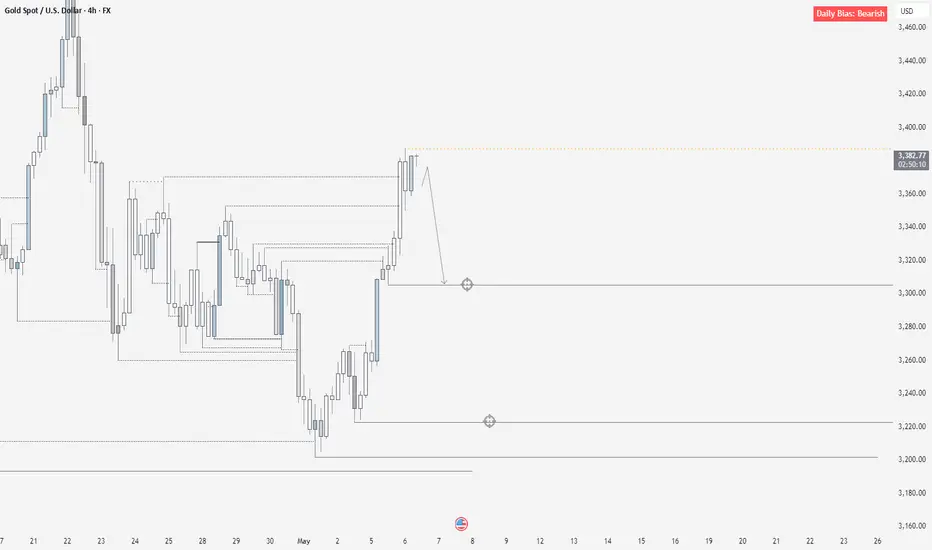
XAUUSD 6/5/25We remain bearish on gold, as we called in the middle of last week. However, until we see a clear reaction that confirms a move lower, we believe price could still push higher.
Fundamentally, we are bullish on gold, but our current bias is bearish. Of course, our bias can be wrong. When price pulls back within our bias—essentially moving against what we expect—it doesn’t mean we blindly jump in just because we believe in a certain direction. Instead, we wait for a clear reaction in line with our bias before entering, so we can follow the trend with confirmation.
Remember the principles we always emphasize: our bias is the direction we believe price is heading. But if we’re welcomed into the market during a pullback—even if it’s against our bias—we will trade it accordingly. Right now, we are not being welcomed. Price is rallying against our bias, so we remain on the sidelines until a suitable entry is provided.
As mentioned before, Orion has indicated that price action could be bearish. However, gold is heavily driven by fundamentals, which means we may not get an entry here at all. If the market shifts and our bias needs to change, we’ll adapt as always. But we stick to our rules, manage our risk, and let price show us where it wants to go.
At the current point, if we don’t see a bearish move from here, we could be on track to see a new all-time high. For now, we’re not seeing an entry setup, which means our bias is not being fulfilled for a trade. As far as I'm concerned, this is the last potential reversal zone for gold.
Keep this in mind if price continues to push higher as today's session begins. Trade safe, stick to your plan, and let Orion lead the way.
Hanzo | Gold 15 min 3315 – Next is bearish Move🆚 Gold – Hanzo’s Strike Setup
🔥 Timeframe: 15-Minute (15M)
——————
💯 Main Focus: Bearish Reversal at 3317
We are watching this zone closely. Expecting Reversal
———
Analysis
👌 Market Signs (15M TF):
• Liquidity Grab + CHoCH at 3265
• Liquidity Grab + CHoCH at 3318
• Strong Rejections seen at:
➗ 3270 – Major support / Key level
➗ 3325 – Proven resistance
🩸 Key Zones to Watch:
• 3272 – 🔥 Bullish breakout level X 7 Swing Retest
• 3325 – Strong resistance (tested 5 times)
• 3270 – Equal lows
• 3328 – Equal highs

Gold Trade Plan 5/5/2025Dear Traders,
If we take a look at the gold chart, it is currently in a descending channel, and the price is trying to reach the top of that channel. Given these conditions, I believe the price will reach the target zone around 3285–3290 by midweek. If we observe a rejection at that level, we can enter a sell position, with the first target being the midline of the channel and the final target being the bottom of the channel. If the descending channel is strongly broken and the price stabilizes above it, a new update will be necessary.
Trend-base Fibo Extension AB=CD 3290
Fibo Retracement(1.618)= 3298
Top Of Descending Channel : 3290-3300
So we Are looking for Reversal 3290-3300 Area !
If you enjoyed this forecast, please show your support with a like and comment. Your feedback is what drives me to keep creating valuable content."
Regards,
Alireza

XAUUSD - Could we see $3,200?Gold appears to be showing signs of exhaustion after its impressive rally to record highs near $3,500 per ounce, with recent price action forming a potential double top pattern. The downward-pointing arrow on the chart suggests bearish momentum is building, and with the price currently hovering around $3,326, we may be witnessing the early stages of a deeper pullback toward the lower support box around $3,200. This correction would represent a healthy consolidation within gold's long-term uptrend, allowing overextended technical indicators to reset before the next potential leg higher. Fundamental factors including potential profit-taking, a temporary strengthening in the US dollar, and positioning adjustments ahead of upcoming economic data could accelerate this move toward the $3,200 target in the coming weeks.
Disclosure: I am part of Trade Nation's Influencer program and receive a monthly fee for using their TradingView charts in my analysis.

GOLD Is Going Down! Sell!
Take a look at our analysis for GOLD.
Time Frame: 15m
Current Trend: Bearish
Sentiment: Overbought (based on 7-period RSI)
Forecast: Bearish
The market is testing a major horizontal structure 3,321.83.
Taking into consideration the structure & trend analysis, I believe that the market will reach 3,305.50 level soon.
P.S
The term oversold refers to a condition where an asset has traded lower in price and has the potential for a price bounce.
Overbought refers to market scenarios where the instrument is traded considerably higher than its fair value. Overvaluation is caused by market sentiments when there is positive news.
Disclosure: I am part of Trade Nation's Influencer program and receive a monthly fee for using their TradingView charts in my analysis.
Like and subscribe and comment my ideas if you enjoy them!

GOLD Possible bearish movesGOLD Weekly Outlook – Waiting for a Clean Entry
My focus this week on gold is based around the recent mitigation of the 3H supply zone. It was a clean setup, but unfortunately I didn’t get tapped in — and with it being late Friday, I decided to wait for a better entry, potentially on Monday.
As bullish pressure begins to weaken, I’m also keeping an eye on the 4H supply zone above, which could offer a stronger bearish reaction and a better opportunity to sell.
On the flip side, for any potential bullish continuation, I can see price sweeping the liquidity sitting below and then reacting from the 5H demand zone I’ve marked out. That area could provide the base for a re-accumulation and another move to the upside.
Confluences for GOLD Sells:
- Clear bearish reaction from the 3H supply zone with a completed Wyckoff distribution
- Liquidity to the downside remains untapped
- Weakening bullish momentum opens room for a possible sell-off
- DXY is showing short-term bullish strength, supporting a bearish bias on gold
P.S. If price reverses and takes out the current supply zone, I’ll be watching the next 4H supply zone for further reaction — but in the meantime, I’ll adapt by monitoring for a closer demand zone setup.
Have a great trading week ahead and stay sharp, traders!

Gold Market Retests After Weekly Supply SweepGold market mitigated the 3300 level, clearing weekly supplies at 3316. A reaccumulation is expected as price may retest the 3270 zone before the next directional sentiment sets in. follow for more insight , comment and boost idea

Gold intraday trading plan 5/12/2025As explained in my weekly forecast, I am still bullish on gold. The current opening drop can be seen as a good buying opportunity. I will monitor the price action closely at 3270 level. As long as this level holds, I will buy towards 3370 today.
However, if 3270 is broken, gold may turn to bearish in short term.

XAUUSD_4HXAUUSD_4H Gold price is the important number this week at $3333 and with the price above this number the trend is bullish. Important number $3333 Below this number caution Above this number buyer

Gold on expected upswingTechnical analysis: Nothing irregular at the moment on the Short-term as Gold (Xau-Usd Spot) continues to Trade on Buying extension taken from local Low's Bullish accumulation within #3,370’s zone with clear Resistance point, and Support levels / ready to deliver the breakout I was after. I highlighted many times recently that every / more serious decline may represent Buying accumulation towards new ATH's. The underlying Medium-term trend is still Bullish, so if the Intra-day Low breaks throughout today’s session, then I expect another run towards the #3,400.80 benchmark / Higher High's Upper zone and possible benchmark extension. One important difference though: the Hourly Moving Average broke and for the first time in #3 sessions Gold was testing it from below as a Resistance (this was needed to break again to comfort Buyers). However, if (November #4 - #9) / (January #1 - #6) (January #20 - #25) variance is yet to be repeated, Gold finished the same pattern (Trading on such configuration) and now should engage the aggressive decline once local High's are met.
My position: My practical suggestion is to Buy every dip on Gold.

XAUUSD Bounce to daily resistance?Hello traders, this is a complete multiple timeframe analysis of this pair. We see could find significant trading opportunities as per analysis upon price action confirmation we may take this trade. Smash the like button if you find value in this analysis and drop a comment if you have any questions or let me know which pair to cover in my next analysis.

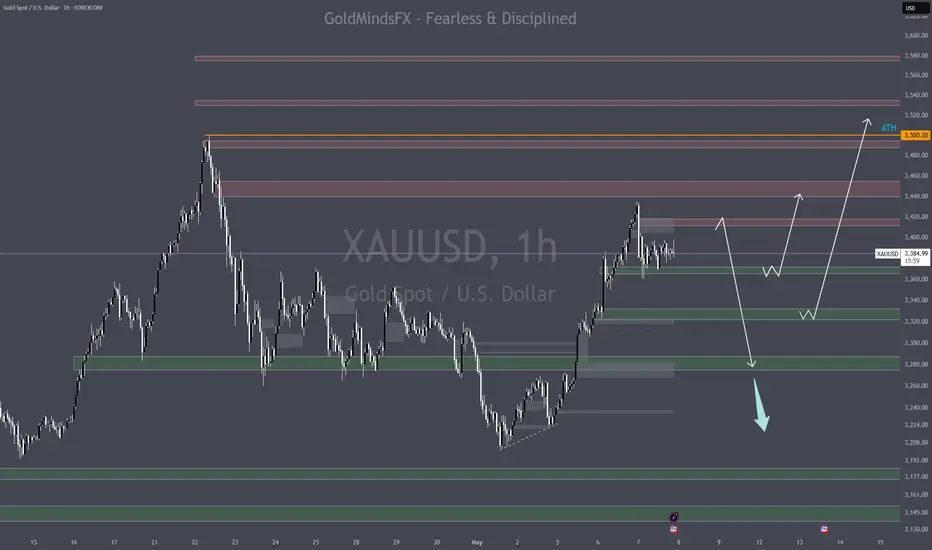
XAUUSD Weekly Outlook – May 12–17, 2025High Timeframe Bias: Bullish with active pullback under premium supply
🔍 Macro Structure Insight:
Market structure remains bullish on Weekly, with a recent ATH at ~3500.
Price showed a strong rejection from the 3448–3500 premium supply zone but found support near 3284–3292.
We are currently in a retracement phase, and the next few candles will determine if it’s a reload or deeper correction.
📌 Key Weekly Structural Zones
Zone / Level Description
3500 ✅ ATH – liquidity sweep & rejection
3448–3500 🔺 Premium Weekly Supply – key rejection zone
3380–3395 🔁 Weekly FVG – potential short-term resistance
3284–3292 🔵 Fresh Support – demand reaction after daily wick bounce
3220–3250 🔵 HTF Weekly Demand – equilibrium & previous BOS zone
3120–3150 ❗ Critical Support – losing this would break bullish structure
📈 Fibonacci Weekly Extension Zones (Above ATH – 2285 → 3500 Leg)
Extension Level Target Price Description
1.0 3500 Current ATH
1.12 3560 First minor extension
1.18 3590 Shallow breakout target
1.236 3620 Key fibo confluence zone
1.272 3645 Round-level + breakout magnet
1.33 3680 Sentiment shift potential
1.414 3720 Major HTF fibo extension
1.5 3760 Mid-range round milestone
1.618 3800–3820 Golden extension + HTF magnet zone
🔁 Scenarios for This Week:
Bullish Continuation:
If 3284–3250 holds as a higher low → market may aim for 3380–3395, then test 3448–3500 again.
Breaking above ATH could trigger targets toward 3560 → 3590 → 3645.
Bearish Retracement:
If price breaks below 3250, a deeper move toward 3120–3150 could begin. This would threaten the weekly bullish leg.
⚠️ Watch for:
Weekly close below 3250 = short-term bearish shift
Push and hold above 3360–3380 = signs of bullish continuation
Rejection from 3448–3500 again = potential double-top liquidity trap

Special attention needs to be paid to gold operations on FridayThe current price fluctuates around the 3300-3348 range, with resistance at 3348-3352 and support at 3295-3303. If it breaks through 3348, be wary of a second surge to around 3365; conversely, if it loses 3295, it may fall back to the 3275-55 area.
Gold recommendation: short sell near 3335-3345 when it rebounds. Target position 3320-3310.

Gold Market Update - XAUUSD post FOMC May 7🎤 Context: FOMC day just dropped the mic. Market’s fidgety. Fed held rates steady (no shocker), Powell said plenty (but meant little), and Gold just tap danced at resistance like it’s auditioning for Wall Street’s Got Talent. Let’s dissect it all and get sniper-precise.
🔍 MACRO CONTEXT
💣 FOMC Rate Decision: Rates unchanged. Dovish tilt in Powell’s tone – soft landing narrative holding.
💼 Market Impact: Dollar hesitant, equities flat, Gold caught in limbo near intraday premium.
🧠 Sentiment: Risk-on... cautiously. But Gold's structure says, “I still have traps to set.”
🧠 STRUCTURE INSIGHTS (H4 → M1)
🔹 H4 Bias: Bullish swing (CHoCH → BOS intact), premium territory.
🔹 H1-H4 Key Zone: 3451 = Previous HH, now resistance and first critical liquidity magnet.
🔹 Current PA: Sideways chop just under intraday premium.
🔹 Liquidity Above: Weak High around 3415–3420 ready for sniping.
🔹 Liquidity Below: HL sweep and imbalance open below 3384, with clean demand at 3366–3372.
🎯 SNIPER SELL ZONES
Sell #1 – 3412–3418 (Refined rejection block)
🟪 Confluence: 5M FVG + weak high + premium OB
🎯 Entry: 3412–3418
🛑 SL: 3425
🎯 TP1: 3390
🎯 TP2: 3372
🎯 TP3: 3350
Sell #2 – 3440–3455 (Retest)
💣 Only valid if price breaks above 3420 and sweeps next liquidity.
🟩 Entry: 3440–3455
🛑 SL: 3463
🎯 TP1: 3420
🎯 TP2: 3390
🎯 TP3: 3370
🎯 SNIPER BUY ZONES
Buy #1 – 3366–3372 (H1 OB + FVG confluence)
📌 Real-time unmitigated demand with strong structural confluence
🎯 Entry: 3366–3372
🛑 SL: 3355
🎯 TP1: 3395
🎯 TP2: 3415
🎯 TP3: 3440
Buy #2 – 3322–3330 (Deep liquidity sweep + H4 equilibrium zone)
💧 Only valid if full breakdown under HLs
🎯 Entry: 3322–3330
🛑 SL: 3305
🎯 TP1: 3355
🎯 TP2: 3370
🎯 TP3: 3390
⚔ BIAS
NY Session Bias: Sideways-to-bearish while under 3415
Macro Bias: Still bullish HTF, but intraday liquidity still needs clearing
Risk Note: FOMC aftermath = traps galore. Sniper entries only. No hero buys or chases.
Drop a 🚀 and follow us!
📌 Important Notice!!!
The above analysis is for educational purposes only and does not constitute financial advice. Always compare with your plan and wait for confirmation before taking action.
View on the short-term trend of gold!📌Fundamentals:
Gold prices fell sharply. After Trump announced a "breakthrough" trade deal with the UK, market expectations for more similar deals increased, weakening gold's appeal as a safe-haven asset.
📊Technological aspects:
Gold quickly fell in the Asian session and then quickly stretched back up. As of now, it has stood above 3320. So the possibility of gold falling again is relatively small. And there is a possibility that gold will further hit Thursday's high of 3360-70. If 3202 to 3435 is regarded as wave a, then 3438 to today's low of 3275 is wave b. So the current rebound from 3275 will go up in wave c. The first suppression position above is 3360-70, the high point of yesterday's rebound. At present, gold has stabilized above 3320, so the next bullish target for gold is to test 3360-70. After the pressure appears, follow the trend and go short.

GOLD (XAUUSD): Support & Resistance Analysis For Next Week
Here is my latest structure analysis for Gold.
Resistance 1: 3260 - 3288 area
Resistance 2: 3350 - 3386 area
Resistance 3: 3482 - 3501 area
Support 1: 3191 - 3210 area
Support 2: 3135 - 3167 area
Support 3: 2956 - 2981 area
Consider these structures for pullback/breakout trading.
❤️Please, support my work with like, thank you!❤️
I am part of Trade Nation's Influencer program and receive a monthly fee for using their TradingView charts in my analysis.
