Gold continued to rise at the opening and broke upward!The current 4-hour chart of gold has formed an upward breakout trend, and it will continue to strengthen next! In the intraday, we focus on the 3200-line long-short watershed. Before gold falls further, gold will maintain a bullish trend. If gold wants to move out of a steady upward trend, it will not fall below the 3222 line during the day. In the short term, we refer to the points above 3222 to arrange long positions! In terms of operation, it is recommended to adjust the thinking, go long on the decline to 3240-3245 or directly chase the rise after breaking through 3270. At present, it is already long at 3243, and there is no more decline to continue long! Identify the long position during the day! On the whole, today's short-term operation of gold is recommended to focus on callbacks and short on rebounds. The short-term focus on the upper side is 3300-3310 resistance, and the short-term focus on the lower side is 3222-3245 support.
USCGC trade ideas

GOLD - single supporting area, holds or not ??#GOLD.. well guys market moved perfect as per our analysis in perveious ideas.
Now market just reached at his single supporting area 3290-91
That is market current supporting area so keep close and keep in mind that we will go for cut n reverse below that.
Good luck
Trade wisely

Gold Price Analysis May 8D1 candlesticks started to show some selling pressure but were still pushed back by buyers at the beginning of today's Asian session
Gold is falling at the end of the Asian session towards 3373. BUY zones are noted at the support zones that buyers are waiting for first 3373-3353-3338
On the opposite side, the sell borders 3405 and 3424 are considered for scalping when the price pushes up. These are data analyzing price zones with strong buying and selling pressure in the past, paying more attention to the current price reaction to have the best trading strategy.

Gold new Update 🧠 Chart Analysis Summary:
Current Price: Around 3,240.610.
Resistance Zone: 3,256 – 3,264 (highlighted in orange).
Support Zone: Around 3,220 (highlighted with a green target).
Chart Pattern: Looks like a possible liquidity grab above before a potential sell-off (indicated by the hand-drawn zig-zag upward move and large downward arrow).
🎯 Trade Setup Suggestion (Short Position):
Entry: Around 3,256 – 3,264 (wait for price to enter this supply/resistance zone).
Stop Loss (SL): Just above 3,270, ideally at 3,273 (above the marked resistance).
Take Profit (TP): Around 3,220, as marked on the chart (support area).
⛳ Summary:
Risk: ~10–15 points.
Reward: ~35–40 points.
Risk-to-Reward: Roughly 1:3, which is favorable.

DeGRAM | GOLD held the support line📊 Technical Analysis
● OANDA:XAUUSD tagged the purple support line at $3 300 inside the green demand zone, then printed a bullish engulfing candle.
● Price is climbing within the rising‑channel mid‑band; reclaiming the black support level $3 360 should propel gold to the upper resistance level near $3 500. Long view void on a close below $3 200.
💡 Fundamental Analysis
● Fed Vice‑Chair Jefferson signalled rates are “sufficiently restrictive” amid cooling CPI base effects, pressuring real yields and the USD.
✨ Summary
Channel‑base rebound plus strong Asian demand and a dovish Fed backdrop support a short‑term long: targets $3 360 → $3 500; invalidate under $3 200.
-------------------
Share your opinion in the comments and support the idea with a like. Thanks for your support!

( Gold ) Bearish Reversal Setup via Head and Shoulders Pattern Gold is showing signs of a potential short-term bearish reversal as a clear Head and Shoulders pattern has formed on the 30-minute chart. The price is testing the neckline near 3394, where a breakdown could trigger a move toward the 3330–3320 support zone.
🔍 Technical Analysis:
Pattern: Classic Head and Shoulders, indicating a possible shift in market structure.
Neckline level: Around 3394 – a break below confirms the pattern.
Indicator. Price is testing the lower boundary of the cloud; a clean break through supports the bearish case.
Volume Observation: Decreasing volume on right shoulder, suggesting buying momentum is fading.
Bearish Targets: Projected move based on pattern structure points toward 3330–3320.
🧠 Fundamental Backdrop:
U.S. Dollar Strength: Recent hawkish Fed comments and stronger-than-expected U.S. economic data are boosting the USD, putting pressure on gold prices.
Interest Rate Outlook: Rising yields are reducing gold’s appeal as a non-yielding asset.
Geopolitical Calm: Lack of fresh geopolitical tensions reduces safe-haven demand temporarily.
Inflation Outlook: Stabilizing inflation may also reduce urgency for gold hedging.
💡 Trade Plan:
Short Entry: 3394 (after neckline break confirmation)
Target Zone: 3330–3320
Stop Loss: Above 3410
Risk-Reward Ratio: ~2:1 depending on final entry/exit points
Must Support Me Share My Idea With Your Firends Mention Your Feed back Comment Section
📌 Note: Wait for confirmation with a strong candle close below the neckline and increased volume before entering the trade. This is not financial advice. Please conduct your own research and manage risk accordingly.

Gold Hits Key Resistance – Will It Break Out or Pull Back? Gold has been moving in a downtrend, and there's a clear descending trendline marked in red. The price has just reached that trendline right around the 3316 level, which also aligns with a horizontal resistance at 3329 — making this a very strong resistance zone.
The price surged from the support area near 3224, breaking through minor resistances until it reached the current level. But what we need to keep an eye on is that momentum indicators like MACD and Stochastic below the chart are starting to show overbought signals, which could mean the price might pull back or at least slow down.
🎯 Expected scenario now:
If the price fails to break above 3329 and can't push through the trendline, we might see a corrective drop toward 3269, and possibly down to 3224 again.
However, if the price breaks above this zone with strong volume and holds above it, we could see a continued bullish move toward 3352 — which looks like an ideal selling zone.

GOLD The Target Is DOWN! SELL!
My dear friends,
My technical analysis for GOLD is below:
The market is trading on 3377.8 pivot level.
Bias - Bearish
Technical Indicators: Both Super Trend & Pivot HL indicate a highly probable Bearish continuation.
Target - 3357.7
Recommended Stop Loss - 3387.7
About Used Indicators:
A pivot point is a technical analysis indicator, or calculations, used to determine the overall trend of the market over different time frames.
Disclosure: I am part of Trade Nation's Influencer program and receive a monthly fee for using their TradingView charts in my analysis.
———————————
WISH YOU ALL LUCK

Start shorting gold and seize the opportunity to make a profit!!Fundamentals:
Focus on Trump and the Fed
Technical aspects:
Gold fell back to around 3253 and then rebounded, and continued to rise to around 3318. The upward momentum in the short term looks particularly strong. According to the current structure, as gold gradually rebounds, off-market buying funds gradually enter the market, pushing gold further up. However, when facing the previous turning point position area of 3325-3335, the market is cautious and it is difficult to break through this area in a short period of time. Therefore, when gold gradually approaches the 3325-3335 area, gold may usher in a wave of retracement in the short term; obviously, the retracement area we can foresee is the 3295-3285 area first.
Trading strategy:
Consider shorting gold in the 3315-3325 area, TP: 3295-3285

Downtrend - will go price return to $3275 GOLD SHORT IDEA | XAUUSD
Price: 3,325
Bias: Bearish
Entry: Near supply zone retest within descending channel
SL: 3,350 | TP: 3,300 → 3,275
🔸 Price respecting bearish channel
🔸 Multiple CHoCH & BOS confirming bearish structure
🔸 IDM zone mitigated with strong rejection
🔸 Expecting continuation to demand zone below
🕐 TF: 15M / Intraday Idea
📊 Strategy: Smart Money Concept (SMC)
#XAUUSD #GOLD #SmartMoney #shortsetup #PriceAction #CHoCH #BOS #TradingViewIdeas

Should we go long on gold when it falls back?From a technical point of view, the daily line has been in negative trend, which is definitely weakening. Whether the market will continue in the future needs to be observed. If it is established, the lower side may be seen at 3260 and 3200, but if the daily line is positive on Friday, it can also turn strong at any time. After all, the current price is just near the middle track of the daily Bollinger, and both rise and fall are possible.
In the 4-hour cycle, we should pay attention to today's closing situation. The price is temporarily around 3300. If it continues to fall, the lower track of Bollinger will open, which may form a unilateral trend, rebound, and Bollinger will close, and it will rise strongly again. Therefore, it is not easy to say the specific rise and fall situation for the time being. It is recommended to observe more to see whether the Asian and European sessions break the new low of 3288, and the upper pressure is 3350 and 3370. In the morning, gold rose first and then fell, and it was quite fierce. It is recommended not to chase orders. Pay attention to the support of 3288 first. If it does not break, try to go long. If it breaks, it will go to the low point of 3260. It is expected that gold will have another wave of rising space on Friday.

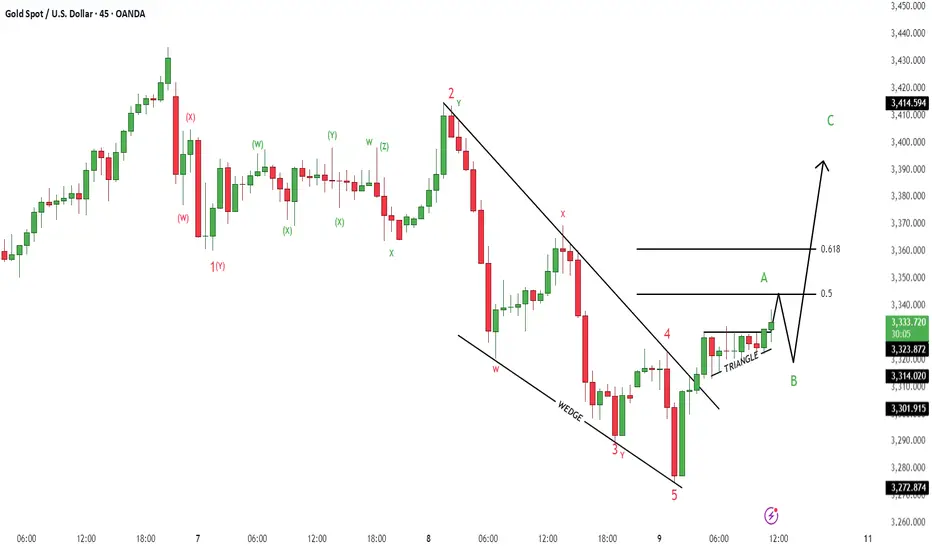
GoldXAUUSD
- Ascending Triangle in Short Time Frame
- Change of Characteristics
- Completed " 12345 " Impulsive Waves
- Falling Wedge as an corrective pattern in Long Time Frame
- Fibonacci Level - 50.00% / 61.80%
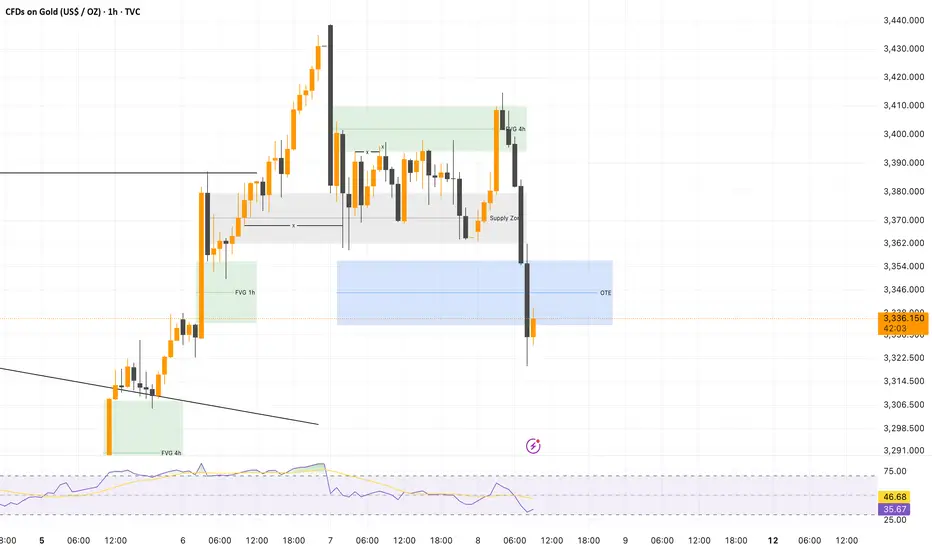
Gold (XAU/USD) Analysis – 1H
🏛 1. Current Market Structure
📉 Gold just made a sharp drop into the OTE zone, breaking through the Supply Zone without much resistance.
🔎 This move suggests a liquidity sweep, possibly targeting deeper levels before any significant recovery.
🌍 2. Bigger Picture Outlook
⚠️ With the 4H FVG now acting as a strong resistance, the market is testing the OTE zone for potential support.
💰 If this zone fails to hold, we could see a deeper correction towards the next major demand area around $3,300.
🔍 3. Key Technical Observations
🟩 4H FVG: Now acting as a supply block, capping recent bullish attempts.
🟦 OTE Zone: Major liquidity area, potential bounce point if buyers step in.
⬜️ Supply Zone: Clearly lost its strength, now likely to act as resistance on any retest.
🎯 4. Short-Term Expectations
📉 Bearish Scenario:
Continuation through the OTE
Deeper liquidity grab toward $3,300
Potential stop hunt before a bullish reversal
📈 Bullish Scenario:
Strong bounce from the OTE
Reclaim of the Supply Zone
Potential push back toward $3,400+ if volume supports it
🔥 5. Upcoming Catalysts
🕰 US Economic Data: Short-term volatility expected.
📊 Volume Confirmation: Critical for validating a bullish recovery.
🔎 Order Flow: Watch for fakeouts and liquidity traps around the OTE.
✅ Conclusion
👉 Gold just tapped a key OTE zone – a make-or-break level for the current structure.
📍 Key levels to watch:
4H FVG (~$3,380 - $3,400)
OTE Zone (~$3,320 - $3,330)
Deeper liquidity areas if the sell-off intensifies
⏳ Stay alert, as the market is likely to remain volatile in the short term.
XAUUSD 15M This chart displays a 15-minute candlestick chart of Gold Spot (XAU/USD) with a clearly marked trade setup. Here's a quick breakdown of what it illustrates:
Buy Zone: Marked in the orange shaded area around the price of $3,372.194 to $3,364.121.
Entry Point: Near the lower edge of the buy zone.
Target: Around $3,393.363, marked as "target successful".
Risk-to-Reward Setup: The green area represents the profit target; the red area below is the stop-loss zone.
Arrow Path: Indicates the anticipated price movement from the buy zone up to the target level.
This is a classic bullish reversal setup after a price drop, aiming for a retracement or continuation upward.
Would you like help analyzing this trade setup or suggestions for improving the strategy?

Gold lower timeframe trade setup M3 trade setup little bit late but still market respecting our levels

Analysis of gold market trendIn terms of short-term gold operation ideas, it is recommended to short on rebounds and long on pullbacks. The short-term focus on the upper side is the 3328-3330 resistance line, and the short-term focus on the lower side is the 3260-3252 support line.

GOLD(XAUUSD) -Weekly Forecast,Technical Analysis & Trading IdeasMidterm forecast:
2772.38 is a major support, while this level is not broken, the Midterm wave will be uptrend.
TVC:GOLD OANDA:XAUUSD
Technical analysis:
A trough is formed in daily chart at 2956.50 on 04/07/2025, so more gains to resistance(s) 3357.00, 3500.00 and more heights is expected.
Take Profits:
2833.00
2879.11
2955.00
3057.40
3160.00
3257.03
3357.00
3500.00
__________________________________________________________________
❤️ If you find this helpful and want more FREE forecasts in TradingView,
. . . . . . . . Hit the 'BOOST' button 👍
. . . . . . . . . . . Drop some feedback in the comments below! (e.g., What did you find most useful? How can we improve?)
🙏 Your support is appreciated!
Now, it's your turn!
Be sure to leave a comment; let us know how you see this opportunity and forecast.
Have a successful week,
ForecastCity Support Team

Gold next targetGold next target 🎯🎯🎯🎯 is very very clear so we can take risk on this trade for the target of 3000 below

Is gold ready for a bearish position??🔶Hello friends.
🔸If we want to check the trading position on the gold chart, according to my swing trading strategy, a suitable bearish position is forming.
🔶Follow me so you don't miss out on more opportunities I've decided to share with you from now on. I love you and I want you to love your money and trade carefully.

XAUUSD (Gold) Continued its Downward trendHere I Created This XAUUSD Chart Analysis
Pair : XAUUSD (Gold)
Timeframe: 1- Hour
Pattern: Resistance Level
Momentum: Bearish/ SELL
Entry Level : SELL 3362
Resistance zone : 3370
Target Will Be : 3325
Disclaimer : This signal is based on personal analysis for learning purposes. Trade at your own risk and always use proper risk management.

Gold (XAU/USD) Analysis – 1H🏛 1. Current Market Structure
📉 Gold is currently consolidating and compressing between a Supply Zone below and a 4H FVG above.
🔎 This setup reflects market indecision, typical ahead of a major event like the FOMC.
🌍 2. Bigger Picture Outlook
⚠️ Powell's speech is scheduled in 2 hours, with very low probability of a rate cut.
💰 This would generally benefit gold, but keep in mind that some of this expectation might have already been priced in yesterday.
🔍 3. Key Technical Observations
🟩 4H FVG: Liquidity zone just above the current price, potential target if the price breaks upward.
🟫 Supply Zone: Key structural support, tested multiple times in the past hours.
📐 Classic compression pattern, often leading to a major breakout, but no clear direction confirmed yet.
🎯 4. Short-Term Expectations
📉 Bearish Scenario:
Rejection from the 4H FVG
Drop back to the Supply Zone
Potential liquidity sweep below $3,350
📈 Bullish Scenario:
Clear break above the 4H FVG
Potential rally towards $3,500 if the FED surprises or stop-losses get hunted.
🔥 5. Upcoming Catalysts
🕰 FOMC in 2 hours: Main short-term risk factor.
💸 Powell + Rates: If rates remain unchanged with a cautious tone, gold could break out to the upside.
🔎 Immediate volume and reaction will be critical to confirm a true breakout.
✅ Conclusion
👉 Caution is advised ahead of the FOMC. The market seems ready for a sharp move in either direction, but the outcome will heavily depend on Powell's tone.
📍 Key levels to watch:
4H FVG (~$3,420)
Supply Zone (~$3,370)
Psychological $3,500 level if a bullish surprise unfolds.

Gold 100% Profit SignalGold rose strongly again today as a safe-haven, breaking the volatility and rising to the highest point of 3328. However, gold has basically not pulled back, so it is very likely that the safe-haven sentiment will be released directly, and then gold will start to adjust again. Therefore, it is not suitable to chase it at this position now. It is better to wait patiently for the opportunity to fall back. Gold may rise and fall at any time. Go short directly at 3328 in the US market!
The 4-hour moving average of gold began to turn, so the unilateral decline of gold temporarily came to an end. However, the rise of gold has reached the key resistance area in the early stage, which is the starting point of the early stage near 3330. It is obviously not appropriate to chase more at this position, so the short-term may begin to adjust, and the gold US market will be shorted near 3300. The market is changing rapidly. If gold breaks upward and does not step back, there is no opportunity to go long, so there is no need to chase more gold, and it is better to go short first to see the decline and adjustment.
Gold strategy: Suggest short at 3325-28, stop loss at 3337, target at 3308-3295-3280

GOLD SENDS CLEAR BEARISH SIGNALS|SHORT
GOLD SIGNAL
Trade Direction: short
Entry Level: 3,270.07
Target Level: 3,197.87
Stop Loss: 3,317.86
RISK PROFILE
Risk level: medium
Suggested risk: 1%
Timeframe: 2h
Disclosure: I am part of Trade Nation's Influencer program and receive a monthly fee for using their TradingView charts in my analysis.
✅LIKE AND COMMENT MY IDEAS✅
