Gold 100% Profit SignalGold rose strongly again today as a safe-haven, breaking the volatility and rising to the highest point of 3328. However, gold has basically not pulled back, so it is very likely that the safe-haven sentiment will be released directly, and then gold will start to adjust again. Therefore, it is not suitable to chase it at this position now. It is better to wait patiently for the opportunity to fall back. Gold may rise and fall at any time. Go short directly at 3328 in the US market!
The 4-hour moving average of gold began to turn, so the unilateral decline of gold temporarily came to an end. However, the rise of gold has reached the key resistance area in the early stage, which is the starting point of the early stage near 3330. It is obviously not appropriate to chase more at this position, so the short-term may begin to adjust, and the gold US market will be shorted near 3300. The market is changing rapidly. If gold breaks upward and does not step back, there is no opportunity to go long, so there is no need to chase more gold, and it is better to go short first to see the decline and adjustment.
Gold strategy: Suggest short at 3325-28, stop loss at 3337, target at 3308-3295-3280
USCGC trade ideas

GOLD SENDS CLEAR BEARISH SIGNALS|SHORT
GOLD SIGNAL
Trade Direction: short
Entry Level: 3,270.07
Target Level: 3,197.87
Stop Loss: 3,317.86
RISK PROFILE
Risk level: medium
Suggested risk: 1%
Timeframe: 2h
Disclosure: I am part of Trade Nation's Influencer program and receive a monthly fee for using their TradingView charts in my analysis.
✅LIKE AND COMMENT MY IDEAS✅

Gold Technical Analysis, May 9📊Gold stabilized and rebounded after a rapid decline in early trading today. The price broke through the 3324 line, which opened in the morning, and the technical pattern turned to a bullish pattern. Usually in a weak market, the price will not rebound sharply, but this bottoming out and rebound has obviously swallowed up the downward momentum, indicating that the short-term upward trend is expected to continue.
📊From the weekly structure, this week showed a "wide range of fluctuations" rhythm. It rose continuously on Monday and Tuesday, and fell sharply on Wednesday and Thursday, and continued to fluctuate violently on Friday. Although the market has ups and downs, it is still running in the oscillation range as a whole, with obvious characteristics of washing the market, and it is more likely to be a potential adjustment before the subsequent surge.
📊From the hourly line, 3324 is the opening of this round of decline. After being effectively broken, the price returned to the bull-dominated range, indicating that the current trend is not weak. If the US market can continue to hold the support of the morning low of 3315, the short-term bullish logic will be further established, and gold is expected to gradually rise to the 3350-3360 area.
📊For the current trading strategy, it is recommended that investors avoid chasing ups and downs in the context of large range fluctuations. It is safer to adopt the method of buying on dips and gradually increasing positions. If the price falls back to 3280 or below, you can consider buying in batches and use 3310 as a short-term stop loss defense.
🔴Resistance level: 3360-3370
🟢Support level 1: 3310-3315
🟢Support level 2: 3280
✅The market has shown an obvious long-short double-kill pattern this week, with the overall trend dominated by Trump-related news, disrupting the existing rhythm of technical analysis. Despite this, we still insist on using a smaller stop loss to control risks and keep losses to a minimum as much as possible. The overall performance is still significantly better than most individual traders in the market.
✅This weekend, Trump will start a new round of negotiations with China on trade tariffs, and the tariff dispute that has lasted for more than a month is expected to come to an end. As the impact of the news gradually weakens, the market is expected to return to the rhythm dominated by the technical side, which will bring us more predictable trading opportunities.
✅We have reason to believe that with a clear market rhythm, we will have more opportunities to further achieve stable profits next week🤝

GOLD - Near to CUT n REVERSE Area? what's next??#GOLD. market perfectly bounced from our area and now market just above his current suportinga area that is around 3382-87
keep close if market holds then further bounce on table.
NOTE: we will go for cut n reverse below our region.
good luck
trade wisely

Gold 3386 is under pressure, don't worry
Gold rose rapidly today. At present, the price of gold has reached the 3386 line. There will be pressure to fill the gap and choose to bear the pressure.
Now that gold is adjusting and falling at 3386, don't rush to gamble and enter the market. Wait for time + point + harmonious position. The market will find support in an effective time. Now the effective support point of gold is about 3346/36. The price fluctuates violently. It is recommended to take a stop loss in time after entering the market to avoid a sudden accident in the market and cause unnecessary losses. Today's rising cycle can be seen in the 3400/3420 range. On the downside today, if the market changes and recovers the opening price, just wait and see. This kind of market is unlikely to occur, but if it occurs, you have to wait and see and don't be stubborn in your thoughts.
Market contradictions and potential risks:
Fed policy expectations: The market's probability of a rate cut in June has dropped to 37%. If the Fed releases hawkish signals this week, it may suppress gold prices.
ETF holdings diverge: Despite the rise in gold prices, the world's largest gold ETF (SPDR) holdings decreased by 4.87 tons, reflecting that some institutions sold off their holdings at high prices.
Geopolitical variables:
Middle East conflict escalates: If the friction between Iran and Israel intensifies, gold may hit $3,450; on the contrary, if the situation eases, the gold price may fall back to $3,300

Bank Holiday Set up🚨 High Risk Alert!
Seeing unusual volume today — already 50 pips in play from this zone. 👀
Targeting that bullish order block for a potential full reversal into higher highs & premium sell zone. 🌀
Waiting on extra confluences before pulling the trigger on a buy setup.
Let’s see what the New York open brings! 🗽📈
#Forex #TradingUpdate #MarketWatch #NYOpen #PriceAction

Gold Short I think gold is heading again toward 3350$ region where i am willing to add on to short positions.
My next short term area for gold is 3295$ .
This is another great R:R setup.

Sub 3k ond Gold soon?Gold continues to get rejected off inverted FvGs, all while grinding inside the turning area—and from where I’m standing, the top looks locked in.
We’re now heading straight down the pink ABC structure, with targets lining up at $3,000 and lower. The first major resistance on this descent is marked in white—a critical level to watch.
If we see a strong bullish bounce there, perfect—that’s our chance to scale into a bigger short position with precision.
The tide’s turning. Don’t fight the flow.

Gold's safe-haven stimulus led to a strong rise!In terms of short-term gold operation ideas, it is recommended to short on rebounds and long on pullbacks. The short-term focus on the upper side is the 3328-3330 resistance line, and the short-term focus on the lower side is the 3260-3252 support line.

Gold price fell after a high? Trend reversal?Analysis of Asian morning session:
The recent high point of gold price reached 3437 US dollars, and it fell sharply after the Asian morning session opened. The gold market opened after the Asian holiday, and the bulls rose strongly; the Asian morning session was volatile, and the current lowest reached around 3360, a drop of 77 US dollars.
Then it adjusted back and reached a high of around 3404; this position can be used as an important resistance level at the opening time of the Asian session. Between the sharp rise in the morning of the past two days, and the upward continuity of the European and American sessions, coupled with the recent continuous rise and fall, the rapid fall in the Asian morning session.
Quaid believes that in this continuous upward pattern, once there is a sharp fall, it is also likely to be a signal of insufficient bullish power in the short term; then we need to consider whether the bears can reverse, and the current upper pressure position is at 3395 US dollars, and the lower support level is at 3360 US dollars, which is equivalent to the previous top and bottom conversion.
Operation strategy:
Short when the price returns to 3390, take profit at 3370-3360, stop loss at 3400.
Good luck to everyone.

GOLD-NEUTRAL SELL strategy 3 hourly chart - GANN GOLD has recovered sharply but somehow it feels we may see a lower test once again. the short-term picture suggest upward pressure still.
Strategy SELL @ $ 3,3380 - 3,425 and take profit near $ 3,267 for now.

XAUUSD 15 MINUTESThis chart shows a breakout from a descending channel pattern on the Gold Spot price (XAU/USD) on the 15-minute timeframe. Here's what the chart indicates:
Descending channel: Price was moving within a downward-sloping channel.
Breakout: The price broke above the upper trendline of the channel, signaling a potential reversal or continuation to the upside.
Long position: A long trade was taken right after the breakout, as shown by the green box (profit target area) and red box (stop-loss area).
Target hit: The arrow and label "target successful" indicate that the price reached the trader’s profit target near 3,420.853.
This is a classic breakout trade setup, confirming a bullish move after a short-term downtrend.
Would you like help analyzing the next potential move or finding similar patterns?

Gold is in line with the uptrend
After yesterday's sharp rise from 3238, spot gold continued to climb in the Asian market on Tuesday. The price of gold has now broken through the highest level of 3386 US dollars per ounce, and the daily increase is nearly 28 US dollars. At present, the price of gold remains close to the new record, and the rise is far from over. The global trade war has caused market concerns and continued to push the price of gold to new highs. Gold has become an asset for a new round of investment boom!
The market boom is coming, and the gold bulls are coming?
Banking giant Goldman Sachs released a bullish forecast report on gold, saying that if a recession becomes a reality, the gold price target will reach 3880 US dollars per ounce by the end of 2025. The forecast is based on the expectation that concerns about a recession will accelerate the inflow of funds into gold exchange-traded funds (ETFs), thereby pushing up gold prices.
In addition, Goldman Sachs warned that if the Federal Reserve loses its independence, the price of gold may soar to 4500 US dollars per ounce.
What do you think of today's gold trend!
Looking back at the current gold and silver, from the market point of view, the gold price trend has been stabilizing above the middle track, and the cycle bulls continue to line up. From the indicator point of view, the middle track has been hooking upward, and there is still room for an upward rebound in the short term. In addition, gold started from 3322 last week, and directly rose from 3322 to 3387. Now it is around 3367. So there is a point to pay attention to today, that is, the position of the middle track of 3334. It is still difficult to say whether it can be stepped back.
Don't expect a deep callback. The only difference between the oscillating market and the unilateral market is that the oscillation will come back, while the unilateral market will not. This is why we always emphasize the need to bring a good stop loss. In terms of the cycle rhythm, we have been participating in the cycle of time and space last week. At present, we can still participate in this pattern. There is one opportunity in the European and US markets. We will start at this time point during the day!
Gold: More near 3350, defend 40, and target the resistance of 3385-90! If it breaks below, wait for the two support levels of 3334-20 before considering!

XAUUSD 15 MINUTESThis chart illustrates a short-term bearish trading setup for Gold (XAU/USD) on a 15-minute timeframe. The trader has identified:
A "SELL ZONE" around 3,380–3,390, indicating a potential reversal area.
LEVEL 1 (~3,370) and LEVEL 2 (~3,355) as possible support areas or price reaction zones.
A final target labeled "TAEGET SUCCESSFUL" (likely meant to be “TARGET SUCCESSFUL”) around 3,325.
The projected price action (marked by the purple line) suggests a short position from the sell zone aiming to hit all three levels, with the ultimate target being around 3,325.
Would you like help setting up a trading plan based on this setup or backtesting this strategy?

GOLD: Short Signal Explained
GOLD
- Classic bearish pattern
- Our team expects retracement
SUGGESTED TRADE:
Swing Trade
Sell GOLD
Entry - 3311.9
Stop - 3324.4
Take - 3287.1
Our Risk - 1%
Start protection of your profits from lower levels
Disclosure: I am part of Trade Nation's Influencer program and receive a monthly fee for using their TradingView charts in my analysis.
❤️ Please, support our work with like & comment! ❤️

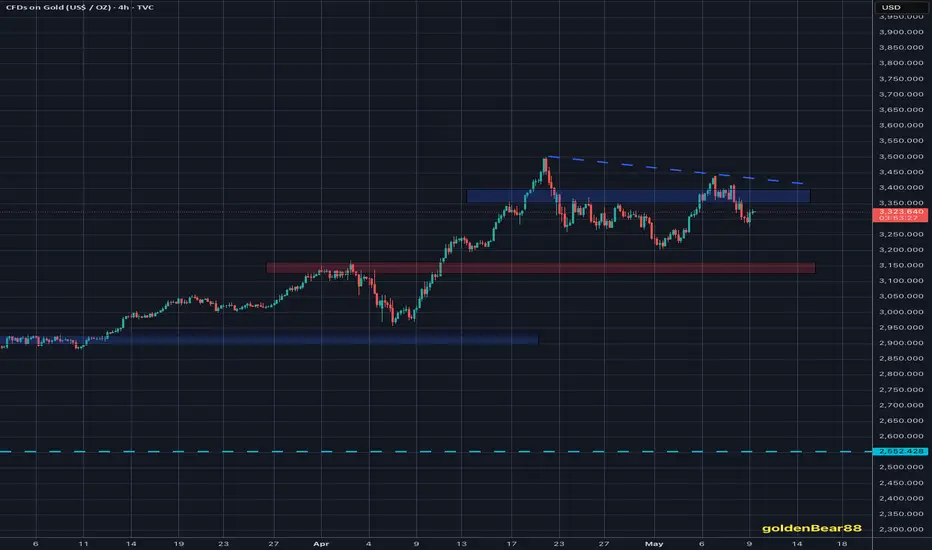
GOLD/USD suggesting a potential short trade with the target The chart shows a significant uptrend starting around mid-March, peaking near 3,374.74, followed by a sharp decline towards 3,171.35, marked as the "target. *: A support zone is highlighted around 3,005.68 to 3,017.01 (green), and a resistance zone around 3,329.79 to 3,346.15 (red).The right side shows price levels, with the current price around 3,171.35, aligning with the target after the drop

Gold delivering excellent Trading opportunitiesTechnical analysis: Gold is consolidating on Hourly 4 chart after it entered my expected #3,342.80 - #3,322.80 Neutral Rectangle zone with #3,342.80 as an possible stop and local High’s. Upper maximum extension can reach #3,352.80 benchmark / Hourly 4 chart’s extension if Resistance breaks. Both ways, I doubt that Neutral candles will last for long as Gold will be ready for another Buying or Selling sequence, where another slide might be in the aftertime. It is important to note that DX found the Support and engaged the spiral recovery (# +0.81%) which can add Selling pressure on Gold. I will use this configuration and observing market closing (closing below #3,312.80 confirms the downtrend extension), where Gold is Technically ready for #3,300.80 - #3,252.80 benchmark test. DX however remains merely Neutral on bigger charts however near Lower High’s peak, adding Volatility on Gold counterbalancing mixed values on Yields. This gives me the impression that Gold has at the moment more probabilities to a Short-term uptrend than break below the Support zone. Gold continues to be contained within parabolic uptrend however isolated within Neutral range for the last #1 - #2 consecutive sessions. Daily chart is on (# +0.58%) switch and represents an cautious fractal. Keep in mind that the Medium-term pattern on Daily chart is an Ascending Channel and Gold is on its Higher High’s decimal zone with Lower levels being a potential Lower High’s Target. Total Neutrality and balance between the Support and Resistance lines is consolidation phase of next major move ahead.
My position: I have expected #3,300.80 benchmark touch throughout yesterday's session where I engaged Selling order on #3,345.80 (entry point). Due news outcome, #3,352.80 was tested which triggered my Stop-loss and left me without any orders. Later on, Gold dipped towards #3,300.80 benchmark (what I did expect) as I managed to re-Sell Gold on #3,322.80 and close the order on #3,307.80. I am without any orders as Gold is Trading within Neutral Rectangle. I will Trade the break-out of values I explained above.
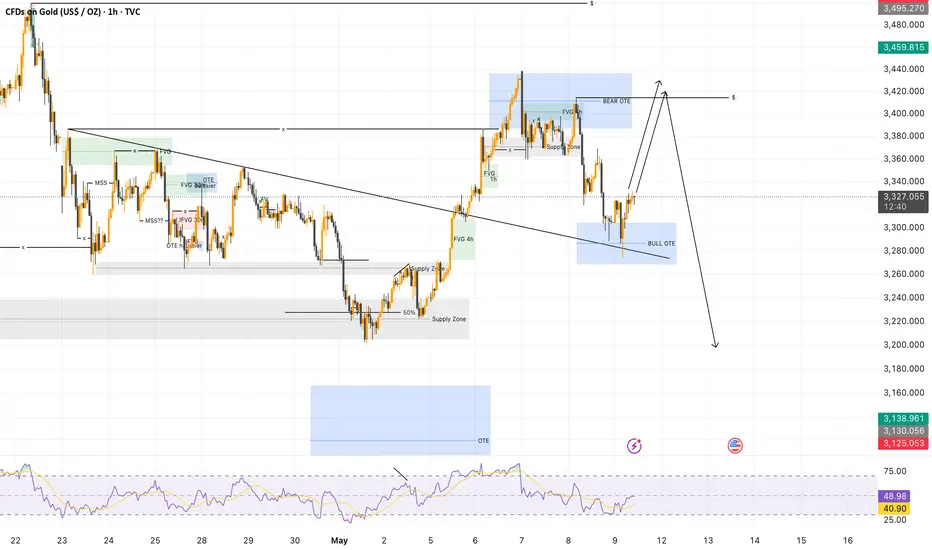
Gold (XAU/USD) Analysis – 1H🏛 1. Current Market Structure
📈 After a strong upward impulse, gold has now pulled back into a Bull OTE zone, aligned with a key trendline acting as a dynamic support.
📐 This setup could indicate a potential bullish rebound, especially if the market views this pullback as a healthy retracement before a larger continuation.
🌍 2. Bigger Picture Outlook
🔍 The recent rejection at the Bear OTE highlights the presence of strong supply at higher levels.
⚠️ However, the current bounce from the Bull OTE could either be the start of a larger bullish leg targeting the Bear OTE again – or just a technical bounce before a deeper correction, especially if the FED hints at rate cuts in June or July.
🔍 3. Key Technical Observations
🟦 Bear OTE: Clear rejection, confirming this as a key resistance for now.
🟦 Bull OTE: Providing initial support, coupled with a trendline bounce, adding confluence for a potential move up.
📐 Trendline Support: Critical for maintaining the current bullish structure, a break here could signal a deeper retracement.
🎯 4. Short-Term Expectations
📉 Bearish Scenario:
Rejection from the Bull OTE
Break below the trendline
Deeper pullback towards the Supply Zone or even the 50% retracement level
📈 Bullish Scenario:
Clean break above the Bull OTE
Retest of the Bear OTE (~$3,500)
Possible breakout if volume supports the move
🔥 5. Upcoming Catalysts
🕰 FED rate decision in June/July – potential rate cuts could shift sentiment.
💰 Inflation and economic data: Key drivers for gold’s short-term direction.
🔎 Volume and order flow: Crucial to confirm any true breakout.
✅ Conclusion
👉 Gold is at a critical junction, testing a Bull OTE with a supporting trendline – a key moment for determining the next major leg.
📍 Key levels to watch:
Bear OTE (~$3,500)
Bull OTE (~$3,300 - $3,320)
Trendline support – a break here could invalidate the bullish thesis
⏳ As always, stay alert for fakeouts and liquidity grabs around these levels.
Pay attention to 3360 and go short if it does not break🗞News side:
1. China and the United States hold talks on trade issues
2. India-Pakistan conflict escalates again
3. Geopolitical risks
📈Technical aspects:
At present, gold has fallen below the trend line support. In the short term, we should focus on the battle for 3360. This point is not only the previous support-to-resistance level, but also the key signal for judging the trend reversal. If it cannot hold on to this position, the short trend will continue; if it recovers effectively, it may return to above 3400. Before losing the defensive line (the last starting and falling point) 3360-3362, the bears will still have the upper hand. It just so happens that the 4H lifeline is also in the 3360-3362 area. If the suppression is successful, the price will enter the 3362-3284 area from the lifeline to the lower track.
The rebound layout of the US market operation is short-selling, with the target at 3340-3330, and further support at 3310-3300.
If you agree with this view, or have a better idea, please leave a message in the comment area. I look forward to hearing different voices.
TVC:GOLD FOREXCOM:XAUUSD FXOPEN:XAUUSD FX:XAUUSD OANDA:XAUUSD
Continues Bullish TrendStill focus on buy for gold and possibly retest previous ATH or creating a new ATH from current lvl price 3400<>

Gold Intraday Trading Plan 5/8/2025Gold was rejected yesterday at 3430 and went down all the way to 3360. It will be interesting to see the close of the 4hrly and 8hrly candle. If we see a rejection from 3350-3360. We may have another bull run.
If 3350-3360 is held, I will buy toward 3430 or even 3500. Otherwise, I will wait for clearer direction.

Gold Trading Strategy, May 7-8📊From the hourly level, gold formed a double-needle bottoming pattern near 3360 during the early morning correction, showing strong short-term support. At the same time, 3350, as the low point of yesterday's Asian session correction, also constitutes an important support area at present, which needs to be focused on in the short term.
📊Before the announcement of the Fed's interest rate decision, market sentiment is relatively cautious, and gold is expected to continue to fluctuate at a high level in the range of 3350 to 3400. In terms of trading strategy, you can continue to maintain the idea of selling high and buying low in the range, that is, try to short with a light position near 3400, and try short-term long orders when it falls back to 3350.
📊If gold breaks below the 3350 support line, it means that the short-term structure will weaken. It is recommended to follow the trend and go short. The further downward target can focus on the 3290 line, which is an important platform support area in the early stage.
✅Short-term Trading Strategy:
🔰Within the range (3350-3400): mainly sell high and buy low;
🔰If the support of 3350 is broken: follow the trend and go short, the target is around 3290;
🔴Upper resistance level: 3400-3410;
🟢Lower support level: 3350, 3290.
✅Trading strategies are time-sensitive. We will provide members with real-time and accurate trading strategies based on market changes. Short-term trading requires flexibility, timely adjustment of positions, strict risk control, and ensuring that you are not affected by large fluctuations.

XAUUSD – 30m Buy Setup | Fair Value Gap + Fib + Liquidity Sweep📈 GOLD LONG – May 6, 2025 | Smart Money Trade Setup
We're seeing an incredibly clean bullish setup form on Gold (XAUUSD) with textbook Smart Money Confluences:
🔍 KEY CONFLUENCES:
🟥 FVG (Fair Value Gap): Price tapped the FVG perfectly and respected it
📐 Fib Zone: Confluence of 70.5–79% retracement with demand reaction
💧 Liquidity Grab: Below short-term equal lows before bullish push
📉 Divergence: Internal lower highs vs external equal lows = engineered setup
🧱 Structure: Short-term bullish BOS (Break of Structure) above recent swing
📊 Trade Plan (Long Setup):
🎯 Entry: ~$3,325.6 (FVG zone base)
⛑️ SL: Below FVG at ~$3,323
🚀 TP: $3,404 zone (clean inefficiency magnet)
💥 RRR: 1:5+ sniper trade
🧠 Execution Notes:
Wait for LTF bullish structure shift confirmation (5m BOS)
Add confluence with volume divergence or SMT (Smart Money Toolkits)
Manage the trade once it reaches 3,350 zone
Break-even and partials at mid-Fib zone (around 3,352–3,360)
💬 Chart Ninja Wisdom:
"Price doesn’t lie—liquidity does. When price leaves a gap, Smart Money’s coming back for it."
📌 SETUP OVERVIEW:
Timeframe: 30m
Entry Type: Limit (FVG tap zone)
Bias: Bullish
Target: Clean inefficiency above
Type: High-probability setup with strong RR and structure support
💥 Tap 💾 to save this sniper setup.
📣 Tag your gold-trading crew & get ready for that pump!
📆 Watch how this plays out live—discipline > hype.
