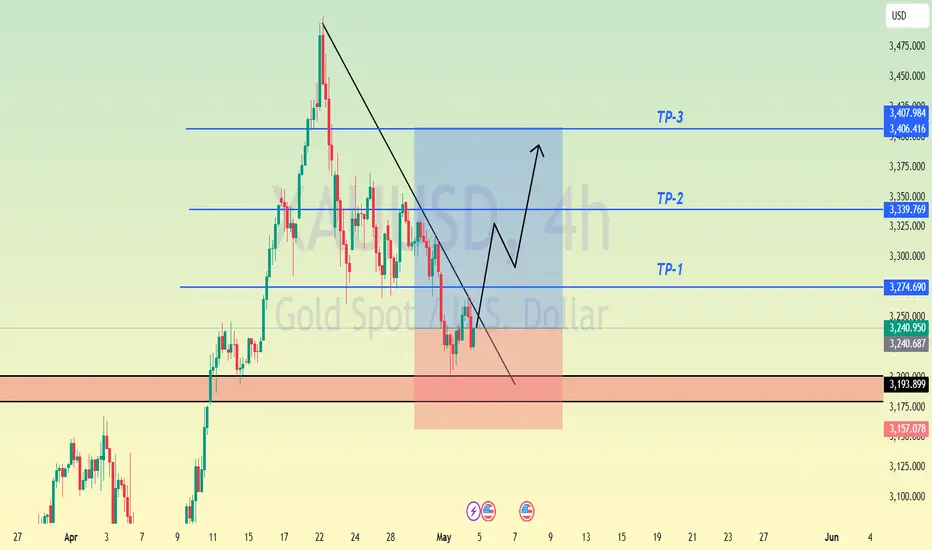
XAUUSD Update - 3rd week May 2025Still following into the major trend...Gold has a high probality to make a new ATH above 3500.
Good Luck !
USCGC trade ideas

XAUUSD Today's Trend Analysis SignalGold has recently broken out of a falling wedge pattern, which is a classic bullish reversal signal, which is also confirmed by a clear bullish divergence near $3,200. After hitting the target level of the falling wedge pattern, the price rebounded sharply and is now forming an ascending channel.
Currently, the price is approaching a key resistance level near $3,280-3,290. If the bulls succeed in breaking through this level, we may see the price rebound to the next major resistance level of $3,320 and above.
Confirmation of Falling Wedge Breakout
Bullish divergence near the bottom indicates a shift in momentum
Price follows an ascending channel structure
Bullish Target: $3,290-3,320
Bearish Target and Long Entry Point: $3,240 Area
Outlook: The bullish bias remains valid as long as the price is above the $3,240-3,250 support level. Watch for the price to break through the resistance level to continue further upward momentum.

Gold is once again experiencing its extreme take-off trend!📌Fundamentals:
1. There are signs of escalation in the India-Pakistan conflict
2. The Fed's interest rate decision dominates this week's market
3. The international trade situation disturbs market sentiment
4. Market sentiment and capital flows
📊Technical aspects:
The 4-hour cycle still needs a wave of strength, and it needs to go out of a wave of big rises before it can open the Bollinger upper track to form an absolute unilateral strength. Therefore, although it is temporarily bullish, there is also a certain possibility of adjustment. The current 4-hour cycle support is around 3310, and the small cycle performance support is around 3350, so don't chase more.
🎯Practical strategy:
Gold pulls back to around 3365-3375 to go long, and the target is around 3400-3420.

XAUUSD update Plan B after FOMCIf 3360 - 3350 level support broken, it could be make a retracement with 62% fibonaci.
Goodluck !

Gold range shock , Both long and short have a chance!📌Fundamentals:
1. There are signs of escalation in the India-Pakistan conflict
2. The US-Houthi ceasefire agreement
3. The Fed's interest rate decision dominates this week's market
4. The international trade situation disturbs market sentiment
5. Market sentiment and capital flows
📊Technical aspects:
The market came out in the Asian session. It stalled again later. We are used to seeing fluctuations of hundreds of points. A fluctuation of more than ten or twenty points a day is the same as no fluctuation. At present, the market is temporarily maintained in the range of 3400-3360, and there is not much fluctuation. At present, let's see where the market breaks through. If it retreats to around 3360, follow up with long orders. If it rebounds to around 3400, follow up with short orders.

Gold: High - level Oscillation, Short - term Adjustment & StrateFrom the perspective of the daily chart trend of gold, after two consecutive days of strong rebounds, the price has pulled back, indicating significant selling pressure at higher levels and a need for a technical adjustment in the short term. Currently, the price has dropped back to around $3,400, which is the support area of the previously broken gap. If this level is breached, it may further test the $3,350 level. In terms of technical indicators, the RSI has retreated from the overbought zone, and the MACD red bars are shortening with signs of a potential death cross, suggesting a weakening of momentum. Additionally, the 5-day moving average has started to turn downward. If gold fails to regain the $3,440 level, it will confirm the formation of a short-term top.
Overall, gold is currently in a high-level consolidation phase. Without the impetus of new safe-haven factors, the adjustment is likely to continue. Despite the intensification of geopolitical risks, the current financial market is more inclined to focus on changes in global trade sentiment, which has diminished the appeal of traditional safe-haven assets such as gold. The long-term support for gold remains intact, but in the short term, it may be affected by the strength of the US dollar and the restoration of risk appetite.
For today's short-term trading of gold, the recommended strategy is to go long on pullbacks and go short on rebounds. In the short term, key resistance levels to watch are in the range of $3,405 - $3,430, and key support levels are in the range of $3,360 - $3,350.
Investment itself is not risky; it is only when investment is out of control that risks occur. When trading, always remember not to act on impulse. I will share trading signals every day. All the signals have been accurate without any mistakes for a whole month. No matter what gains or losses you've had in the past, with my help, you have the hope of achieving a breakthrough in your investment.
Thinking and practical skills for winning in the 3360-3400 rangeAffected by the news, gold fell sharply at the opening. Successfully won. According to the trading strategy, we gave gold a wide range of fluctuations in the 3360-3400 range, which will not change much. It can be operated within the range during the day. The trading strategy analysis is accurate, and the key points are accurately grasped to enter the market, which brought us good returns during the day. The short-term rhythm is accurately grasped! Brothers who followed the trading plan should have also made very good profits. 🍻🍻🍻

Gold's decline under pressure is in line with expectations!From the perspective of the gold hourly line, the morning closed with a full sun, effectively breaking through the resistance of yesterday's 3360-3397 box. Therefore, it is definitely necessary to try to confirm the continued bullish trend after a pullback. The continuous diving in the afternoon refreshed the intraday low, which can only mean that the market is washing out, and all the long and short positions are driven out, and then brewing again; If the European session remains weak below 3350, there may be some room for further decline tonight, but the continuity may not be great, and it is easy to stabilize and bottom out and pull up; the current support is 3320, 3315, and 3305. If a stabilization signal is touched around 22:00, it is bullish. I personally think that there is limited space below 3300, and resistance is 3360, 3365, and 3370. If a pressure signal is touched around 20:00, it will fall back first; if it returns to above 3370, the trend will gradually become stronger, and it will be treated as a wide range of fluctuations for the time being;
On the whole, today's short-term operation strategy for gold is to short on rebounds and long on pullbacks. The short-term focus on the upper side is 3370-3375 resistance, and the short-term focus on the lower side is 3280-3290 support. Friends must keep up with the rhythm.
Short order strategy:
Strategy 1: Short 20% of the gold position in batches when it rebounds to around 3365-3370, stop loss 10 points, target around 3330-3305, and look at 3290 if it breaks;
Long order strategy:
Strategy 2: Long 20% of the gold position in batches when it pulls back to around 3285-3290, stop loss 10 points, target around 3310-3330, and look at 3350 if it breaks;

Is the rise in gold a rebound or a restart of the upward trend?News Interpretation: US President Trump announced on Sunday that he plans to impose a 100% tariff on films produced overseas, marking the first time that his restrictive trade policy on US imports has been extended to the entertainment industry. This has once again ignited investors' concerns about the potential consequences of a global trade war. On Monday, local time, Trump signed an order on biomedical research, hoping to take the opportunity to promote the US pharmaceutical manufacturing industry. Trump also announced that tariff measures on pharmaceutical products will be announced in the next two weeks. Gold is often seen as a safe haven tool in uncertainty and performs well in a low interest rate environment. Gold prices have soared 26.3% so far this year and have set new historical highs many times.
Gold trend analysis: Gold rose strongly yesterday, and the Asian session pulled up slightly and then fluctuated slowly upward. The European session gold price broke through the support and suppression conversion position we analyzed, and broke through the two key defense positions of 3300 and 3330 in succession. Today, the gold price opened with a single positive rise to around 3385 and was blocked. It is currently falling back at a high level. As of the time of posting, the price is around 3366. Our original idea was to focus on the support near 3162, the 618 position, of the last upward correction of gold prices before 3500. However, the rally on Monday broke through our defense level and our bearish view failed. Now that gold prices have returned to an upward trend, the structure needs to be re-analyzed.
In general, the gold price has risen in the past two days, and our spot market has maintained a steady rhythm. 3386 is a short-term suppression level. If it breaks below 3350 in the Asian session, the steady idea is to wait for a rebound and then short to see the downward trend. Focus on the support of 3272 below.

Gold might be busy with wave b for abc correction. If we only pullback to fib level between 50 - 68%, and get bearish confirmation we might start with leg C. But is also possible that if we go past ATH we might be busy with Wave 5.

Gold continued to rise at the opening and broke upward!At present, the 4-hour chart of gold has formed an upward breakout trend. The decline may be over, and it will continue to strengthen! In the intraday, we focus on the 3200-line long-short watershed. Before gold falls further, gold will maintain a bullish trend. In the day, we focus on the recent starting point of 3222 support. If gold wants to go out of a steady upward trend, it will not fall below 3222 in the day. In the short term, we refer to the points above 3222 to arrange long positions! Therefore, in terms of operation, it is recommended to adjust the thinking, go long if it falls back to 3240-3245, or directly chase the rise after breaking through 3270. At present, it has been long at 3243 in the early trading. If there is no more decline, continue to go long! Identify the bulls during the day! On the whole, it is recommended to do more on the callback and short on the rebound in the short-term operation of gold. Focus on the resistance of 3300-3310 in the upper short term, and focus on the support of 3222-3245 in the lower short term.

Gold Will be Bullish from a Historic Support LevelHello Traders
In This Chart GOLD HOURLY Forex Forecast By FOREX PLANET
today Gold analysis 👆
🟢This Chart includes_ (GOLD market update)
🟢What is The Next Opportunity on GOLD Market
🟢how to Enter to the Valid Entry With Assurance Profit
This CHART is For Trader's that Want to Improve Their Technical Analysis Skills and Their Trading By Understanding How To Analyze The Market Using Multiple Timeframes and Understanding The Bigger Picture on the Charts
Hellena | GOLD (4H): SHORT to 38.2%-50% Fibo lvl 3228.Colleagues, last week we got a stoploss, but I still believe that we should expect a correction in wave “2”. We will try to catch this movement this week.
I believe that the price will correct to the area of Fibonacci 38.2% - 50% levels (3228.41).
Perhaps the price will slightly renew the maximum of wave “1”, reaching the level of 3438. In this case I recommend to work with pending limit sell orders.
And some data:
The prevalence of bulls according to CME reports additionally increased by 13%.
The 23% increase in market volume, meanwhile, indicates a likely strong momentum pattern during the trading week.
Despite the 13% increase in buyers, selling patterns towards the balance level of the week (3200.00) are recommended for the current trading week.
Manage your capital correctly and competently! Only enter trades based on reliable patterns!

Gold intraday trading strategyGold operation strategy:
1. Go short at 3270-75 when gold rebounds, and cover short at 3388-93 when it rebounds, stop loss at 3397, target at 3230-3235, and continue to hold if it breaks;
2. Go long at 3220-3225 when gold falls back, stop loss at 3214, target at 3265-70, and continue to hold if it breaks;

Today's rebound continues to be short!The logic behind the current rise and fall of gold has changed. The main factors for the previous crazy rise in gold and the decline at 3,500 were the tariff war, which has gradually turned from tension to relaxation. The latest news shows that the two sides are trying to contact each other to prepare for the next round of negotiations.
Later, we should focus on the Federal Reserve. Trump previously asked the Federal Reserve to cut interest rates to reduce the impact of the tariff war on the economy. Powell's resistance once made Trump want to change the chairman of the Federal Reserve. The big non-agricultural data on Friday was better than expected, which means that the time for the Federal Reserve to cut interest rates will be delayed, which is bad for the gold market. Therefore, gold may fall further at the beginning of next week.
On the other hand, after the world's largest gold ETF reduced its positions significantly since the peak of 3,500 on April 22, it has continued to reduce its positions slightly during this period, and there has been no obvious increase in positions, which reflects that gold has further bottoming out.
The daily line on Friday closed with a cross K, following three consecutive negatives. From a technical point of view, it is either a signal of continued decline or a reversal. Combined with the news data and the overall trend, the probability of continued decline is very high.
On the one hand, the rebound strength on the hourly and 4-hour charts is not strong, and the upward continuity is poor. The 100-day moving average is always under pressure to fall, and the trend is still bearish.
On the other hand, the adjustment on the daily and weekly lines has not yet ended, and the indicators show that there is still further decline. Next week, we should focus on the 618 golden section position of 3160. As for whether it can be the bottom position, in addition to the price point, it is also necessary to consider the K-line pattern comprehensively. We will talk about it next week.
Therefore, for gold on Monday, we can rely on the 3264-3268 line of pressure to continue shorting, and the limit of the pullback cannot exceed the 618 position of 3275, which is the watershed. The support below is 3222-3224, and if it breaks, it will hit the low point of 3201-3202, which may not be maintained.

GOLD - reached at final support? What's next??#GOLD.. well guys market perfectly moved as per our analysis and now market job at reached at his final supporting area that is 3350-51 around
Keep close it n only short below that.
Good luck
Trade wisely

There are short-selling opportunities in gold in the short term!
After gold rebounded, there was strong pressure around 3315, so it was a short opportunity, sl: 3325, tp: 3290

Bullish Breakout Defies Trade Uncertainty and Global TensionsOANDA:XAUUSD Gold remains firm near $3,333, holding a bullish structure after a breakout above multi-year resistance. While short-term pullbacks persist, geopolitical tensions and a Fed pause continue to support safe-haven demand. Trump's refusal to ease China tariffs dampens trade optimism, further boosting gold's appeal. Key support lies around $3,333 and $3.273.
Resistance : $3,414 , $3,474
Support : $3,333 , $ 3,273

Gold update Chart Analysis
Trend: The market is currently in an uptrend with a pullback happening within a bullish flag or channel.
Current Price: Around 3,390.13
Support Zone: Near 3,322.725
Potential Entry: At or just below the current price level after a small dip (as shown by the blue arrow).
Bullish Bias: Based on the continuation pattern and price respecting the upward trendline.
📈 Trade Setup (Buy Position)
Entry: Around 3,390
Stop Loss (SL): Below the recent swing low or channel support → around 3,361
Take Profit (TP): Targeting the projected measured move → around 3,450 - 3,460
This setup gives a decent Risk:Reward ratio, approximately 1:2 or better, depending on the exact entry.
🔁 Summary
Entry: 3,390
SL: 3,361
TP: 3,450 to 3,460
Bias: Bullish continuation after a healthy pullback

Will the price of gold continue to rise?The pressure position on the 44-hour chart is around 3270-3280, which becomes an important dividing point for intraday short-term trading. In the intraday trading, we focus on the 3200-line long-short watershed. Before gold falls further and breaks through, gold will maintain a bullish trend. In the intraday trading, we focus on the recent starting point of 3222 support. If gold wants to move steadily upward, it will not fall below 3222 in the day. In the short term, we refer to the points above 3222 to arrange long positions! Gold operation strategy: Gold falls back to 3230-3232, stop loss at 3220, target 3260-3270; it is recommended to go short when it touches 3270-3268, stop loss at 3280, target 3240-3230;

Gold update next weekI really wanted to sell at a higher price.
But the selling pressure was very strong, not overcoming the resistance, so I came up with a new strategy to sell gold at a lower price. Do you have any other ideas? Leave a comment.
Limit sell 3255 sl65
Limit sell 3272 sl 82 ( fake break)
Take profit 3178- 3070
---
Limit buy 3070
SL 3048.5 TP 3178
---
Limit buy 2994- 2982
SL 2972 TP 3090- 3170

NFP is out. Market reaction - 2025.05.02The NFP number came out higher than the forecast, but lower than the previous (even the revised one). The initial reaction was in favour of DXY, but it has gone quiet very quickly. Maybe because of the fact that the market is preparing for some action on 7th of May, when the Fed announces interest rates.
Let's dig in...
MARKETSCOM:DOLLARINDEX
FX_IDC:AUDUSD
FX_IDC:USDJPY
Let us know what you think in the comments below.
Thank you.
77.3% of retail investor accounts lose money when trading CFDs with this provider. You should consider whether you understand how CFDs work and whether you can afford to take the high risk of losing your money. Past performance is not necessarily indicative of future results. The value of investments may fall as well as rise and the investor may not get back the amount initially invested. This content is not intended for nor applicable to residents of the UK. Cryptocurrency CFDs and spread bets are restricted in the UK for all retail clients.

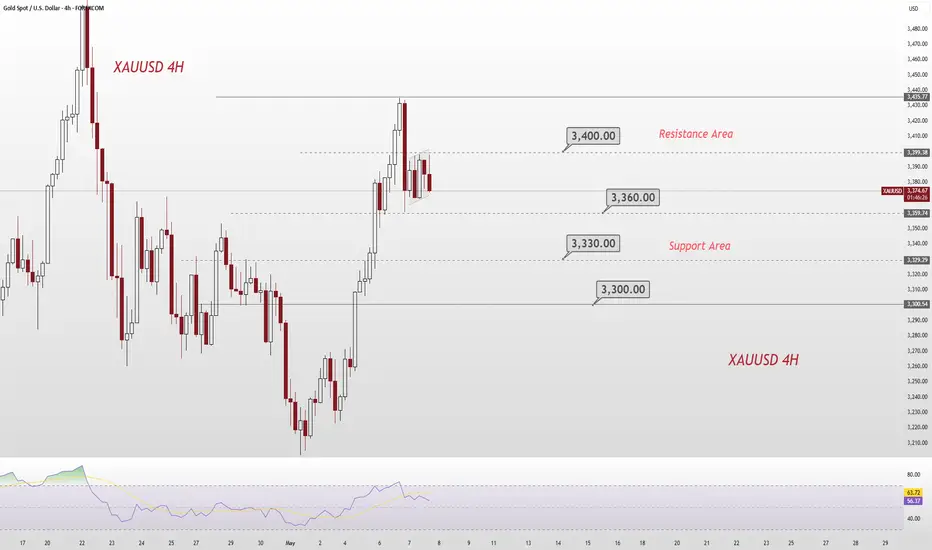
XAUUSD Update 08/May/2025Today's gold movement is stuck in a sideways movement due to waiting for the results of the Fed (FOMC) meeting.
The current price is at its support, the greatest possibility is to continue its bullish movement.
Target 3470 - 80 level price
Good Luck !
