The Trader’s Trinity: THE BIG 3 OF TRADING!Everyone talks about strategies, indicators, and secret setups.
But if you strip trading down to its core, three pillars separate the winners from the quitters.
me @currencynerd , i call them The Big 3:
✅ Mindset/ Psychology
✅ Risk Management
✅ Strategy/ System with edge
You master these — you grow.
You neglect even one — you stay stuck, or worse, blow up.
Let’s dig in.
🧠 1. Mindset: Your Inner Edge
Markets aren't just math — they’re emotion, fear, greed, and uncertainty.
Successful traders:
Stick to plans during volatility
Stay calm after wins or losses
Manage ego (no "I must be right!" trades)
Key mindset habits:
Journaling trades (and emotions)
Setting realistic expectations
Accepting losses as part of the game
🔔 Reminder:
The market doesn't owe you anything. Stay humble, stay focused.
💣 2. Risk Management: Your Lifeline
Risk management isn't sexy — until you realize it's the reason you survive long enough to succeed.
Never risk more than 1–2% of your account on a single trade
Use stop-losses religiously
Understand position sizing — bigger conviction doesn’t mean "bet the farm"
Be comfortable being wrong — because you will be, often
Quote to live by:
"Amateurs focus on returns. Professionals focus on risk."
You don’t need to win every trade. You just need to protect your downside.
📈 3. Strategy: Your Playbook
Strategy gets all the attention — but it's only powerful if Mindset and Risk are already in place.
Your strategy should answer:
When do I enter?
When do I exit?
How do I manage trades in between?
Good strategies:
Are tested (backtested and forward tested)
Are simple (complexity often kills execution)
Fit your timeframe and personality
Trend following, mean reversion, breakout trading, scalping — it doesn’t matter.
What matters is consistency and execution.
🚀 Why the Big 3 Matter More Than Anything Else
Mindset keeps you stable.
Risk Management keeps you in the game.
Strategy gives you direction.
Neglect one and your trading will eventually collapse — no matter how good the other two are.
Successful trading isn’t a magic trick.
It’s mastering boring basics, executed relentlessly.
Final Thoughts from @currencynerd
You don’t need to find the Holy Grail.
You just need to respect the Big 3:
Master your mind.
Respect your risk.
Stick to your strategy.
Most traders are searching for the secret.
Elite traders are perfecting the fundamentals.
Which group are you going to be in?
put together by : @currencynerd
courtesy of : @TradingView
USCGC trade ideas

GOLD(XAUUSD)A falling wedge pattern has been broken to the upside, a signal often indicating a potential bullish reversal. Price Momentum: After the breakout, a clear bullish impulse emerged, indicating buying power. Price Structure: An important resistance/structure has been broken to the upside.

Will gold reach an all-time high?Gold (XAU/USD) Market Analysis
Trend Environment
The 4-hour chart of Gold (XAU/USD) from OANDA illustrates a strong impulsive structure within a broader bullish trend. Following a sharp upward movement that broke through previous structure, gold formed a swing high before entering a corrective phase. The market has since pulled back and appears to be stabilizing near a zone of high confluence, suggesting potential for a renewed move to the upside.
Key Levels
Support Zone 3,280-3,300 region, characterized by a fair value gap and Fibonacci golden pocket zone (0.618-0.65 retracement levels).
Potential Targets Higher lows and break of structure above recent swing highs, with buy-side liquidity levels (BSL) marking areas where buy stops are likely to be clustered.
Technical Confluence
The alignment of the fair value gap and Fibonacci retracement levels in the 3,280-3,300 region increases the likelihood of price reacting positively. Fair value gaps represent inefficiencies in the market caused by strong institutional participation, while the golden pocket is historically known for acting as a magnet for reversals within trending markets.
Bullish Scenario
The chart projects a potential bullish continuation move, with a series of higher lows anticipated to form en route to a break of structure above recent swing highs. A methodical stair-step advance is expected, respecting interim levels before ultimately attempting to reach the prior high near 3,530.
Strategic Framework
This analysis offers a methodical roadmap for bullish continuation, rooted in the smart money framework of liquidity, inefficiency, and institutional order flow. The confluence between the fair value gap and Fibonacci retracement serves as a key validation area for bullish traders. By understanding the technical and institutional drivers of the market, traders can better navigate the complexities of the gold market and identify potential opportunities for growth.

Gold Surf Update 1 Hour FrameWith this idea, we have a pretty high stop loss of 200 pips. So allocate the volume to suit the account. About 1% capital loss, when reaching profit, it will increase by 4%. Good lucky

Gold Market Analysis – Weekly Outlook 10-05-2025Wondering where gold is heading next? Don’t worry, we’ve got you covered.
Our technical analysis indicates that gold has once again entered bearish territory on the 4-hour chart as of Friday’s close. This marks the second time in two weeks that gold has shifted into a bearish trend, further supporting our current outlook.
We have maintained a bearish bias on gold for several weeks, and the latest movement in the moving averages continues to validate this view, at least in the short term. Our team is actively monitoring the market for sell opportunities on lower timeframes, aiming to maximize profitability.
Stay tuned for further updates from the InvestmentLive trading desk.

Up again for goldHi traders,
Last week gold immediately went up and made a correction down.
On Friday price rejected from the 4H BPR so next week we could see more upside.
Let's see what price does and react.
Trade idea: Wait for a small correction down on a lower trimeframe to trade longs again.
If you want to learn more about trading FVG's & liquidity sweeps with wave analysis, please make sure to follow me.
This shared post is only my point of view on what could be the next move in this pair based on my technical analysis.
Don't be emotional, just trade your plan!
Eduwave

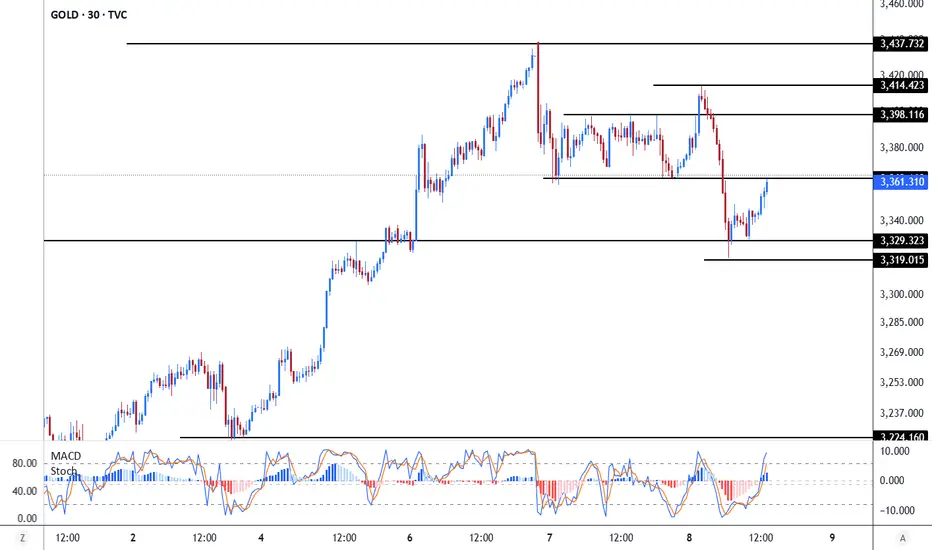
Gold Short-Term Outlook: Potential Rebound Toward Resistance Be The price is currently trading around the 3353 level, after bouncing from a key support zone at 3329 dollars.
In the first scenario, if the price continues to rise, it’s expected to reach the 3398 level — a very strong resistance area, as it aligns with a descending trendline and multiple previous highs. This zone could trigger a strong pullback, and we expect a new decline back toward the 3329 and 3319 levels respectively.
The MACD is giving a bullish signal, and the Stochastic is also moving up from the oversold area, which suggests the possibility of a temporary upward move.
The Fed’s interest rate decision makes a grand debut
After gold quickly rose and fell today, gold basically began to fluctuate sideways. Of course, this is also to welcome the heavy data of the Federal Reserve's interest rate decision; gold is likely to fluctuate like this before the data, so where will the Federal Reserve's interest rate decision go? And how to lay it out?
Judging from the recent market and data, there is a high probability that gold will keep interest rates unchanged, so gold as a whole will still maintain a volatile upward trend. The gold 1-hour moving average is still a bullish arrangement with a golden cross upward. The strength of the gold bulls is still there, and gold will continue to make more dips. Gold 3350 is still an important turning point for gold's long-short transition. After the gold Fed interest rate decision, then we will continue to go long on dips above 3350. After the Federal Reserve's interest rate decision, gold will continue to buy on dips above 3350.
Gold's short-term trend is still a bullish arrangement. Gold will continue to buy on dips without breaking 3350. If the gold data unexpectedly falls below 3350, then re-arrange it at that time.
Operational ideas:
Gold more than 3350, stop loss 3340, target 3400-3420;

GoldXAUUSD
- Point of Interest
- Symmetrical Triangle as corrective pattern in Short Time Frame
- Order Block
- Completed " 12345 " Impulsive Waves and " AB " Corrective Waves
- Fibonacci Level - 38.20% / 50.00%

Gold H4 | Pullback support at 38.2% Fibonacci retracementGold (XAU/USD) is falling towards a pullback support and could potentially bounce off this level to climb higher.
Buy entry is at 3,343.88 which is a pullback support that aligns with the 38.2% Fibonacci retracement.
Stop loss is at 3,270.00 which is a level that lies underneath an overlap support and the 61.8% Fibonacci retracement.
Take profit is at 3,431.43 which is a swing-high resistance that aligns with the 78.6% Fibonacci retracement.
High Risk Investment Warning
Trading Forex/CFDs on margin carries a high level of risk and may not be suitable for all investors. Leverage can work against you.
Stratos Markets Limited (tradu.com):
CFDs are complex instruments and come with a high risk of losing money rapidly due to leverage. 63% of retail investor accounts lose money when trading CFDs with this provider. You should consider whether you understand how CFDs work and whether you can afford to take the high risk of losing your money.
Stratos Europe Ltd (tradu.com):
CFDs are complex instruments and come with a high risk of losing money rapidly due to leverage. 63% of retail investor accounts lose money when trading CFDs with this provider. You should consider whether you understand how CFDs work and whether you can afford to take the high risk of losing your money.
Stratos Global LLC (tradu.com):
Losses can exceed deposits.
Please be advised that the information presented on TradingView is provided to Tradu (‘Company’, ‘we’) by a third-party provider (‘TFA Global Pte Ltd’). Please be reminded that you are solely responsible for the trading decisions on your account. There is a very high degree of risk involved in trading. Any information and/or content is intended entirely for research, educational and informational purposes only and does not constitute investment or consultation advice or investment strategy. The information is not tailored to the investment needs of any specific person and therefore does not involve a consideration of any of the investment objectives, financial situation or needs of any viewer that may receive it. Kindly also note that past performance is not a reliable indicator of future results. Actual results may differ materially from those anticipated in forward-looking or past performance statements. We assume no liability as to the accuracy or completeness of any of the information and/or content provided herein and the Company cannot be held responsible for any omission, mistake nor for any loss or damage including without limitation to any loss of profit which may arise from reliance on any information supplied by TFA Global Pte Ltd.
The speaker(s) is neither an employee, agent nor representative of Tradu and is therefore acting independently. The opinions given are their own, constitute general market commentary, and do not constitute the opinion or advice of Tradu or any form of personal or investment advice. Tradu neither endorses nor guarantees offerings of third-party speakers, nor is Tradu responsible for the content, veracity or opinions of third-party speakers, presenters or participants.

GOLD PLAN UPDATE 07/05/2025H4 is showing a reversal signal, but it looks more like a retest of the broken resistance zone.
By the book + looking at the D1 chart, there’s a high chance gold pushes higher after this retest.
To me, this current rally feels a bit shaky.
My view: gold might retest or break the previous high, but I don’t see it running too far before pulling back again.
That’s my medium-term outlook—not a short-term call. Let’s wait and see 😄

GoldXAUUSD
- Double Top as corrective pattern in Short Time Frame
- Break of Structure
- RSI - Divergence
- Completed " 12345 " Impulsive Waves
- Change of Characteristics

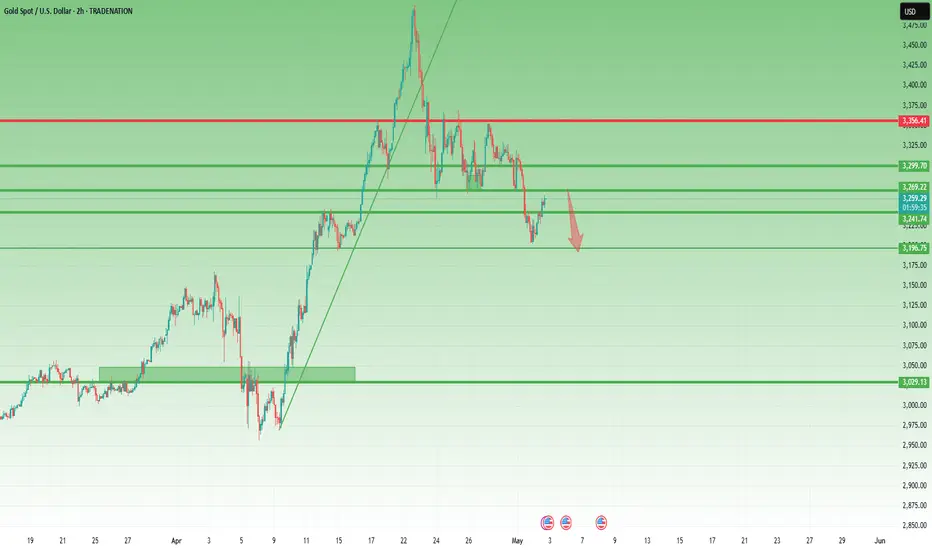
Gold Bears Won Big – Here’s the Next Resistance to WatchYesterday was a great day for Gold bears – just as anticipated, price dropped nearly 1,000 pips and hit my target zone around 3200.
After such a strong move, we’re now seeing a typical rebound, which might offer a fresh opportunity to sell into strength and ride the prevailing trend.
🔍 Key Zone:
- 3270 now acts as resistance.
- If price stalls here, it’s the ideal area to look for short entries targeting a retest of 3200.
🛠️ Plan: Sell spikes into 3270 resistance and stay with the trend.
XAUUSD TRADE SETUPWait for retest the entry level and bearish momentum then take a trade for Sell otherwise skip this setup

Xauusd Expecting bullish movement A strong bullish trend is identified by the upward blue channel on the left side of the chart showing consistent higher highs and higher lows.
The price then broke out of the bullish channel and entered a consolidation phase marked by a red descending rectangle, indicating distribution or potential reversal.
Following the consolidation, a bearish breakdown occurred confirming the end of the bullish momentum.
Current Price Structure:
Price found support around the 3320 level, shown with a red horizontal box.
A bullish reversal pattern appears to be forming, with higher lows suggesting accumulation and potential for a move higher.
Forecast:
The projected path (blue arrow) anticipates a bullish reversal, with price expected to rally from current levels toward the target zone near 3380–3390 highlighted in blue.
The target zone aligns with previous support turned resistance, making it a logical profit-taking area
This is a bullish setup based on a break-and-retest pattern.
Entry is likely being considered around current support (3320–3325), with the target near 3385 and a stop-loss likely placed below the support zone to manage risk.

XAUUSDThe Commitment of Traders (COT) data reveals a shift toward increased selling activity, indicating a bearish sentiment in the market. This suggests that traders are positioning themselves for potential declines, possibly anticipating a drop in asset prices. Such trends often signal caution, with market participants adjusting their strategies based on changing conditions.

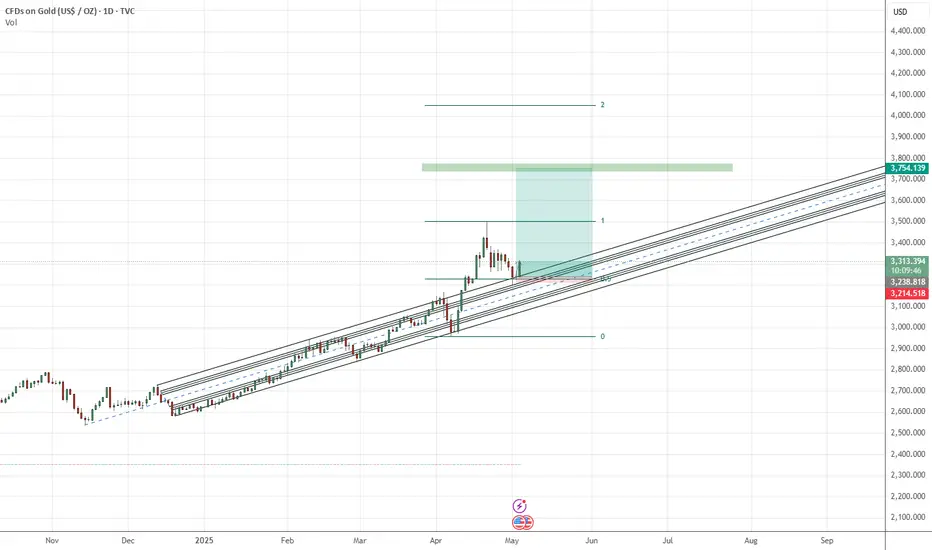
Gold Showing Signs of a Potential Top Gold has all the hallmarks of a potential top, with signs pointing to a possible slowdown in the uptrend. While some weakness could develop over the coming weeks, this does not necessarily signal a reversal. The momentum remains strong enough that any pullback or dip could attract buyers looking to capitalize on lower prices, keeping the overall bullish trend intact.

XAUUAD UPDATE: 9- 05-2025This chart is for Gold (XAU/USD) on a 45-minute timeframe and includes technical analysis. Here are the key details:
Chart Components:
1. Support and Resistance Zones:
Lower Yellow Zone (~3241.450): This is a support zone where price previously bounced.
Upper Yellow Zone (~3414.901): This is a resistance zone where price previously reversed.
2. Current Price:
Price is currently around 3307.260, slightly above a key support area.
3. Projected Movement (Blue Arrows):
The blue line indicates a possible short-term dip into the support zone.
Followed by a reversal and rise toward the resistance zone around 3415.
4. Volume Indicator:
Volume appears to spike during key movements, showing strong interest at support/resistance levels.
5. Risk-Reward Box (Red-Green Shading):
Red area: Risk zone for long positions (if price drops below the support).
Green area: Reward zone if the price follows the projected upward movement.
Interpretation:
The chart suggests a bullish setup with an anticipated bounce from the support zone near 3241 and a target toward the resistance zone at 3415. This analysis assumes the support holds strong and buyers step in at that level.
Would you like a trading strategy or indicators to support this analysis?

XAUUSD /GOLD Trade Setup: Bullish (Buy)
Entry Price (Buy Limit):
Around $3,385 – This is near the retest zone (support) after the breakout and the top of the demand block from earlier.
Stop Loss:
Below the demand zone low, around $3,370 – This gives room in case of a liquidity sweep but protects against a structure break.
Take Profit (TP1 / Conservative):
Around $3,410 – This is below the upper supply zone to secure profits before potential reversal.
Take Profit (TP2 / Extended):
Around $3,425–3,430 – Closer to the full retest of the supply zone above for extended profits.

Potential Bullish Price Action on Gold.This setup suggests gold is about to take out the previous high. Looking forward to seeing how price plays it out today.

Daily Analysis- XAUUSD (Wednesday, 7th May 2024)Bias: Bullish
USD News(Red Folder):
-None
Analysis:
-Strong pullback on market open
-Looking for price to retest 0.5 fib level
-Potential BUY if there's confirmation on lower timeframe
-Pivot point: 3310
Disclaimer:
This analysis is from a personal point of view, always conduct on your own research before making any trading decisions as the analysis do not guarantee complete accuracy.

Wed 7th May 2025 XAU/USD Daily Forex Chart Buy SetupGood morning fellow traders. On my Daily Forex charts using the High Probability & Divergence trading methods from my books, I have identified a new trade setup this morning. As usual, you can read my notes on the chart for my thoughts on this setup. The trade being a XAU/USD Buy. Enjoy the day all. Cheers. Jim
Note: This isn’t a great setup as price is already at the previous high and the MACD is just below the zero level. But I had to take it because I am committed to my MSH (multi sequence hedging) strategy. So if you are a traditional type trader, then standing aside on this trade would probably be the smart thing to do.
