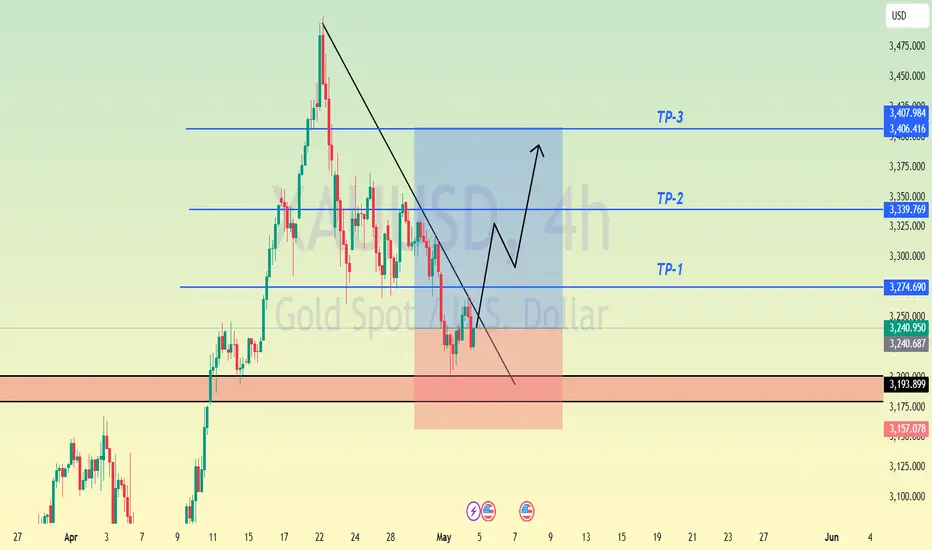
Potential Bullish Price Action on Gold.This setup suggests gold is about to take out the previous high. Looking forward to seeing how price plays it out today.
USCGC trade ideas

Daily Analysis- XAUUSD (Wednesday, 7th May 2024)Bias: Bullish
USD News(Red Folder):
-None
Analysis:
-Strong pullback on market open
-Looking for price to retest 0.5 fib level
-Potential BUY if there's confirmation on lower timeframe
-Pivot point: 3310
Disclaimer:
This analysis is from a personal point of view, always conduct on your own research before making any trading decisions as the analysis do not guarantee complete accuracy.

Wed 7th May 2025 XAU/USD Daily Forex Chart Buy SetupGood morning fellow traders. On my Daily Forex charts using the High Probability & Divergence trading methods from my books, I have identified a new trade setup this morning. As usual, you can read my notes on the chart for my thoughts on this setup. The trade being a XAU/USD Buy. Enjoy the day all. Cheers. Jim
Note: This isn’t a great setup as price is already at the previous high and the MACD is just below the zero level. But I had to take it because I am committed to my MSH (multi sequence hedging) strategy. So if you are a traditional type trader, then standing aside on this trade would probably be the smart thing to do.

XAU / GOLD🌟 GOLD: THE BIGGEST TRADE OF SUMMER 2025
XAU/USD Forecast
📈 PHASE 1: SHORT-TERM RALLY (after small correction to 3172$)
We expect a bounce toward the $3,789–$3,800 resistance zone.
🔴 PHASE 2: THE SHAKEOUT
May 27 SELL ZONE.
After May 27, the cycle flips.
Expect a violent correction, retracing into key support around $2,880–$2,970 or even lower.
🟢 PHASE 3: THE BUY ZONE — July 13 +/- few days.
Mid-July marks the ideal long-term entry into TVC:GOLD before the explosive move.
🚀 PHASE 4: THE BREAKOUT
Target: ATH above $4,000 by late summer
Yes, EUROTLX:4K + gold is coming — but only after the market resets.

XAUUSD - GOLD UPDATES - May 2nd - before NFP🪙 GOLDMINDSFX | MAY 2 XAUUSD IDEAS
“Gold plays games. We play levels.”
🏛️ MACRO & POLITICAL CONTEXT
Gold is stabilizing inside a retracement phase following April's all-time high (ATH 3500). After sweeping major liquidity below 3205, we’ve seen structure shift back to bullish on the lower timeframes.
Today’s NFP may trigger sharp volatility, but we trade structure, not headlines.
China remains closed for Labor Day until May 5—reduced Asia volume. Meanwhile, Q1 data shows central bank gold accumulation slowing, adding caution to global demand outlook.
With recent lows defended and current price inside a decision zone, we wait for liquidity to declare direction—no predictions, only reactions.
🔁 MARKET STRUCTURE OVERVIEW
Confirmed CHoCH from 3205
BOS above 3233
Bullish FVGs developing
HTF still bearish under 3333
📍Live Price: 3265
📌 TECHNICAL ZONES & CONFLUENCES
🔼 BUY ZONES
🟢 Buy Zone #1: 3233–3220
15M FVG + recent impulse rejection
Entry on rejection or liquidity wick
🟢 Buy Zone #2: 3205–3190
CHoCH origin + 1H OB
Golden pocket: 0.618–0.705
Ideal continuation setup
🟢 Buy Zone #3: 3172–3160
H4 OB + EQ + deep liquidity
Final support before full structural flip
🔽 SELL ZONES
🔴 Sell Zone #1: 3284–3295
1H supply + FVG + BOS confluence
Buy-side liquidity resting above 3280
🔴 Sell Zone #2: 3325–3333
Prior rejection base + liquidity shelf
Best R:R trap zone
🔴 Sell Zone #3: 3366–3378
Final stop-hunt trap zone before reversal
Use only with rejection / PA confirmation
🧠 STRATEGY NOTES
SL adjusted to 100–150 pips according to entry zone
Price is coiling under 3265 = decision time
Liquidity is stacked above and below—wait for sweep and structure shift
We’re not here to predict. We hunt zones and execute like killers.
Confirmation before entry: BOS, CHoCH, wick traps, engulfing, rejection wicks.
📌 Important Notice!!!
The above analysis is for educational purposes only and does not constitute financial advice. Always compare with your plan and wait for confirmation before taking action.
🖊️ If these insights help you refine your trading plans, give us a boost and follow GoldMindsFX on TradingView. Let's grow together!

NFP is out. Market reaction - 2025.05.02The NFP number came out higher than the forecast, but lower than the previous (even the revised one). The initial reaction was in favour of DXY, but it has gone quiet very quickly. Maybe because of the fact that the market is preparing for some action on 7th of May, when the Fed announces interest rates.
Let's dig in...
MARKETSCOM:DOLLARINDEX
FX_IDC:AUDUSD
FX_IDC:USDJPY
Let us know what you think in the comments below.
Thank you.
77.3% of retail investor accounts lose money when trading CFDs with this provider. You should consider whether you understand how CFDs work and whether you can afford to take the high risk of losing your money. Past performance is not necessarily indicative of future results. The value of investments may fall as well as rise and the investor may not get back the amount initially invested. This content is not intended for nor applicable to residents of the UK. Cryptocurrency CFDs and spread bets are restricted in the UK for all retail clients.

THE KOG REPORT - UpdateEnd of day update from us here at KOG:
BOOMING! We said we would stick with the plan, we did, and BOOM, straight into the level we wanted. What we did want from there however is a bounce, but instead, we got just over 100pips long and then back into the lower level where we are now ranging.
Unless there is a late session move and 3210 holds us up to target the 3250-55 level initially, we'll wait lower now which is where the Asia session may take it.
With NFP tomorrow, we can expect that typical pre-event price action to begin soon, so maybe best practice now is to wait for them to do what they want, and come back next week to capture better set ups.
DOW, NAS, BTC, GOLD, EU and Oil all performing for us today, well done team. Another day in the office.
We'll be back tomorrow with the NFP KOG Report and our view.
As always, trade safe.
KOG

XAUUSD: Gold Once Again Back To $3270 Region, What Next ? Gold has once again backed to the 3270 region and rejected it, currently trading at 3280$. The main question is whether gold will hold on to this level. If not, we could see a strong sell-off taking the price to 3130. This is because the sellers’ presence has increased, and the price has been volatile due to mixed news and economic data, further strengthening the bears’ position in the market.
Despite this, we remain optimistic that gold will continue its bullish move upwards. There’s a strong reason for this: we may see all-out war happening in Asia, although this is purely speculative. For now, you may decide to continue monitoring the price or even take a swing buy, which could be risky.
Given the volatility of gold, we recommend trading cautiously and taking extra precautions while trading gold.
Wishing you good luck and safe trading!
Thank you for your support! 😊
If you’d like to contribute, here are a few ways you can help us:
- Like our ideas
- Comment on our ideas
- Share our ideas
Team Setupsfx_
❤️🚀

Bull market ends gold's declineHi guys, this is my overview for XAUUSD, feel free to check it and write your feedback in comments👊
A few moments ago, the price traded inside a little flat, where it declined to the bottom part and then started to grow.
In a short time, it reached the $2955 level, broke it and started to trades inside a big flat, exiting from a small range.
After this movement, the price reached the top part of the flat and then corrected, after which it entered to pennant.
In the pennant pattern, Gold exited from a flat and rose to the resistance line from the support line, breaking the $3205 level.
Also recently, price made a correction, but then it turned around and bounced up, thereby exiting from pennant.
Now, I think that Gold can rise a little and then start to decline to $3205 support level.
If this post is useful to you, you can support me with like/boost and advice in comments❤️
I know many people's accounts have been burned or are about to be burned due to the rapid decline and rise of gold. If you are a novice or you need some advice, you can contact me and I will give you free advice.

xauusd4k target as high as 4200 have to see. 5th wave again likely extending. Possible ending diag. 50% is been tapped but it can go lower, 2956 is ivalidation watch for red line at 3150 aea if this c goes further down.

Gold is about to make an upward breakthrough!- Descending Triangle as an corrective pattern in Short Time Frame
- Break of Structure
- S / R Level
- Change of Characteristics
- Completed " 12345 " Impulsive Waves and " ABC " Corrective Waves

The downside risk of gold increases!📌Fundamentals:
1. The conflict between India and Pakistan shows signs of escalation
2. US-Houthi ceasefire agreement
3. The Fed’s interest rate decision dominates this week’s market
4. International trade situation disturbs market sentiment
5. Market sentiment and capital flow
📊Technical aspects:
At present, on the hourly basis, gold is still under pressure at the small range resistance of 3400, and the current tariff crisis has cooled down. The data of the Fed's interest rate decision will cause a series of fluctuations in gold in the short term. At the same time, the market is betting that there will be further trend corrections, which may cause capital outflows in the market, which will further hit gold bulls!
There is actually a new round of operation opportunities in the short term. The short-term resistance should be around 3400, but since the game between major powers has not stopped, there will be no big negative factors. However, if the data layout does not fluctuate much, the market may not have a big dive. At present, we will temporarily play at the 3360-3400 level. If it breaks, we will make new adjustments!
🎯Practical strategy:
Gold: Short around 3390-3400 on the rebound, and the target is 3370-3360!

GOLD → Correction before NFP. What are the chances of a decline?FX:XAUUSD strengthens amid dollar correction. The market is correcting ahead of NonFarm Payrolls, trying to accumulate potential before high volatility.
Gold recovers ahead of US employment report
On Friday, gold rebounded from a two-week low, recouping some of its losses ahead of the release of US labor market data (NFP), which could set the tone for prices going forward. Amid optimism over trade talks and a strong dollar, gold ended its worst week in two months, but geopolitical tensions and a potentially weak jobs report could boost demand for safe-haven assets again.
The correction in the dollar gives gold a small chance to strengthen. However, fundamentally, the overall trend has already set the tone and gold may continue to fall.
Resistance levels: 3268, 3285, 3295
Support levels: 3227, 3204
The correction may reach a local zone of interest (money pool) — liquidity above 3270, or the 0.7 Fibonacci zone, after which the price may continue its course along the new trend — down to 3193.
However, unpredictable and unexpected data could disrupt the structure and push the price up to 3320-3350.
Best regards, R. Linda!

Hellena | GOLD (4H): SHORT to 38.2%-50% Fibo lvl 3228.Colleagues, last week we got a stoploss, but I still believe that we should expect a correction in wave “2”. We will try to catch this movement this week.
I believe that the price will correct to the area of Fibonacci 38.2% - 50% levels (3228.41).
Perhaps the price will slightly renew the maximum of wave “1”, reaching the level of 3438. In this case I recommend to work with pending limit sell orders.
And some data:
The prevalence of bulls according to CME reports additionally increased by 13%.
The 23% increase in market volume, meanwhile, indicates a likely strong momentum pattern during the trading week.
Despite the 13% increase in buyers, selling patterns towards the balance level of the week (3200.00) are recommended for the current trading week.
Manage your capital correctly and competently! Only enter trades based on reliable patterns!

Bullish Gold: Ride the Wave with Pullback BuysOn the daily gold chart, there was a sharp upward surge on Monday, and the price rebounded above the $3300 mark. Normally, the upward movement on the daily chart could potentially drive the price towards the high point near the upper Bollinger Band at around $3500. This also means that the monthly chart recovers the upper shadow and forms a second upward thrust. So, there is ample upside potential. We should focus on the sustainability of this upward momentum.
On the 4 - hour chart, another wave of strength is needed. A significant rally is required to widen the upper Bollinger Band and establish an absolute one - sided bullish trend. Therefore, although the bullish outlook is clear for now, there is still a possibility of some adjustments. Currently, the support below is around the $3340 - $3350 range, with the dividing line being near the early - morning low of $3330. If there is an opportunity for the price to pull back to the support area, one can go long and bet on the upward trend. Today, keep an eye on the resistance levels at $3385 - $3395 - $3400.
XAUUSD
buy@3350-3355-3360
tp:3370-3380-3400
Investment itself is not risky; it is only when investment is out of control that risks occur. When trading, always remember not to act on impulse. I will share trading signals every day. All the signals have been accurate without any mistakes for a whole month. No matter what gains or losses you've had in the past, with my help, you have the hope of achieving a breakthrough in your investment.

Is Gold Ready to Break the High… Again?On the Daily timeframe , the seller’s level at 3366.900 , formed by the April 22nd bar, was broken by strong buying pressure and is currently being retested from above.
On the Hourly chart , I’m observing a bullish wide-spread bar with the highest volume, which also broke through the 3366.900 level.
📈This bar has its own test at 3349.745, which supports the bullish bias for now.
As long as this level holds, I expect the long scenario to remain valid.
Overhead, there is resistance from sellers at 3404.761 .
If price breaks above it, the next upside targets are:
🎯 3438.708
🎯 3500.120
#TechnicalAnalysis #DayTrading #VSA #XAUUSD #GOLD # #FuturesTrading #VolumeSpreadAnalysis

Gold Price Analysis May 7Yesterday's D1 candle continued to be a FULL candle with a 100 price increase. At the beginning of the day, the market opened with a bearish price gap, showing that the market also wants to cool down and today.
Gold is sideways in the range and is running a corrective downtrend.
The support zone for BUY strategies is around 3371, this is the EMA 34 of the h1 frame and is partially supported by the trendline. The next notable area is 3352, which is the old candle wick area and also the support area of yesterday's European session.
The two SELL areas are around 3402 and the Gap opening area is 3423.

Gold Price Analysis May 5The D candle cluster appears with the sellers still dominating. 3270 is still playing a key role in reversing the trend.
The h1 structure is creating a false break in the 70 zone and wants to continue falling in the corrective downtrend. Pay attention to the 3263 break zone in the European session, when breaking this zone, Gold will form an uptrend and the possibility of breaking the 3270 zone is very high. 3285 will be the next reaction zone when breaking 3270, then the Down wave of Gold will be broken. Gold can reach 3303 when there are retests to the support zones.
In the opposite direction, Gold does not break 3262 and continues to fall, it will be favorable for the downtrend and the possibility of forming a double top pattern and falling sharply is also quite high. The Trendline zone 3243 is considered an important support zone in the near future for the Gold price decline. Next, pay attention to the reaction zone of the daily support around 3225.

Intraday adjustment ends, follow up with low and long positions!📌Fundamentals:
1. The conflict between India and Pakistan shows signs of escalation
2. US-Houthi ceasefire agreement
3. The Fed’s interest rate decision dominates this week’s market
4. International trade situation disturbs market sentiment
5. Market sentiment and capital flow
📊Technical aspects:
Affected by the trade negotiations, gold reached a high of 3434 and came out of the 70 US dollar drop. It took advantage of the trend to follow up the short order and reached the target profit stop as scheduled! Then it fell back and went long again to reap profits. The daily line continued to close in the positive direction, and there was room for fallback and adjustment during the Asian session. However, the daily cycle did not support a sharp decline for the time being. The data during the day tended to be treated as shocks. Therefore, the bullish trend remained unchanged, and the support below was 3335. You can go long if it hits during the day. The short-term support is around 3360 and 3350. In terms of operation, it will continue to be low and long. When it stabilizes, it will go to 3410 or even near the high point. However, if the second test does not reach a new high, there may be a larger correction.
🎯Practical strategy:
Gold is long around 3350-55, looking at 3376 and 3410! If it is strong, go long based on the support of 3365-60!

Risk aversion in China-US negotiations cools down!Gold closed with an "inverted hammer" positive line this week. The upper shadow line was mainly due to the continued stimulation of gold's safe-haven properties by the news at the beginning of the week. However, the tariff war with previous lessons helped the gold price to hit a historical high of 3500. The reaction of gold prices to this news this week was not as enthusiastic as before, which also led to the stop of the rise at 3439. The announcement of the interest rate decision in the second half of the week was in line with expectations. The gold price plunged 170 points in two days and stabilized above the 3300 mark as of yesterday's closing. Based on the previous evening star combination and this week's inverted hammer, it is believed that the gold price will continue to fall next week and will close below the real time, that is, below 3306.
From the perspective of daily K, this week is generally a trend of rising and falling, and a slight rebound follows after the decline at the end of the week. Weekly Review We continue with the analysis of the second half of the week. From the perspective of the gold price trend since the high point of 3500, the first wave of decline has been considered to be over. The rebound from 3200 to 3439 did not exceed the previous high, so we will continue to analyze the second wave of decline, and strictly implement this idea in the operation. Now the overall trend of gold prices is also the same. Next week's operation will focus on the key suppression position of 3378 near the end of the week. If it cannot stand firm in the first half of the week, there is still a lot of room for further decline.
From the four-hour level, the triangle convergence pattern we analyzed is still there. Unexpectedly, there was a false break of the lower track in the Asian session on Friday. Next week, we still need to continue to pay attention to the support of this position. In general, next week, we will first pay attention to the operation of the range from 3378 to 3274, and wait for the break before I will re-analyze the structure. Once again, I would like to remind you that the news market is repeated, and the base of gold prices is too large, so the intraday volatility has also increased. It is also common to go up and down more than 100 points in a single day. Everyone needs to pay attention to the risk control of their positions.
In the short term, if we move to the hourly level, we can analyze the last wave of structure. The gold price rebounded after breaking through 3288 in the Asian session on Friday. After this action, the gold price rebounded quickly. Let’s not talk about who has the upper hand. From the last wave of rebound, the continuation is insufficient. If it is a restart of the bulls, the European and American sessions also need to cross the previous downward high point of 3368 to confirm. However, the European session was sideways throughout, and the US session also slightly continued the rebound trend and closed hastily. Therefore, at the opening of next week, it is necessary to continue to watch the gold price to test the support of the low point of the Asian session on Friday. In general, the operation ideas for next week are mainly high-altitude, and low-long also look at the rebound short-term.

XAUUSD: 1/5 Today's Market Analysis and StrategyTechnical analysis of gold
Daily chart resistance 3283, support below 3167
Four-line chart resistance 3283, support below 3200
One-hour chart resistance 3243, support below 3200
Gold operation suggestions: From the current trend analysis, continue to pay attention to the short-term suppression of the 3250-65 area above, and continue to be bearish if it rebounds during the day. The support below is around the 3200 integer mark and 3167. The short-term long-short conversion position is in the 3260~3265 area. You can buy after it stabilizes.
Sell: 3283near SL: 3287
Sell: 3243near SL: 3248
Sell: 3200near SL: 3205

Will gold prices rise again this week?As the US dollar is approaching the key middle track of the daily line, it is not far away. In the next two days, it is expected to end the rebound correction and continue to start a weak trend decline. Therefore, gold may also have a short-term bottom at any time in the next two days. The next step is to wait for a wave of pullback. At least the bottom low point of the previous convergence triangle of 3260-3270 will be tested and confirmed. After the test, if it cannot stand under pressure, there may be a second bottom test, a secondary low point or a double bottom, and then finally start a unilateral rise all the way; of course, if 3200 is not the low point of tonight, and the lower shadow of the daily closing is short, then it may be necessary to test the last 3175 position before determining the short-term bottom;

Gold Will be Bullish from a Historic Support LevelHello Traders
In This Chart GOLD HOURLY Forex Forecast By FOREX PLANET
today Gold analysis 👆
🟢This Chart includes_ (GOLD market update)
🟢What is The Next Opportunity on GOLD Market
🟢how to Enter to the Valid Entry With Assurance Profit
This CHART is For Trader's that Want to Improve Their Technical Analysis Skills and Their Trading By Understanding How To Analyze The Market Using Multiple Timeframes and Understanding The Bigger Picture on the Charts