USCGC trade ideas

Gold is About to Continue Its Bull Trend🟡 Gold is About to Continue Its Bull Trend 🐂
XAU/USD is currently trading around $3,385 after a healthy consolidation. The structure remains bullish with higher lows and strong support above $3,350.
📌 Watch for a breakout above $3,389 to confirm continued upward momentum.
📈 If that level breaks, the next resistance is at $3,442, with $3,500 as a psychological target.
🛡️ Bull trend intact unless price drops below $3,350.
Bias: Bullish
Next resistance: $3,389 → $3,442 → $3,500
#Gold #XAUUSD #BullishTrend #BreakoutSetup #TradingView #Commodities

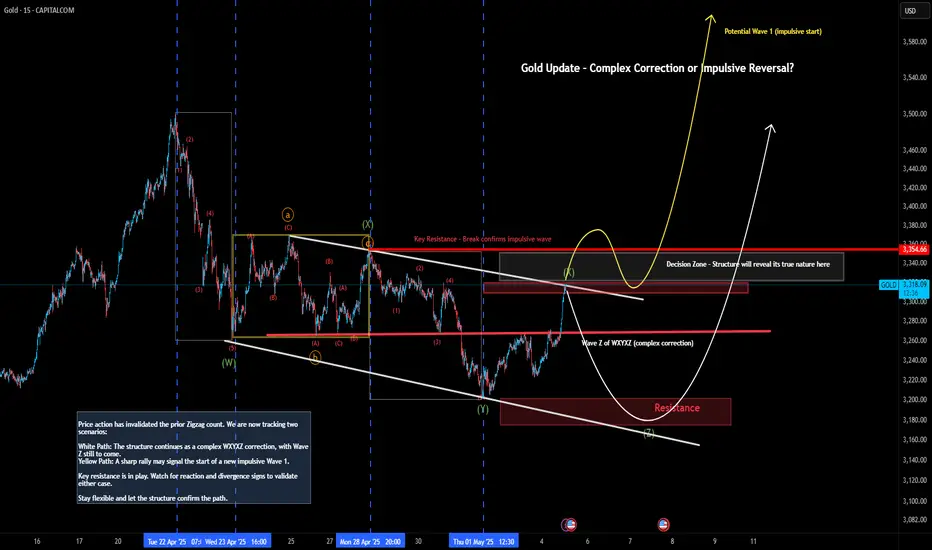
Gold Update – Complex Correction or Impulsive Reversal?
Price action has invalidated the prior Zigzag count. We are now tracking two scenarios:
White Path: The structure continues as a complex WXYXZ correction, with Wave Z still to come.
Yellow Path: A sharp rally may signal the start of a new impulsive Wave 1.
Key resistance is in play. Watch for reaction and divergence signs to validate either case.
Stay flexible and let the structure confirm the path.
bullish reject support 4H?Gold is currently sitting right at a major 4H demand zone (2627–2611), which also aligns with the third touch of a descending channel support — a classic potential reversal signal. Bulls may look for confirmation here, but if this zone fails, we could head lower toward the next demand zone

Gold still has the potential to extend to 3420-3430.Fundamentals:
Focus on the Fed's interest rate decision;
Technical aspects:
Gold rose to 3397 and encountered resistance and fell back, and the bulls' momentum was insufficient. But I think the gold bulls are far more than that. Gold is bound to hit 3400, and even continue to the 3420-3430 area; since gold rebounded after hitting 3200, it has repeatedly built a solid bottom structure support below, and the oscillating rise has effectively supported the continued rebound of gold. As the center of gravity of gold moves up, the support structure also gradually moves up. The current short-term support is in the area around 3380-3370, and the second is in the area of 3365-3355.
Trading situation:
According to today's trading strategy: Go long on gold at 3350 in the morning and around 3375 in the afternoon. In order to lock in profits in time, manually close orders at 3366 and 3394 respectively. Today, the total profit in gold long transactions exceeded 360pips.
Trading strategy:
During the rising shock, there are profit opportunities for both long and short parties in some areas, but currently, overall, bulls have the advantage and are mainly long gold. Consider the opportunity to go long when gold falls back to the area around 3380-3370, TP: 3400.

Risk aversion in China-US negotiations cools down!Gold closed with an "inverted hammer" positive line this week. The upper shadow line was mainly due to the continued stimulation of gold's safe-haven properties by the news at the beginning of the week. However, the tariff war with previous lessons helped the gold price to hit a historical high of 3500. The reaction of gold prices to this news this week was not as enthusiastic as before, which also led to the stop of the rise at 3439. The announcement of the interest rate decision in the second half of the week was in line with expectations. The gold price plunged 170 points in two days and stabilized above the 3300 mark as of yesterday's closing. Based on the previous evening star combination and this week's inverted hammer, it is believed that the gold price will continue to fall next week and will close below the real time, that is, below 3306.
From the perspective of daily K, this week is generally a trend of rising and falling, and a slight rebound follows after the decline at the end of the week. Weekly Review We continue with the analysis of the second half of the week. From the perspective of the gold price trend since the high point of 3500, the first wave of decline has been considered to be over. The rebound from 3200 to 3439 did not exceed the previous high, so we will continue to analyze the second wave of decline, and strictly implement this idea in the operation. Now the overall trend of gold prices is also the same. Next week's operation will focus on the key suppression position of 3378 near the end of the week. If it cannot stand firm in the first half of the week, there is still a lot of room for further decline.
From the four-hour level, the triangle convergence pattern we analyzed is still there. Unexpectedly, there was a false break of the lower track in the Asian session on Friday. Next week, we still need to continue to pay attention to the support of this position. In general, next week, we will first pay attention to the operation of the range from 3378 to 3274, and wait for the break before I will re-analyze the structure. Once again, I would like to remind you that the news market is repeated, and the base of gold prices is too large, so the intraday volatility has also increased. It is also common to go up and down more than 100 points in a single day. Everyone needs to pay attention to the risk control of their positions.
In the short term, if we move to the hourly level, we can analyze the last wave of structure. The gold price rebounded after breaking through 3288 in the Asian session on Friday. After this action, the gold price rebounded quickly. Let’s not talk about who has the upper hand. From the last wave of rebound, the continuation is insufficient. If it is a restart of the bulls, the European and American sessions also need to cross the previous downward high point of 3368 to confirm. However, the European session was sideways throughout, and the US session also slightly continued the rebound trend and closed hastily. Therefore, at the opening of next week, it is necessary to continue to watch the gold price to test the support of the low point of the Asian session on Friday. In general, the operation ideas for next week are mainly high-altitude, and low-long also look at the rebound short-term.

Daily live trade with XAUUSD in 15m/30m/1h 20250507Daily live trade with XAUUSD in 15m/30m/1h 20250507

GOLD 1H CHART PATTERNThe chart shows a bullish breakout from a descending trendline after forming a triple bottom support around the 3,250 level on the 1-hour timeframe. The breakout is supported by strong bullish momentum and structure shift, with price making higher highs and higher lows. A successful retest of the broken trendline confirms the reversal. The setup suggests a continuation to the upside with good risk-to-reward potential. Entry is near 3,370, and the stop-loss is placed just below 3,350 to manage risk. This indicates strong buying interest and a potential move toward the next key resistance levels.
Entry : 3375
Target Zone: 3,500

Gold has rebounded in place, go high today firstAfter the gap at 3438 in the early trading, the market crashed and plunged. So far, the long target of 3440 has been achieved! China and the United States are preparing for tariff talks, which is a major negative. Spot gold plunged more than 60 US dollars from 3438 US dollars in the early trading, and it should have reached the top within the day; if there is no major positive push, the early high of 3438 should not be broken again, otherwise once it breaks through 3500, it will definitely break, but it is unclear how far it will go above 3500. At present, while paying attention to the Sino-US tariff talks, the global geopolitical situation should also be focused on: the focus is on the India-Pakistan conflict, the population of the two countries is close to 1.7 billion, and it will be terrible if the situation gets out of control; then the Russia-Ukraine stalemate, the US-Iran crisis, etc. are positive for spot gold, and the Federal Reserve's interest rate decision tomorrow morning also needs to be paid attention to. Today, China announced the spot gold reserve data. Long and short news hit the market in turn, and it is expected that there is a high probability of continued large sweeps within the day, and the overall trend is short within the day! The market fluctuates greatly and the rhythm is fast. There are opportunities for both long and short positions, and strict loss-taking operations! The first resistance above is the 3405 area, then the 3415-20 area and the early high of 3438 area, which can be used to short spot gold; the support below is 3350-55, then 3320-25

Has the road to gold adjustment begun?Gold has reached a high of around 3404, so this position can be used as an important pressure point. In this continuous upward trend, once there is a sharp decline, it is likely to be a signal that the short-term bulls have peaked. Then we need to consider whether the bears can reverse, and the current upper pressure point is also the high point of the last wave of pullback near 3393, and the lower support is at 3360.
Trading idea: short near 3387, sl: 3400 tp: 3370

Daily live trade with XAUUSD in 15m/30m/1h 20250505Daily live trade with XAUUSD in 15m/30m/1h 20250505

XAU/USD Live Market Breakdown – May 8, 2025📊XAU/USD Live Market Breakdown – May 8, 2025
🔹Current Price: 3,337.40
🔹Timeframe: 15M
📌Key Supply Zones (Resistance):
🔴3377–3382 – Major Supply Zone (previous BOS area)
🔴3362.85 – Minor intraday resistance (price failed to hold)
📌Key Demand Zones (Support):
🟢3272–3277 – Fresh demand; wait for confirmation before long
🟢3310.01 – Minor reaction area
🟢3274.13 – Deeper support if sell-off continues
📉Current Outlook:
Gold broke below multiple internal demand zones, confirming bearish momentum. Now trading inside the 3272–3277 HTF demand. This is a key zone to monitor for reversal or further breakdown.
📈Bullish Scenario:
Price must show bullish confirmation (engulfing/BOS) from 3272–3277 to consider long positions. Without confirmation, bias remains bearish.
⚠️Strategy Tip:
✅Wait for lower-timeframe BOS or CHoCH in green zone
✅Don’t catch falling knives – wait for confirmation
✅SL must go below zone; TP can target 3362 short-term
#XAUUSD #SmartMoneyConcepts #PriceAction #BreakOfStructure #GoldTrading #IntradaySetups #FXFOREVER #DemandZones #WaitForConfirmation

XAU/USD... gold 1h chart pattern.Technical Analysis
1. Trend Overview:
Uptrend Momentum: The market is currently showing bullish strength. The price has broken above key resistance levels, confirming upward momentum.
Higher Highs and Higher Lows: A structure of higher highs and lows supports the uptrend scenario.
2. Entry Point: 3313
This level may have been a breakout point or a retracement zone (e.g., 38.2% or 50% Fibonacci level) acting as a confirmation of bullish continuation.
If volume increased at this level, it adds confidence to the entry.
3. Target Point: 3500
The target suggests an upside potential of +183 pips, which is significant.
This level might align with a major resistance zone or a psychological round number.
4. Support and Resistance Zones:
Immediate Support: 3313 (entry), followed by 3280 and 3250.

Gold Potential Bullish ContinuationGold price still seems to exhibit signs of potential Bullish momentum as the price action may form a credible Higher Low with multiple confluences through key Fibonacci and Support levels which presents us with a potential long opportunity.
Trade Plan:
Entry : 3389.8
Stop Loss : 3345
TP 0.9 - 1 : 3430 - 3434

Gold short For those who missed the 3430$ short there is another chance from 3410$ .
Lets wait for the price action.

bullish tradel'm anticipating gold to buy until it broke the previous high that was set on 21/4/2025. lm anticipating that the market will grab liquidity to the previous high and then make a temporary draw down

XAUUSD (GOLD) | 4H | SWING TRADING Good morning, my friends,
Gold is currently at the 3355.0 level.
Even if gold makes a correction at this point, my target remains 3461.0.
This is a swing trading model, so there may be delays in reaching my target. However, I am confident that I will reach it eventually.
Once we hit that level, I will share an update for you all.
Dear friends, your likes are always my biggest motivation to keep sharing analyses. That’s why I kindly ask each of my followers to show their support—please don’t hold back on the likes.
I sincerely thank everyone who supports me with their likes. It truly means a lot


Gold Rejection at Channel Resistance – Bearish Setup in Play"
🔍 Analysis Summary
Current Price: \~\$3,266
Indicators:
EMA 50 (Red): \~\$3,277 – price is slightly below this level
EMA 200 (Blue): \~\$3,180 – acts as a dynamic support
Trend Structure:
Previous Uptrend: Sharp bullish move within a rising wedge (now broken)
Current Pattern: Descending channel or flag-like consolidation after the strong bullish trend
Support Level: \~\$3,175–\$3,180 (highlighted zone with green arrows showing bounce)
Resistance Level (Target 1): \~\$3,277–\$3,300
Target Point: \~\$3,356
📈 Bullish Scenario:
Price bounced off strong support (around EMA 200 + horizontal level).
If price breaks above the descending channel and retests resistance, it could aim for **Target 1 (\~3,300) and possibly reach **Target Point (\~3,356)**.
📉 Bearish Scenario:
Failure to break above descending channel resistance could lead to a retest of the support zone.
If support breaks, the next possible stop could be below the EMA 200, triggering deeper correction.
🧠 Trading Idea
Buy Entry: On confirmed breakout above descending channel.
Target 1: \~3,300
Target 2: \~3,356
Stop Loss: Below \~3,175 support

XAU/USD Breakdown: Bears in Command
Current Bias: Bearish
Market Structure: Lower highs and lower lows forming post recent peak near $3268.05.
Price Action: Gold recently broke below a key support zone around $3268.05,
Trade Setups
📉 Bearish Setup (Primary Bias)
Entry: On rejection at $3256.24 or a break/retest of $3268.05
Stop Loss: $3272.67
Take Profit:
TP1: $3193.97
TP2: $3102.09
TP3: $3047.62
capital: $50
risk: $46(-96%)
reward: $380(+250%)

GOLD-SELL strategy 3 Hourly chart GANN SQGOLD may have a possible S/H/S pattern, and neckline break was @ $ 3,290 area. This translates to a possible objective $ 3,030. The GANN SQ also shows potential for further weakness in the near-term.
Strategy SELL @ $ 3,250-3,275 and take profit near $ 3,137 on first move down.

GOLD ROUTE MAP UPDATEHey Everyone,
Great start to the week with our chart idea playing out perfectly inline with our plans to buy dips.
We got our bearish targets 3306 and then into the retracement range like we analysed and then the perfect bounce now heading towards our Bullish targets.
We will look for a test and break above 3344 for a continuation or failure to test and lock above this level will se price play back into the lower Goldturns for support.
We will keep the above in mind when taking buys from dips. Our updated levels and weighted levels will allow us to track the movement down and then catch bounces up.
We will continue to buy dips using our support levels taking 30 to 40 pips. As stated before each of our level structures give 20 to 40 pip bounces, which is enough for a nice entry and exit. If you back test the levels we shared every week for the past 24 months, you can see how effectively they were used to trade with or against short/mid term swings and trends.
The swing range give bigger bounces then our weighted levels that's the difference between weighted levels and swing ranges.
BULLISH TARGET
3344
EMA5 CROSS AND LOCK ABOVE 3344 WILL OPEN THE FOLLOWING BULLISH TARGETS
3367
POTENTIALLY 3390
EMA5 CROSS AND LOCK ABOVE 3390 WILL OPEN THE FOLLOWING BULLISH TARGET
3428
EMA5 CROSS AND LOCK ABOVE 3428 WILL OPEN THE FOLLOWING BULLISH TARGET
3458
EMA5 CROSS AND LOCK ABOVE 3458 WILL OPEN THE FOLLOWING BULLISH TARGETS
3478
POTENTIALLY
3503
BEARISH TARGETS
3306 - DONE
EMA5 CROSS AND LOCK BELOW 3306 WILL OPEN THE RETRACEMENT RANGE
3285 - DONE
3259
EMA5 CROSS AND LOCK BELOW 3259 WILL OPEN THE SWING RNGE
3233
3201
EMA5 CROSS AND LOCK BELOW 3201 WILL OPEN THE SECONDARY SWING RANGE
SECONDARY SWING RANGE
3159 - 3112
As always, we will keep you all updated with regular updates throughout the week and how we manage the active ideas and setups. Thank you all for your likes, comments and follows, we really appreciate it!
Mr Gold
GoldViewFX

XAU/USD:Short-term range tradingThe international geopolitical situation has suddenly escalated, triggering market risk aversion and pushing up the price of gold. Today's interest rate decision of the Federal Reserve and Powell's speech will dominate the trend of the bullish and bearish sides. During the Asian trading session, the price of gold has fluctuated sharply. Be wary of a significant pullback after a moderate rise. If the key resistance level of $3400 cannot be broken, the probability of a short-term peak will increase greatly.
In terms of operation, avoid chasing high prices. Focus on the impact of the interest rate meeting on the real interest rate and the US dollar index. Buy on dips within the range of $3360-$3400 and sell at high levels to hedge risks.
I am committed to sharing trading signals every day. Among them, real-time signals will be flexibly pushed according to market dynamics. All the signals sent out last week accurately matched the market trends, helping numerous traders achieve substantial profits. Regardless of your previous investment performance, I believe that with the support of my professional strategies and timely signals, I will surely be able to assist you in breaking through investment bottlenecks and achieving new breakthroughs in the trading field.
