Swing Trading/XAUUSDband trading strategy points out. XAUUSD can be bought on the left side, TP3330-3350.
Aggressive traders can buy at the current price. Conservative traders can wait until the price retreats to around 3300 or below before buying.
The Swing Trading Strategy Center continues to announce trading opportunities. Stay tuned.
USCGC trade ideas

GOLD SELL ANALYSIS The $3266:$3267 sell zone for gold likely refers to a resistance level or a strategic price point where investors or traders are inclined to sell. Several factors could contribute to this sell zone:
- *Resistance Levels*: $3266:$3267 might be a key resistance area, where gold prices have historically faced selling pressure or struggled to break through.
- *Technical Analysis*: Traders may be using technical indicators, such as moving averages, Relative Strength Index (RSI), or Bollinger Bands, to identify $3266:$3267 as a selling opportunity.
- *Market Sentiment*: Shifts in market sentiment, driven by news, economic data, or geopolitical events, could lead to increased selling pressure around $3266:$3267.
- *Profit-Taking*: Investors might be looking to take profits at $3266:$3267, especially if they've seen significant gains in gold

From Tulips to Tech: The Evolution of Financial Bubbles 🎯 Introduction:
financial/economic bubbles are a recurring theme in economic history, this is often when a particular financial asset goes to unrealistic price levels often making money for early investors but usually these high price levels do not match their fundamental value this is then followed by a large public participation who also want a piece of the pie eventually with the price collapsing or sharply declining blowing or living investors in a large financial loss..
From 17th-century tulip gardens to 21st-century crypto manias, one thing has remained constant: Humans never learn.
Every generation thinks this time is different — but the pattern of bubbles keeps repeating.
Here's the crash course in 400 years of financial euphoria, panic, and pain.
🧠 Section 1: 1637 — Tulip Mania 🌷
The original bubble.
In the Netherlands, rare tulip bulbs were worth more than houses.
Prices exploded... then collapsed 90% in a matter of weeks.
Lesson: Speculation + FOMO is not new. Humans were flipping flowers before they flipped crypto.
Mini Nerd Tip:
"When people stop caring about value and only care about price rising, watch out."
🧠 Section 2: 1720 — South Sea Bubble 📜
Britain’s South Sea Company promised massive profits trading with South America (but barely did any business).
Politicians and aristocrats pumped the stock price.
Collapsed spectacularly → ruined many fortunes (including Isaac Newton himself:
"I can calculate the motion of heavenly bodies, but not the madness of men.")
Mini Nerd Tip:
"If a bubble needs government help to stay alive, it's already dying."
🧠 Section 3: 1929 — Wall Street Crash 🏛️
Roaring 20s: endless optimism, cheap margin loans, "stocks only go up!"
1929: Stock market crashed, triggering the Great Depression.
People were buying stocks with 10% down and gambling recklessly.
Mini Nerd Tip:
"When leverage is everywhere, the smallest panic causes waterfalls."
🧠 Section 4: 2000 — Dotcom Bubble 💻
Everyone thought the internet would change everything (it did — but slower and differently).
Companies with no profits were valued in billions.
"Eyeballs" were treated as real revenue.
NASDAQ lost 78% from top to bottom.
Mini Nerd Tip:
"Innovation creates real value... but hype inflates fake value faster."
🧠 Section 5: 2008 — Housing Bubble 🏡
Banks handed out mortgages to anyone.
Financial engineering (CDOs, synthetic MBS) created the illusion of safety.
US housing prices collapsed → global financial crisis.
"Too Big to Fail" became the famous phrase.
Mini Nerd Tip:
"If everyone is getting rich easily, someone is lying or blind."
🧠 Section 6: 2017/2021 — Crypto & Meme Stocks 🚀
Gamestop, Dogecoin, NFTs, Shiba Inu — the wildest "everyone’s a genius" market since the 1920s.
Social media + free apps = amplified bubble speed.
Massive rises, insane collapses.
Mini Nerd Tip:
"Technology changes, human emotion doesn’t."
🧠 Final Section: Why Bubbles Will Never End
Greed, fear, and FOMO are timeless.
Every era dresses up bubbles in new clothes (flowers, sea companies, internet, crypto).
Smart traders understand this pattern — and use it to survive and thrive.
"**Bubbles don't pop because of bad assets. They pop because confidence disappears
put together by : Pako Phutietsile as @currencynerd
courtesy of : @TradingView

Gold under Selling pressureTechnical analysis: Gold is being kept below the Hourly 4 chart’s Resistance zone of #3,292.80 - #3,300.80 despite the rejection on DX and continuous rise on equities, Gold didn’t manage to prepare the terrain for further the uptrend, according to my Technical estimations. Besides the High Selling Volume and evident Price-action showcasing of Bearish trend switch, #3,262.80 Support I mentioned which was about to be tested was invalidated and naturally Gold is on a decline (as I expected it throughout my recent remarks) and is Technicals what's keeping Gold Lower, relative to circumstances. Regardless of that, the Daily chart’s Support (Medium-term) is Trading just few points below, at #3,200.80, if broken it can open doors for #3,127.80 extension and Support mark test and is alone a positive development for Sellers ahead of the end of the Trading week.
My positions: All my Selling order are concluded at this point.

[ TimeLine ] Gold 5-6 May 2025📅 Today is Friday, May 2, 2025
📌 Upcoming Signal Dates:
May 5, 2025 (Monday) or
May 5 & 6, 2025 (Monday & Tuesday)
🧠 Trading Plan & Notes:
✅ Gold has undergone a significant reversal of over 2000 pips, from its ATH of 3500 down to 3200
⚠️ If the upcoming Hi-Lo range is wide, consider reversal entries or setups based on Fibonacci retracement levels
✅ I will personally be trading both signals as part of my research and ongoing strategy
⚠️ If you're risk-averse or uncertain, it’s okay to skip the May 5–6 signals
📋 Execution Plan:
🔹 Wait for the price range from the selected candles to fully form (marked by green lines on the chart)
🔹 Entry will be triggered upon breakout, including a 60-pip buffer
🔹 If SL is hit, cut/switch and double the position on the next valid setup for potential recovery
📉📈 Chart Reference:
🔗 Copy & paste this code into TradingView URL: TV/x/C5zZyXar/

Start buying goldTechnical aspects:
Gold has bottomed out and rebounded after a rapid decline today. It has now stood above 3330. When gold breaks above 3330, it has to some extent broken away from the technical repair structure and began to tend to a bullish pattern in terms of form. Although gold is currently under pressure in the 3350-3360 area, as the center of gravity of gold moves up, the support below has gradually moved up to the 3325-3315 area. So I think there is still room for gold to rise, and it may continue to rebound to the 3345-3365 area.
Trading strategy: Consider going long on gold in the 3330-3320 area, TP: 3345-3365

"Gold Under Pressure: Bearish Continuation Toward $3,200 Zone XAUUSD (Gold/USD) – 1H Chart
📊 Technical Analysis:
Chart Pattern:
The chart shows a clear bearish market structure, with successive lower highs and lower lows forming.
A bear flag or corrective structure broke to the downside, confirming bearish continuation.
There's a clear liquidity sweep near the resistance zone (red area) followed by a rejection, indicating strong seller presence.
Key Levels:
Resistance Zone: 3330–3345 (highlighted in red) – previous support turned resistance (confirmed by blue arrows).
Support Zone: 3202–3223 (highlighted in green) – price is projected to test this demand zone again.
Price Action:
Sharp rejection from the resistance zone with bearish engulfing candles suggests continued selling pressure.
A lower high was recently formed, hinting at a possible final push down to the green zone.
Short-Term Bias: Bearish
Entry: Around 3330–3340
Target: 3220–3205 zone
Stop Loss: Above 3345 (last swing high)
🌍 Fundamental Analysis:
US Economic Data:
Strong recent US employment numbers or hawkish Fed commentary could be strengthening the USD, pressuring gold.
Expectations of higher-for-longer interest rates weigh on non-yielding assets like gold.
Geopolitical Landscape:
Any cooling in geopolitical tensions or a shift away from safe-haven assets can cause further gold weakness.
Inflation Trends:
If inflation shows signs of easing in the US, Fed rate hike expectations decline—currently not the case, maintaining bearish pressure on gold.
DXY Correlation:
The U.S. Dollar Index (DXY) likely remains strong, which inversely affects gold’s value.

Gold Rebounds Amid Geopolitical TensionsOANDA:XAUUSD Gold (XAU/USD) bounced back to $3,330 amid escalating global tensions, including renewed conflicts on the Russia-Ukraine front and flare-ups along the India-Pakistan border. Safe-haven demand supported the rebound, but the upside may be limited as markets watch US-China trade talks and digest the limited US-UK trade deal. Technically, gold remains in a corrective phase below the $3,365 resistance zone. A clean break above this level could trigger a retest of the $3,413 supply zone. Otherwise, bears may drag it back toward $3,289 and $3,239 support. Traders watch closely for clarity from today’s FOMC speakers.
Resistance : $3,330 , $3,364 , $3,413
Support : $3,289 , $3,239

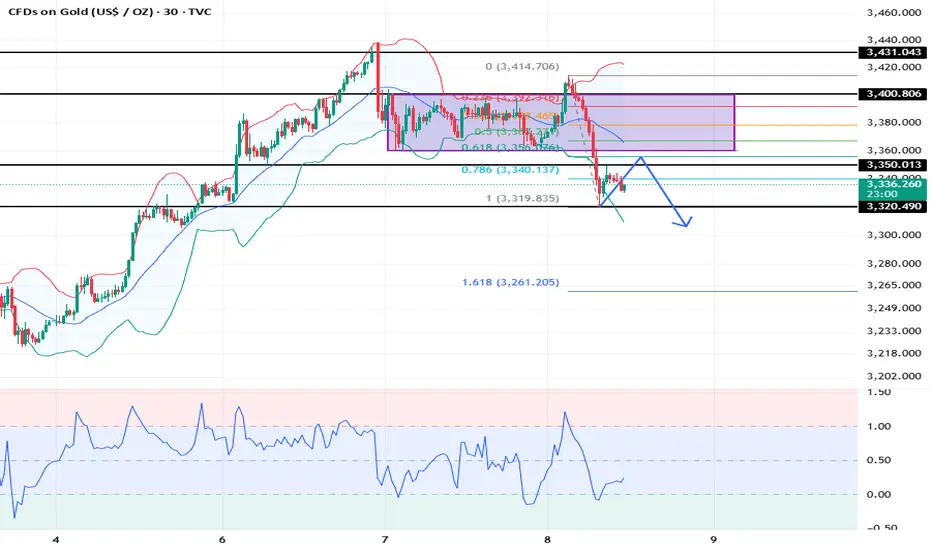
Gold in a Range — Caution for BuyersHey traders and investors!
On the daily timeframe, gold remains in a sideways range (marked by black lines).
The seller's initiative is still active and hasn't reached its target yet.
A seller zone has formed — highlighted by a red rectangle on the chart.
It’s better to look for buy setups around 3260 and 3201-3167.
This analysis is based on the Initiative Analysis concept (IA).
Wishing you profitable trades!

XAUUSD: 8/5 Today’s Market Analysis and StrategyGold technical analysis
4-hour chart resistance level 3410, support level 3310
1-hour chart resistance level 3380, support level 3310
30-minute chart resistance level 3350, support level 3320.
Trump said that he would hold a "large press conference" at 10 a.m. Eastern Time tomorrow, and may sign a trade agreement with the UK. Therefore, the news affected the gold price.
Russia implemented a ceasefire from 0:00 on May 8 to 0:00 on May 11 local time. The temporary ceasefire between Russia and Ukraine and the repeated situation in the Middle East may support the gold price in stages due to the risk aversion demand.
Recently, affected by the news, the daily operation range of gold is very large. Today, we will first look at the 3320-3360 range of fluctuations in the short term. If it breaks through, follow the trend and strictly stop loss!
Buy: 3323 SL: 3318
Sell: 3355 SL: 3360
More free analysis daily sharing
GOLDhe image you provided is a technical analysis of Gold (XAU/USD) on the 15-minute timeframe from TradingView. It clearly reflects a bearish (short) outlook for the coming weeks, potentially lasting until the end of May 2025. Here's a detailed breakdown:
🔍 Technical Context
Gold reached a high around 3,500, followed by a correction that revisited the 3,421 level, creating a strong resistance zone (likely due to liquidity grabs and profit-taking).
From there, the chart shows a potential reversal structure, with expectations of a downward move.
🔻 Bearish Scenario (Short)
The final target for this bearish move is in the 3,124–3,078 area, which represents a key liquidity zone (highlighted with dashed lines and orange horizontal levels).
Before reaching that, the price might test several intermediate support zones:
3,288
3,241
3,124
The current pattern suggests that after a strong upward impulse, the market is now likely taking a breather, possibly influenced by strength in the equity markets, which reduces gold's appeal as a safe haven in the short term.
📅 Expected Timeframe
This downward move is expected to unfold by the end of May 2025, as indicated by the vertical time markers on the chart (one marking May 15th).
📈 Additional Observations
There's a red-green box on the chart indicating the risk/reward zone for the short entry.
The previous bullish trend is marked by clear impulse and correction waves, but the current price action shows loss of momentum and possible reversal signs.

Gold technical analysis and trading strategy
Affected by the hawkish stance of the Federal Reserve and the strengthening of the US dollar, gold has been under pressure and fluctuated recently, but geopolitical risks and the news of Trump's upcoming "major trade agreement" have made market sentiment cautious. Some bulls chose to take profits in the Asian session, and the price fell from the highs, showing a long-short tug-of-war pattern on the technical side.
Technical structure analysis
Although the daily level has a top and bottom structure of long-short transformation, the price still holds steady at 3300, indicating that the medium-term trend has not weakened. The current price is running near the key neckline support, and the 3320-3300 area will become an important defense line for bulls, and the upper 3380-3400 constitutes short-term resistance. The hourly chart shows that the price fell below the lower edge of the previous trading day's oscillation box at 3370, the moving average system is arranged in a short position, and the MACD runs below the zero axis, and the short-term trend is weak. The European and American sessions need to focus on the breakthrough direction of the 3310-3365 range.
Operation strategy suggestions
Short-term trading:
If the price falls back to 3310-3315, try to buy with a light position, stop loss below 3299, target 3340-3350
Rebound to 3360-3365, short under pressure, stop loss above 3375, target 3330-3320
Trend layout:
If the price falls below 3300, short orders can be followed up to 3280-3260
If the price breaks through 3380 resistance, it is expected to restart the upward trend and test above 3400
Risk warning
Focus on the content of Trump's press conference in the evening. Any unexpected details of the trade agreement may cause drastic market fluctuations. It is recommended that traders strictly control their positions and do a good job of stop loss protection. The current market sentiment is sensitive, and the game between technical and news aspects is intensifying, so we need to remain flexible.

Will gold's decline continue?A big negative line closed, covering the previous positive lines, and broke the support of the 5-day and 10-day moving averages. This wave may continue to fall to the Bollinger middle rail near 3300, but if it is a high-level shock, the Bollinger middle rail is not broken, and it may rise again to 3430. Therefore, gold has experienced big ups and downs in this cycle, and now it is possible to rise or fall. In the short cycle, pay attention to the support effect of 3355 under weakness. If it does not break, you can continue to be bullish. Investment strategy: Gold 3350 long, stop loss 3338, target 3450

With the Federal Reserve on hold, gold is ushering in a new engi
At 2 pm yesterday, the Federal Reserve announced that it would keep the benchmark interest rate unchanged at 4.25%-4.50%, in line with market expectations, and remained unchanged for the third consecutive meeting. After the announcement of the Fed's interest rate decision, the market continued to believe that the Fed would cut interest rates before July, and still expected three rate cuts this year.
Then Fed Chairman Powell downplayed any impression that the central bank would use interest rate cuts to ease the economic weakness caused by Trump's tariff policy at a press conference in the early morning.
Powell used the word "wait" 22 times to emphasize that the Fed is not in a hurry. He said: "We think the cost of waiting is quite low, so we are doing it."
Powell said: "In this case, we can't take the initiative because we don't actually know what the correct response to the data is until we see more data."
Powell hinted that the Fed will only cut interest rates after seeing evidence of a significant slowdown in the economy, and it may cut interest rates soon.
Returning to the market, first of all, from the gold daily chart, it can be seen that the current trend of gold is basically similar to that of the first half of the month.
There was a sharp retracement last week, and then the bottom daily line closed with a cross star, followed by a sharp rebound.
The current market is basically copying the previous market. If nothing unexpected happens, if it goes up in this trend, 3500 is very likely not the high point, and it is only a matter of time before a new high is reached.
In addition, from the 4-hour chart, yesterday, the bottom 3360 was tested many times, but it failed to break down. Today, the opening was stretched from 3360 to above 3400.
3360 is a intensive trading area suppression position in the early stage. After breaking through 3360 on Tuesday, it has not fallen below this position so far.
So, we can currently regard 3360 as an important support position.
So we can regard 3360 as the 618 support position, so as to infer the high point position.
As you can see in the picture, I have also marked the point, which is about 3450-60.
Finally, let's look at the hourly chart. You can see that from 3360 to the morning high of 3415, the Fibonacci position 50% position and 382 position are about 3390-85.
It is also about the lowest position of the callback.
In terms of future operations, you can basically rely on 3390-85 to enter the market and do more.
The upper target can basically see the 3440-60 range.

X1: GOLD/XAUUSD Buy Risking1% to make 3.63X1:
Risking 1% to make 3.63%
GOLD/XAUUSD Long for day trade, with my back testing of this strategy, it hits multiple possible take profits, manage your position accordingly.
Risking 1% to make 3.63%
Note: Manage your risk yourself, its risky trade, see how much your can risk yourself on this trade.
Use proper risk management
Looks like good trade.
Lets monitor.
Use proper risk management.
Disclaimer: only idea, not advice

Gold is entering into bearish zoneGold is entering into Bearish Zone after dropping from 3409 level. Bearish zone is below 3366 and it is
expected to go at level of 3297 and below.
Note: This is not a buy/sell trade call.

XAUUSD – 30m Precision Buy from 79% Fib + Liquidity Grab📈 GOLD LONG CONTINUATION – May 7, 2025 | Smart Money Masterclass
Here’s a 🔥 textbook entry on XAUUSD, showing exactly how Smart Money engineered liquidity, tapped into the Fair Value Gap, and launched the price from deep Fib levels.
Let’s break this down like a true Chart Ninja:
🔍 KEY CONFLUENCES IN THIS SETUP:
🧠 FVG Respect: Perfect reaction from the imbalance zone (gray box)
💰 Liquidity Sweep: Triple low fake-out → "Buy-side Engineered Liquidity" ($ symbols)
📉 Descending Trendline Break: Acting as a final bear trap
🧲 Fib Retracement: Entry from deep golden pocket zone (between 70.5% and 79%)
📊 50% EQ Magnet Above: Price reacting towards premium inefficiency
🚀 Risk-Reward Setup: ~1:6 RR targeting imbalance fill around $3435
🏗️ Structure: Price built a base with multiple accumulation candles before break
📈 Trade Details:
🟢 Entry Zone: $3,388 – $3,393 (limit filled within FVG + Fib zone)
❌ SL: Just below 79% zone at $3,386
✅ TP: $3,435 (0% Fib level / top of the range + inefficiency)
📈 RRR: ~1:6 sniper level precision
⚙️ Execution Strategy:
Confirmation entry after inducement wick
FVG + Fib overlap = High probability zone
Optional scaling in across zone: 70.5%, 75%, 79%
First partials around $3,412, full TP at $3,435 zone
💬 Chart Ninja Quote of the Day:
"The best trades don’t chase price—they wait for price to chase them."
🔒 SETUP SUMMARY:
Timeframe: 30m
Bias: Bullish
Entry Type: Limit
Confluences: FVG + Fib + Liquidity Sweep
Trade Type: Reversal from Demand
Confirmation: Structure shift + Clean W bottom
💾 Save this setup and study it frame-by-frame.
📲 Share it with your trading crew who still think breakouts are reliable 😉

XAUUSDHi ,
The market has consistently been rising as indicated in my yesterdays Analysis , The formation of series of HIGHER HIGHS $ HIGHER LOWS from 2nd May - 5Th May. This supports yesterdays idea on testing $3372 and infact went further up to $3380
If the fast EMA (8) is above the SLOW EMA (21) it then further supports the BULLISH COURSE.
If the RSI is hovering above 70 , this indicates the asset been OVERBROUGHT signaling a potential PULLBACK.
The PRICE consolidated before breaking out UPWARD , which indicates a CONTINUATION OF THE BULLISH TREND.
The current WAVES exhibits smooth pullbacks without DEEP CORRECTIONS , signaling STRONG BUYING PRESSURE.
The sudden SURGE in PRICE indicate INCREASING BULLISH MOMENTUM or a possible EXHAUSTION.
OVERALL we should hit $3372-85 and if the price breaks the zone and moves a little further it will signal further BUYS. If the PRICE breaks $3252 going down that should be your FALL CONFIRMATION.
Meanwhile i have a few buy positions active and waiting for further confirmation.

XAUUSD:Sharing of the Latest Trading StrategyToday, all the trading signals finally yielded profits! Check it!👉👉👉
Today, gold has strongly rallied, breaking through the range-bound trading pattern. It climbed to as high as the level of 3,328 at its peak. However, there has been basically no retracement in the price of gold. Thus, it is highly probable that the safe-haven sentiment will be directly released, after which gold will commence its adjustment. Therefore, it is not appropriate to chase the upward trend at this position. Instead, it is advisable to patiently wait for the opportunity of a pullback from the high level. When there is a rebound to a high position, directly go short on gold!
Trading Strategy:
sell@3330-3320
TP:3300-3280
The signals in the Signature have brought about continuous profits, and accurate signals are shared every day. Hurry up and click to get them!
👇 👇 👇 Obtain signals👉👉👉

XAUUSD Hi,
The Price was in an UPTREND before settling for consolidation, The moving Avarage is sloping downward, which indicates POTENTIAL REVERSAL.
We can only have a BULLISH CASE if the price breaks above the CONSOLIDATION RANGE with strong BULLISH CANDLESTICKS.
If the Candlestick Patterns show LONG RED BODIES it suggests STRONG SELLING PRESSURE , But if they begin forming HIGHER LOWS $ HIGHER HIGHS it will then be indicating BUYING PRESSURE.
Using Fibonacci Retracement Levels , We Identified KEY SUPPORT AND RESISTANCE LEVELS, where price might REVERSE or GAIN STRENGTH. The common Levels 38.2 % , 50 % and 61.8% .
if the price retraces to the 38.2% level and bounces , it suggests BULLISH CONTINUATION
if the price drops to the 61.8% level it's a stronger SUPPORT ZONE , indicating POTENTIAL BUY PRESSURE.
A break below 61.8% may signal FURTHER DOWNSIDE.
The pattern formation like DESCENDING CONTRACTING TRIANGLE, FALLING CHANNEL and FALLING WEDGES indicate SELL ENTRIES.
OVERALL we are still on Consolidation and expecting to hit $3292 and then Experience a MINOR MELTDOWN TO at least $3193 and only then we will decide on where the market is headed to.
Will be back with FURTHER UPDATES.

Gold (XAUUSD) Elliott Wave + AO Analysis (1H Chart) – 10 May 20Overview:
This 1-hour chart on XAUUSD highlights a clear 5-wave Elliott impulse, confirmed with Fibonacci extensions and the Awesome Oscillator (AO). Current structure suggests Wave (5) is in play, offering a high-probability short opportunity from the Wave (4) retracement zone.
🧠 Elliott Wave Count:
Wave (1): Initial bearish leg
Wave (2): Minor corrective pullback
Wave (3): Strong impulse confirmed by AO convergence
Wave (4): Corrective structure that respects the top of Wave (1) — valid Elliott structure
Wave (5): Now in progress, supported by AO divergence → momentum weakening
📌 Note: Wave 1 and Wave 3 are commonly measured using AO convergence, validating the strength of the impulse waves. Conversely, Wave 5 is often identified by AO divergence, signaling trend exhaustion.
📐 Fibonacci Extension Targets (Measured from Wave 4):
Expected zone for Wave (5) termination:
1.618 Fib: $3,312.17
2.618 Fib: $3,280.25 (most common)
4.236 Fib: $3,255.05
4.886 Fib: $3,241.30 (extreme extension)
📉 Wave (5) often terminates at 2.618 or 4.236 Fibonacci levels, especially when supported by AO divergence.
📊 AO (Awesome Oscillator) Insights:
✅ Wave (1) to (3): Clear convergence validates impulse
🚨 Wave (5): AO showing divergence = weakening sell momentum
Confirms Wave (5) status and end-stage trend behavior
🛠️ 🔴 Short-Only Strategy: Trade Wave (5) From Wave (4)
Entry Criteria:
Short initiated near the Wave (4) zone (~$3,330–$3,347)
Strong rejection candle (e.g., engulfing, pin bar) or breakdown confirmation
AO turning from green to red or histogram weakening
Stop Loss:
Above Wave (4) high = ~$3,347
Take Profit Levels:
🎯 TP1: $3,312 (1.618 Fib)
🎯 TP2: $3,280 (2.618 Fib)
🎯 TP3: $3,255 (4.236 Fib)
🎯 TP4 (optional final target): $3,241 (4.886 Fib)
Risk Management Tip: Adjust position sizing to align with stop above Wave (4) and TP zones at Fib targets.
🧩 Final Thoughts:
✅ High-probability bearish structure from Wave (4)
🚫 No bullish setups considered — focus is only on shorting Wave (5)
🔍 AO confirms both impulse strength and trend exhaustion via convergence/divergence
📐 Fibs align with standard Wave (5) projections
📈 Chart Context:
Gold (XAUUSD) – 1H timeframe
Indicators: Elliott Wave, AO, Fibonacci
Analysis Date: 10 May 2025
Bias: Bearish only

gold end weekdear all my friends chart is clear.
read it and if you had any question feel free to ask.
Its just good business

XAUUSD As indicated Yest , we were expecting a meltdown which started and didn't finish.
Garnish Pattern Formed in today's CHART indicating probability flying a little bit high,to confirm the flight we should look at $3325 once this level is broken with BULLISH MOMENTUM then we should target the next level @ $3435.
However if we were to confirm our FALL (MELTDOWN) then we should inspect level $3196-99 once this level is broken , then we should wait for a retest and have our ENTRIES and Target $2968 as our TAKE PROFIT zone.
Rising Wedge which we identified on 5/9 09:45. This pattern is still in the process of forming. Possible bullish price movement towards the resistance 3,333.85 within the next 1 hour.
The Bullish momentum seems to be increasing in bits.
Overall we are somehow BULLISH today , until proven otherwise , will be back with further updates as the market continue unfolding.
