Will gold rise or fall this week?Last Friday's non-agricultural data had little impact on the market, and gold is still fluctuating around the range. At present, the gold moving average crosses downward in a short position, and is now under pressure from the 3270 line. 3270 is the turning point for gold bulls and bears. The rise in gold will not be easily reversed for the time being unless there is a big news impact.
USCGC trade ideas

After taking a short position in gold briefly, continue to take From a fundamental perspective, the influence of US data is limited. The market's focus still remains on Trump's tariffs. Subsequently, it is on the geopolitical situations, such as the India-Pakistan conflict, the ceasefire between Palestine and Israel, the Russia-Ukraine negotiations, and so forth.
Analysis of the News Regarding Gold: Gold is rising in a fluctuating manner. Currently, it is trading at around $3,315.44 per ounce, with an increase of approximately 0.92%. This week will witness the interest rate decision of the Federal Reserve, which is expected to dominate the market trend of this week. Additionally, we need to continue paying attention to the relevant news of the international trade situation. After the employment data week, the market's focus has shifted to this week's Federal Reserve's May FOMC meeting.
Judging from the 4-hour chart of gold, after a period of wide-ranging volatile consolidation within the price range of 3,270 to 3,350, the current price has moved to a lower volatile range. Although the two lines of the MACD indicator have issued a golden cross signal, the gold price has broken through the resistance level at 3,300. It is recommended to focus on the resistance effect of this level and pay attention to the effectiveness of the support provided by the MA10 moving average at the lower side.
Trading Strategy:
buy@3259-3270
TP:3303-3330

Gold Intraday Trading Plan 5/5/2025As explained in my weekly post, I will engage selling order at the start of this week. As long as 3270 is held, gold in short term remains bearish.
I am looking for selling signals at around 3246-3250 level.
1st target 3200
final target 3165

GOLD - Is this the end of the Bull Run?Gold has once again followed my previous analysis — turning bearish right at key levels! 🚩 After an incredible bull run where price kept making new highs, signs are now pointing to a possible top. We could be entering a short-term bearish phase here, with potential for a deeper correction if momentum builds.
Right now, I’m holding a bearish bias. I’ll be watching for solid sell setups, especially around those well-defined resistance zones. There’s also an unfilled gap below that could attract price action — keep an eye on that level (chart shows the zone clearly 🔎).
I’ll be looking for confirmation through structure breaks and clean retests before entering shorts.
What’s your take — are we seeing a reversal brewing, or is this just a dip before the next leg up? Drop your thoughts below!
If this analysis helps, a boost or follow would mean a lot — and keeps you in the loop for the next moves! 🚀

XAUUSD 15 MINUTEThis chart is a technical analysis of Gold Spot (XAU/USD) on a 15-minute timeframe. Here's a breakdown of what it shows:
1. Buy Zone: This is a key support area around the 3,320 level, highlighted as a potential entry point for buyers.
2. Arrows and Circles: Indicate previous successful bounces from the buy zone, suggesting it has been a reliable support.
3. Level 1 and Level 2: These are projected resistance zones or price targets where the price may pause or reverse.
4. Target Successful: This is the

Its logical for Gold to touch liquidity zone.Its logical for Gold to touch liquidity zone before continuing uptrend

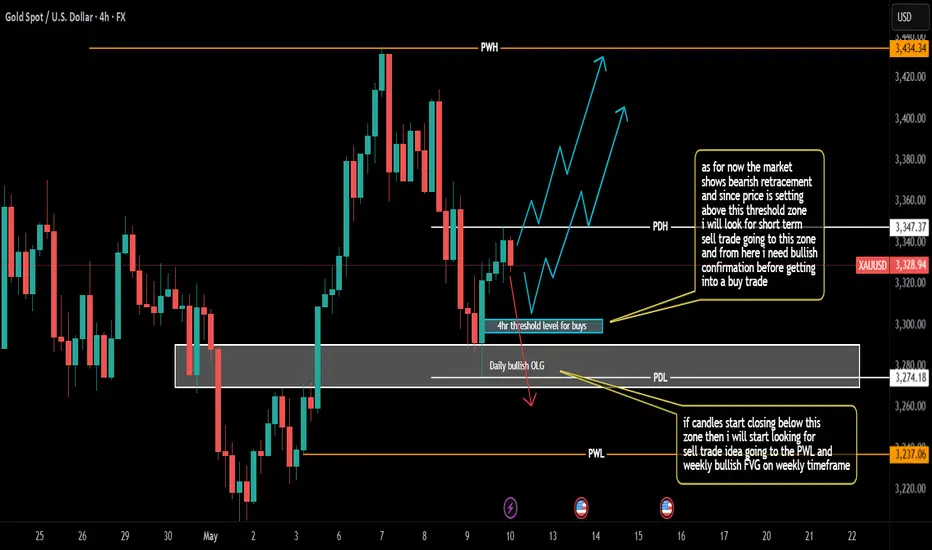
Weekly Analysis on GOLDFor next week trading session i will be looking for both buy and sell opportunities depending on how candles will form.
Will gold fall? Here comes the latest analysis.Technical analysis:
Gold fell rapidly in the morning and then bottomed out and rebounded. When the price broke through $3,324, it began to rise. The weak market will not rebound significantly. When the rebound that engulfed the decline appears, it will continue to rise. However, it should be noted that gold has been fluctuating at a high level for a week. It rose sharply on Monday and Tuesday, fell sharply on Wednesday and Thursday, and it is still fluctuating sharply today.
For the current trading market, I think the price of gold will continue to rise in the fluctuation. After the hourly cycle breaks through the $3,324 position, the market will gradually increase today, and there is room for further upward continuation. I think short-term trading is still mainly long; after the rebound high, you can choose a short strategy.
Action suggestions:
Long strategy: Go long at US$3330, stop loss at US$3320, and take profit at US$3360-3370.
Short strategy: short at $3,365, stop loss at $3,380, take profit at $3,300-3,310.

This is my confirmed target, don't miss it, you will get a greatThis is my confirmed target, don't miss it, you will get a great deal.
GOLD H1 SELL SETUPHere is the gold h1 senario according alchemist we have many levels on this area and also have D1 BPR+sellside orderflow
Sell from this level and sl on previous high target sellside liqudity take trade with proper risk management

Gold 100% Profit SignalYesterday, gold surged and then fell. It was under pressure at 3415 in the early Asian session, and short orders were entered at 3413.6. After rebounding to 3369 in the European session, it was under pressure again, and short orders followed up at 3368.5. The overall trend continued to be extremely weak, breaking 3300 in the late trading and accelerating to 3288. It rebounded to above 3300 in the early morning, and the daily line closed with a long lower shadow positive line, indicating that short-term support is effective, but the rebound momentum is suppressed by the previous wave trend. The current gold price is fluctuating in the 3300-3348 range, with upper resistance of 3348-3352. If it breaks through, be alert to a second surge to 3365; the lower support is 3295-3303. If it loses or falls back to the 3275-3255 area. Trading needs to keep a close eye on the dynamics of key positions.
Operation strategy:
1. It is recommended to short gold when it rebounds to 3340-3345, with a stop loss at 3353 and a target of 3320-3300

3330 is the key, if you can't break through,SHORT3330 is the key, if you can't break through,short
This 15m going to tell us if its fake or break. Have to close above 30. If not, were cooked.

**#XAUUSD H1 – Buy Setup Waiting for Confirmation**---
📈 **#XAUUSD H1 – Buy Setup Waiting for Confirmation**
Previously, the **3330–3329 zone** acted as **strong support**,
and now it’s turning into a **key resistance area**.
📌 What we need:
A **clear bullish H1 candle close above 3330** — only then we will consider our **H1 Buy Setup**.
---
📝 **Trade Plan (upon confirmation):**
* ✅ **Entry:** After bullish H1 close above 3330
* 🛑 **Stoploss:** 3314
* 🎯 **Safer Target:** 3348
* 🎯 **Final Target:** 3369
---
🧘♂️ *Stay patient and wait for proper confirmation above 3329–3330 before entering. Structure comes first.*
---

Technical Breakdown on Gold Spot / USD (XAU/USD) | 1H TimeframeTechnical Breakdown on Gold Spot (XAU/USD) – 1H Timeframe using Volume Profile, Gann, and CVD + ADX
1. Key Observations (Volume, Gann & CVD + ADX Focused)
a) Volume Profile Insights:
Value Area High (VAH): 3,388.2
Value Area Low (VAL): 3,296.7
Point of Control (POC): 3,385.3
High-volume nodes: Dense consolidation between 3,365 – 3,390, indicating institutional activity and balance.
Low-volume gaps: Between 3,340 – 3,360 (inefficient move up, price may revisit).
b) Liquidity Zones:
Stop clusters likely at:
Above 3,388 (previous swing high)
Below 3,300 (recent swing low)
Order absorption areas: Around 3,320 where price stalled with large volume, indicating passive buyers absorbing aggressive sellers.
c) Volume-Based Swing Highs/Lows:
Swing High: 3,388.5 (strong rejection & volume spike)
Swing Low: 3,297.1 (volume bounce support area)
d) CVD + ADX Indicator Analysis:
Trend Direction: Range-bound currently (sideways movement in CVD with weak momentum)
ADX Strength: ADX < 20 → Indicates weak trend or consolidation
CVD Confirmation:
CVD is showing slight bullish divergence vs. price → early demand buildup
Not yet confirmed with strong trend continuation
2. Support & Resistance Levels
a) Volume-Based Levels:
Support:
VAL: 3,296.7
Absorption zone: 3,320.0
Resistance:
VAH: 3,388.2
Swing high: 3,388.5
b) Gann-Based Levels:
Recent swing low: 3,297.1
Retracement levels (from recent high 3,388.5 to low 3,297.1):
1/3 Retracement: 3,327.6
1/2 Retracement: 3,342.8
2/3 Retracement: 3,358.0
3. Chart Patterns & Market Structure
a) Trend: Range-bound (confirmed by ADX < 20 and flat CVD)
b) Notable Patterns:
Potential bullish falling wedge pattern forming
Projection suggests price might bounce from 3,320 toward upper channel (3,370+)
Watch for retest of POC (3,385) for breakout confirmation
4. Trade Setup & Risk Management
a) Bullish Entry (Pending confirmation from breakout and CVD support):
Entry Zone: 3,320 – 3,325 (channel + volume support)
Targets:
T1: 3,342.8 (50% Gann)
T2: 3,385.3 (POC and VAH)
Stop-Loss (SL): Below 3,297 (swing low/VAL)
RR: Minimum 1:2
b) Bearish Entry (If rejection at VAH and CVD turns bearish):
Entry Zone: 3,385 – 3,388
Target:
T1: 3,320.0
Stop-Loss (SL): Above 3,400
RR: Minimum 1:2
c) Position Sizing:
Risk only 1-2% of capital per trade

GOLD 30m Buy Setup | FVG + Fib Discount + Reversal Block🌟 GOLD (XAUUSD) Buy Opportunity | May 9, 2025 | 30m SMC Setup
This GOLD setup on the 30-minute timeframe presents a textbook Smart Money entry. We’ve got a deep retracement into the 61.8% Fibonacci level, clear Fair Value Gap (FVG) demand zone, and a sharp rejection wick + micro reversal block right at the zone.
🔍 KEY CONFLUENCES:
🔻 Deep Discount: 61.8% Fib zone
🟧 FVG block inside key institutional candle
🧱 Reversal block right before the reaction
💥 Aggressive price rejection at 3,297 zone
📈 Targeting premium levels ~3,369.6
🛡️ SL below 70.5% (~3,293.2) — safe under liquidity grab
📈 Setup Specs:
Timeframe: 30min
Direction: Long
Entry Zone: 3,302 – 3,303
TP: 3,369.6
SL: ~3,293.2
RR: Approx. 1:8+
💡 Trade Logic:
Smart Money engineered a sweep of local lows, then left an imbalance (FVG) as the market shifted. The 61.8% retracement + bullish wick combo confirms intent. The reaction is strong — we expect price to fill the inefficiency and target premium liquidity above.
🎯 Chart Ninja Tip:
“Where price pauses, Smart Money loads. Where it explodes, they’ve already finished.”

Break out 3360 and short term downtrend, but be careful🔔🔔🔔 Gold news:
➡️ Gold extended its previous day's pullback, dropping nearly 1% to $3,323 on Thursday as improved risk sentiment weighed on the safe-haven asset. The shift in mood came ahead of an expected announcement by President Donald Trump regarding a trade deal with the UK, scheduled for a 14:00 GMT press conference in Washington, according to sources familiar with the matter.
➡️ Additional overnight momentum came from the Fed's rate decision and comments by Fed Chair Jerome Powell, who highlighted signs of recovery in the U.S. economy.
Personal opinion:
➡️ A US-UK trade deal is the beginning of positive negotiations with other countries. However, the two main characters of the US and China are not yet guaranteed. Therefore, the price of gold may fall because of positive information from tariffs, but that is not all. In addition, the Middle East war and India-Pakistan are still the driving force that keeps gold from falling too much.
➡️ Analysis based on important resistance - support zones and Fibonacci combined with EMA to come up with a suitable strategy
Plan:
🔆Price Zone Setup:
👉Sell Gold 3355 - 3357
❌SL: 3362 | ✅TP: 3351 - 3346 – 3340
👉Buy Gold 3305 - 3307
❌SL: 3300 | ✅TP: 3311 - 3316 – 3322
FM wishes you a successful trading day 💰💰💰

XAUUSD 15 MINUTEThe chart you've provided shows a 15-minute candlestick pattern for Gold Spot (XAU/USD) from OANDA. Here's a quick analysis:
Trade Setup: A short (sell) trade was placed after a rally.
Red Box: Indicates the stop-loss zone (above the entry point).
Green Box: Represents the take-profit zone (below the entry point).
Text "TARGET SUCCESSFUL": Suggests that the price moved downwards and hit the target profit level.
Entry Price: Around 3,357.
Target (Take-Profit): Near 3,332.556.
Stop-Loss: Near 3,368.
This trade was successful, as the price dropped and touched the take-profit zone, exiting before hitting the stop-loss.
Would you like help setting up a similar trade or analyzing another part of the chart?


#XAUUSD BUY NOWThe image is a chart displaying the price of gold in US dollars per ounce over time, with various lines and annotations indicating trends and predictions. The chart appears to be a technical analysis of the gold market, with the user suggesting a potential buying opportunity with a target price of 3500.
Would you like any specific information about the image? Let me know what you'd like to do.

Gold (XAU/USD) slips amid renewed trade optimism; FOMC in focusGold markets are navigating another week of heightened volatility. After a bullish start on Monday and Tuesday, XAU/USD reversed course on Wednesday, with sellers regaining control. The precious metal faced strong rejection at the $3,430 level—an area that also acted as intraday resistance in April as gold attempted to break through all-time highs.
Monday’s surge marked a break from two consecutive weeks of downward pressure, drawing in fresh buyers eyeing a potential retest of the $3,500+ zone. However, ongoing fundamental uncertainties, particularly in U.S.–China relations, continue to drive erratic price action and keep traders on edge.
Trade Talks Reignite Market Volatility
The recent rebound in trade diplomacy has shifted market dynamics once again. U.S. Treasury Secretary Scott Bessent and Trade Representative Jamieson Greer are scheduled to meet Chinese officials in what will be the first formal discussions since the U.S. imposed steep tariffs on Chinese goods. This renewed optimism around trade negotiations triggered a fresh wave of selling in gold on Wednesday.
Despite the pullback, gold remains underpinned by lingering investor caution. Mixed signals from both Washington and Beijing continue to cloud sentiment, while expectations of global monetary easing and a broader move away from U.S. assets provide ongoing support for bullion.
FOMC Decision Looms Large
All eyes now turn to the Federal Reserve’s policy meeting and Chairman Jerome Powell’s press conference later today. With markets already pricing in no change to interest rates, the spotlight will be on Powell’s tone and guidance for the months ahead.
Powell is widely expected to stick to the Fed’s cautious rhetoric, reflecting uncertainty over the economic impact of tariffs. Acknowledgment of sustained economic resilience or inflationary pressure could be perceived as a hawkish signal—dampening hopes of a June rate cut, boosting the U.S. dollar, and likely deepening the correction in gold prices.
Conversely, if Powell hints at heightened economic concerns and signals a potential rate cut in June, gold could regain upward momentum as investors reposition accordingly.

X1: GOLD/XAUUSD Buy Risking1% to make 3.70% | Manage your riskX1:
Risking 1% to make 3.70%
GOLD/XAUUSD Long for day trade, with my back testing of this strategy, it hits multiple possible take profits, manage your position accordingly.
Risking 1% to make 3.70%
Note: Manage your risk yourself, its risky trade, see how much your can risk yourself on this trade.
Use proper risk management
Looks like good trade.
Lets monitor.
Use proper risk management.
Disclaimer: only idea, not advice

GOLD Risky Long! Buy!
Hello,Traders!
GOLD is trading in an uptrend
So despite a local correction
We are bullish biased and
As we are already seeing
A bullish rebound from the
Local horizontal support
Of 3360$ a further
Bullish move up is
To be expected
Buy!
Comment and subscribe to help us grow!
Check out other forecasts below too!
Disclosure: I am part of Trade Nation's Influencer program and receive a monthly fee for using their TradingView charts in my analysis.
