Gold can correct to support level and then continue to move upHello traders, I want share with you my opinion about Gold. After studying this chart, we can track the progression of Gold's price action from strong bullish momentum to its current consolidation. Initially, the market trended confidently inside an upward channel, with steady growth supported by the lower boundary of the channel and occasional corrections after touching the resistance line. Each pullback respected previous support zones, a strong signal of buyer control at the time. The most impulsive move came after the price exited the buyer zone, followed by a clean breakout above the resistance line of the channel. However, once the price entered the seller zone, we saw the momentum start to fade. A strong rejection occurred near the resistance level at 3370, which eventually triggered a series of lower highs and shifted the market into a more neutral, range-bound phase. Currently, Gold is trading inside a defined range between 3205 and 3370. The bottom of this range aligns perfectly with the buyer zone, which already acted as a strong support during the last decline. We can also observe the market beginning to show signs of reversal after tapping the zone again. Given the reaction from the support area and the structure of the range, I expect the price can bounce back and make another attempt to reach the 3370 resistance level, which is my TP1 for this scenario. Please share this idea with your friends and click Boost 🚀
USCGC trade ideas

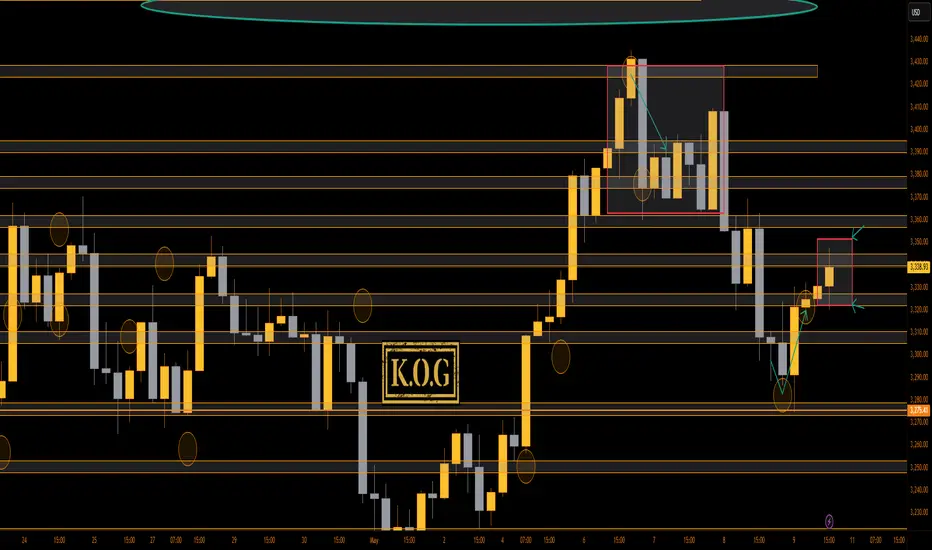
THE KOG REPORT - Update End of day update from us here at KOG:
Nice move early session giving us the low we wanted for an entry long into the target region. We activated higher on Excalibur which also completed and the red box indicator gave us a wonderful performance across all the pairs we took profit on today.
Now we have support at the 3320 region with resistance sitting up at 3350 which will need to break to go higher. We've giving the potential range unless the levels are broken and there is a late session move. Either way, it's been another good week on the markets in Camelot and we'll see you on Sunday for the KOG Report and our view for the week ahead.
Wishing you all a great weekend, please don't forget to hit the boost button for us!
As always, trade safe.
KOG
GOLD BUYGreetings traders this is my analysis on Gold and it is a Long shot for a Buy.
📊 Technical analysis of gold (XAU/USD) — 4h timeframe
🔺 Formation: Head & Shoulders
The pattern is now even more clearly presented with:
Left shoulder – a smaller consolidation move.
Head – a higher peak (higher high).
Right shoulder – a weaker attempt to recover, which confirms the loss of bullish strength.
Usually, such a pattern is followed by a corrective move downwards (which has already been partially seen).
🔄 Potential trend change zone
Highlighted support in the zone:
3,162 – 3,128 USD — very important for confirming the bullish scenario.
The shown "bounce zone" suggests a possible purchase if the price bounces from this area.
📈 Predicted path
Expected:
Fall to support (around 3,150–3,130).
Reversal and continuation of the uptrend.
Target zone: 3,503 – 3,505 USD.
✅ Conclusion and strategy:
Scenario 1 (main): Buy zone between 3,160–3,130 if price action signal is seen (pin bar, engulfing).
Target: 3,500+
Stop loss: below 3,120 (below support).
Scenario 2 (riskier): If price does not bounce from that zone — possible further deepening towards 3,080–3,000.
Dear Traders like,comment let me know what do you think

Gold may break out of the range and rise to 3450GOLD is rising and testing the resistance of the trading range. The important prerequisite is no drop after false breakout. Accordingly, buyers are building up and a close above 3367 may give a chance for a rise
The fundamental situation is changing, Trump is imposing new duties. In addition, gold is reacting to the escalation of the conflict in the Middle East. The metal continues to be a magnet for money
Scenario: A break of range resistance and consolidation above 3367 activates buying. The target of 3407 is 3444

GOLD - Price can bounce up to $3475 points, exiting from pennantHi guys, this is my overview for XAUUSD, feel free to check it and write your feedback in comments👊
A few moments ago price traded inside flat, where it two times broke $3045 levels and then made impulse up.
Price exited from flat and continued to grow inside a pennant pattern, where it later reached $3320 level.
Then Gold broke this level and rose to resistance line of a pennant, and then made a correction to support level, and then broke it.
After this, the price declined to the support line of the pennant, after which it turned around and bounced up.
Gold broke $3320 level and rose to resisance line of pennant, but recently it made correction to this level.
So, now I expect that price can bounce up from this level to $3475, thereby exiting from pennant pattern.
If this post is useful to you, you can support me with like/boost and advice in comments❤️

Gold's Bearish Momentum Builds from PRZ-Short SetupGold ( OANDA:XAUUSD ) started to decline exactly from PRZ (previous idea) as I expected in my previous idea . And with the loss of the Support zone($3,387-$3,357) we can expect further decline.
Gold is currently moving near the Resistance zone($3,387-$3,357 ) and the Potential Reversal Zone(PRZ) .
From the Elliott Wave theory , Gold appears to have completed a five-wave impuls e and we should expect corrective waves . Since the momentum of the second decline that broke the Support zone($3,387-$3,357) is high , the correction is expected to continue and Gold appears to be completing a pullback .
---------------------------------------------
The US Unemployment Claims Index was also released a few minutes ago, and let's take a look and examine the possible impact on Gold .
This better-than-expected data confirms a stronger U.S. labor market , reducing the urgency for the Fed to cut rates anytime soon .
Impact on Gold :
A resilient job market supports the hawkish stance of the Fed , which could keep downward pressure on Gold in the short term as yields and the dollar remain firm.
However, traders should remain cautious and watch for upcoming data and Fed commentary, which could shift the tone.
---------------------------------------------
I expect Gold to start falling from Potential Reversal Zone(PRZ) to the targets I have indicated on the chart. The first target could be around $3,319 .
Note: If Gold touches $3,401(the worst Stop Loss(SL)), we can expect the resistance lines to break and gold to rise further.
Gold Analyze ( XAUUSD ), 1-hour time frame.
Be sure to follow the updated ideas.
Do not forget to put a Stop loss for your positions (For every position you want to open).
Please follow your strategy; this is just my idea, and I will gladly see your ideas in this post.
Please do not forget the ✅' like '✅ button 🙏😊 & Share it with your friends; thanks, and Trade safe.

#XAUUSD: Gold to continue rising,$4000 by end of the year targetGold has unexpectedly declined to 3335 in response to the anticipated price increase following the unfolding conflict in Asia. Currently, two regions exhibit price reversals.
The XAUUSD price is progressing in accordance with our previous analysis. Both analyses have successfully reached the take-profit target, and we anticipate further bullish momentum in the near future. However, price movement is subject to potential reversals in two areas. Both targets are long-term oriented, indicating potential swing moves that may take time to complete. Stop-loss, intraday target, and position decisions should be based on individual analysis and overall market assessment. Strong fundamentals are essential for price to reach the designated target area.
We acknowledge our bias in this analysis, but it does not guarantee the realisation of the described outcome.
Upon trade activation, you can establish two targets. You have the flexibility to select your own take-profit based on your analysis and trade management strategies.
We appreciate your unwavering support.
For those who wish to contribute, we offer several avenues for assistance:
- Liking our ideas
- Commenting on our ideas
- Sharing our ideas
Thank you for your continued support.
If you feel inclined, we would be grateful for your generosity.
Best regards,
Team Setupsfx_❤️🚀

HelenP. I Gold can rebound from trend line to resistance levelHi folks today I'm prepared for you Gold analytics. After forming a local bottom around the 3190 - 3210 support zone, the price has rebounded and is now testing the upward trend line once again. This level has consistently acted as dynamic support throughout the recent bullish structure, confirming its relevance and strength. Buyers have shown clear interest in defending this area, and the reaction near this level further strengthens the bullish sentiment. Notably, the market is recovering from a correction phase that followed the previous local peak near the 3350 - 3370 resistance zone. Price has moved within a wide range, creating opportunities for both accumulation and further upside. The chart also shows how Gold is forming a higher low, which supports the continuation of the current trend. If the trend line continues to hold, I expect the price to move toward the resistance area, with my goal located at 3350 points - the key breakout level. Given the price reaction, support structure, and trend confirmation, I remain bullish. If you like my analytics you may support me with your like/comment ❤️

Hellena | GOLD (4H): LONG to resistance area of 3400.Colleagues, I've redrawn the waves a bit, because it looks like the correction should be over.
I believe that the upward movement will resume soon.
I expect two variants of events:
1) the price will reach the support area 3162, form wave “4” and after that we will see an upward movement - this is a variant of entering a position with pending limit orders.
2) Price has already formed wave “4” and then we will see only upward movement. This is a variant of market entry.
In both cases I expect the price to come to the target in the resistance area of 3400. This is a pretty strong level from which there could be a strong correction.
Manage your capital correctly and competently! Only enter trades based on reliable patterns!

GOLD WEEKLY CHART MID/LONG TERM ROUTE MAPHey Everyone,
Here’s the latest update on our weekly chart setup, which has continued to play out in line with our previous projections.
Recently, price broke above the upper boundary of our Goldturn Ascending Channel a proprietary channelling method designed for greater precision and reduced noise. However, the EMA5 remains within the channel, suggesting the breakout lacks confirmation. For a true continuation to the upside, we’ll need to see the EMA5 close and hold above the channel boundary, which would validate a structural shift in trend strength.
At the moment, price is hovering above the channel, showing signs of support and minor bullish bounces. However, until the EMA5 exits and stabilizes outside the channel, we treat this move with caution.
Price is currently testing the upper channel resistance, a critical decision point on the weekly timeframe. The 3482 level remains key resistance, having previously been rejected via upper wick with no candle body close above. On the downside, 3281 and 3189 are the primary support levels to monitor, both of which align with the channel's midline, a potential zone for consolidation or swing support if price moves sideways and gradually ascends.
In summary, while early bullish momentum is visible, full confirmation of trend continuation requires alignment between price action and the EMA5 behaviour relative to the channel structure.
This is the beauty of our Goldturn channels, drawn using weighted averages instead of pure price action. This unique approach helps us clearly identify fake-outs and real breakouts, cutting out much of the noise that usually confuses traders.
Moving forward, we’ll focus on smaller timeframes (1H and 4H) to buy dips off the weighted Goldturns, aiming for clean 30–40 pip moves. Ranging markets are perfect for this style, allowing us to capitalize on quick moves without getting caught in the chop of larger swings.
Thanks again for all your likes, comments, and follows, we really appreciate the support!
Mr Gold
GoldViewFX

XAU/USD...gold 15m time frame chart pattern..### **Gold Trade Setup (Buy Now)**
- **Entry Price**: 3280
- **Target Price**: 3432 (**+152 points potential profit**)
- **Stop Loss**: 3360 (**-80 points risk**)
### **Key Points:**
1. **Risk-Reward Ratio**:
- **1:1.9** (Reward is nearly twice the risk, which is favorable).
2. **Trade Management**:
- If price moves favorably, consider **trailing the stop loss** to lock in profits.
- Watch for **trend line breaks or resistance tests** near the target.
3. **Confirmation Needed**:
- Ensure the trend line is validated (at least **2-3 touches** for reliability).
- Check for supporting indicators (e.g., **RSI bullish divergence, moving averages**).
4. **Potential Concerns**:
- Stop loss (3360) is **above entry (3280)**, suggesting this might be a **sell-triggered stop loss** (verify if direction is **long/short**).
- If this is a **sell trade**, adjust interpretation accordingly.
### **Actionable Advice**:
✅ **Execute if**: Trend confirms bullish (higher lows, breakout).
❌ **Avoid if**: Price breaks below the trend line before entry.
Let me know if you'd like help refining the setup! 🚀

Gold Breakout and Potential RetraceHey Traders, in today's trading session we are monitoring XAUUSD for a buying opportunity around 3300 zone, Gold was trading in a downtrend and successfully managed to break it out. Currently is in a correction phase in which it is approaching the retrace area at 3300 support and resistance area.
Trade safe, Joe.

GOLD 4H CHART ROUTE MAP UPDATE & TRADING PLAN FOR THE WEEKHey Everyone,
Please see our updated 4h chart levels and targets for the coming week.
We are seeing price play between two weighted levels with a gap above at 3282 and a gap below at 3224. We will need to see ema5 cross and lock on either weighted level to determine the next range. We have a bigger range in play then usual.
We will see levels tested side by side until one of the weighted levels break and lock to confirm direction for the next range.
We will keep the above in mind when taking buys from dips. Our updated levels and weighted levels will allow us to track the movement down and then catch bounces up.
We will continue to buy dips using our support levels taking 30 to 40 pips. As stated before each of our level structures give 20 to 40 pip bounces, which is enough for a nice entry and exit. If you back test the levels we shared every week for the past 24 months, you can see how effectively they were used to trade with or against short/mid term swings and trends.
The swing range give bigger bounces then our weighted levels that's the difference between weighted levels and swing ranges.
BULLISH TARGET
3282
EMA5 CROSS AND LOCK ABOVE 3282 WILL OPEN THE FOLLOWING BULLISH TARGET
3343
EMA5 CROSS AND LOCK ABOVE 3343 WILL OPEN THE FOLLOWING BULLISH TARGET
3404
EMA5 CROSS AND LOCK ABOVE 3404 WILL OPEN THE FOLLOWING BULLISH TARGET
3439
EMA5 CROSS AND LOCK ABOVE 3439 WILL OPEN THE FOLLOWING BULLISH TARGET
3503
BEARISH TARGETS
3224
EMA5 CROSS AND LOCK BELOW 3224 WILL OPEN THE FOLLOWING RETRACEMENT RANGE
3190
3138
EMA5 CROSS AND LOCK BELOW 3138 WILL OPEN THE SWING RANGE
SWING RANGE
3088 - 3046
EMA5 CROSS AND LOCK BELOW 3046 WILL OPEN THE SECONDARY SWING RANGE
SECONDARY SWING RANGE
3015 - 2988
As always, we will keep you all updated with regular updates throughout the week and how we manage the active ideas and setups. Thank you all for your likes, comments and follows, we really appreciate it!
Mr Gold
GoldViewFX

Gold - This is still clearly not over!Gold - TVC:GOLD - just needs a moment to breathe:
(click chart above to see the in depth analysis👆🏻)
It is just incredible how Gold has been rallying lately. Just over the past 1.5 years, Gold is up another +80% and is creating new all time highs every month. Since these strong rallies continue a lot longer than most people think, Gold still has significant upside potential.
Levels to watch: $3.500, $4.000
Keep your long term vision!
Philip (BasicTrading)

XAUUSD COT and Liquidity AnalysisCOT Report Analysis:
If wee look deeper in to the COT data we can see that market makers been
actually selling this rally. Since they had 356K net longs they been taking profits
on the way. Now we can see that shorts are also slightly increasing.
I would be only bearish for now until 3000. May is also one of the strongest months for USD:
Dollar Seasonal Tendencies
Hey what up traders welcome to the COT data and Liquidity report. This is a big part of my FX Trading. Im always trying to trade with the Big players so knowing their positions is good thing.
Please be aware that institutions report data to the SEC on Tuesdays and data are reported on Fridays - so again we as retail traders have disadvantage, but there is possibility to read between the lines. Remember in the report is what they want you to see, that's why mostly price reverse on Wednesday after the report so their cards are hidden as long as possible. However if the trend is running you can read it and use for your advantage.
I created this simple free indicator which you can find in the my scripts. It's highlighting the day of the real report - Tuesday.
Here is the tip if the level has confluence with the high volume on COT it can be strong support / Resistance.
Analysis done on the Tradenation Charts
Disclosure: I am part of Trade Nation's Influencer program and receive a monthly fee for using their TradingView charts in my analysis.
"Adapt what is useful, reject what is useless, and add what is specifically your own."
— David Perk aka Dave FX Hunter ⚔️

GOLD 4H CHART ROUTE MAP UPDATE & TRADING PLAN FOR THE WEEKHey Everyone,
Please see our updated 4h chart levels and targets for the coming week.
We are seeing price play between two weighted levels with a gap above at 3344 and a gap below at 3297. We will need to see ema5 cross and lock on either weighted level to determine the next range. We have a bigger range in play then usual.
We will see levels tested side by side until one of the weighted levels break and lock to confirm direction for the next range.
We will keep the above in mind when taking buys from dips. Our updated levels and weighted levels will allow us to track the movement down and then catch bounces up.
We will continue to buy dips using our support levels taking 20 to 40 pips. As stated before each of our level structures give 20 to 40 pip bounces, which is enough for a nice entry and exit. If you back test the levels we shared every week for the past 24 months, you can see how effectively they were used to trade with or against short/mid term swings and trends.
The swing range give bigger bounces then our weighted levels that's the difference between weighted levels and swing ranges.
BULLISH TARGET
3344
EMA5 CROSS AND LOCK ABOVE 3344 WILL OPEN THE FOLLOWING BULLISH TARGET
3394
EMA5 CROSS AND LOCK ABOVE 3394 WILL OPEN THE FOLLOWING BULLISH TARGET
3438
EMA5 CROSS AND LOCK ABOVE 3438 WILL OPEN THE FOLLOWING BULLISH TARGET
3486
BEARISH TARGETS
3297
EMA5 CROSS AND LOCK BELOW 3297 WILL OPEN THE SWING RANGE
SWING RANGE
3236 - 3176
EMA5 CROSS AND LOCK BELOW 3176 WILL OPEN THE SECONDARY SWING RANGE
SWING RANGE
3088 - 3046
EMA5 CROSS AND LOCK BELOW 3046 WILL OPEN THE SECONDARY SWING RANGE
SECONDARY SWING RANGE
3130 - 3078
As always, we will keep you all updated with regular updates throughout the week and how we manage the active ideas and setups. Thank you all for your likes, comments and follows, we really appreciate it!
Mr Gold
GoldViewFX

HelenP. I Gold will drop to trend line, breaking support levelHi folks today I'm prepared for you Gold analytics. Looking at the chart, we can see how the price has recently formed a narrowing wedge structure after a strong impulsive rally. The price reached a significant peak and then started consolidating, forming lower highs with fading bullish pressure. What we now see is a classic sign of price compression within a pennant pattern. Currently, the market is testing the key resistance zone between 3360 - 3380 points. This area aligns with the upper boundary of the wedge, and the price has already reacted to it multiple times. Buyers were unable to break through convincingly, indicating a potential exhaustion of momentum. Meanwhile, the lower boundary is represented by a dynamic trend line. Given this structure, I expect Gold can decline toward the support trend line and possibly reach 3300 points, my goal. The combination of horizontal resistance, trend weakening, and pattern tightening supports a short bias. Given the recent lower high, the rejection near resistance, and the wedge formation, I remain bearish and anticipate further decline. If you like my analytics you may support me with your like/comment ❤️

How to Trade Gold with AI-Powered Algos in 2025📊 How to Trade Gold with AI-Powered Algos in 2025
A practical action plan for serious gold traders
🔍 1. Know Why Gold Requires Custom Algo Tactics
Gold is volatile, news-sensitive, and driven by macro events like Fed policy, geopolitics, and inflation. Generic stock or crypto bots fail here — gold needs precise, event-aware automation.
🧠 2. Use AI-Powered Bots Trained for Gold Volatility
Deploy bots that adapt to real-time data like CPI releases, bond yields, and geopolitical headlines. Use machine learning models that detect gold breakouts, consolidations, and safe-haven flows.
Top AI algos for gold traders: Multiple systems based on MT4/MT5
Fully-automated, AI-based gold bot with breakout detection, precision entries, and built-in risk control.
⚙️ 3. Build or Choose the Right Algo Strategy for Gold
Trend-Following: Use 21/50 EMA crosses on H1 and H4
Mean Reversion: Bollinger Band fades in range-bound sessions
Breakout Algos: Trigger trades on CPI or FOMC event volatility
Volume-Based AI: Analyze volume spikes vs. historical patterns
🧪 4. Backtest Gold-Specific Models
Always test your bot using historical gold data, especially during NFP weeks, Fed meetings, and geopolitical escalations. Use data from 2018 to 2024 for high-volatility periods.
Tools: TradingView for Pine Script testing, MetaTrader 5 for EA deployment
🛡️ 5. Control Risk with Gold-Specific Parameters
Max drawdown: Keep under 15 percent
Stop-loss: Always use hard stops (not just trailing)
Position sizing: 0.5 to 1 percent of capital per trade
Use volatility filters: Avoid entries during thin liquidity hours
🔄 6. Automate Monitoring and Adaptation
Run multiple bots for breakout, momentum, and reversal setups
Use dashboards to track gold-specific metrics like VIX, USDX, DXY, and 10Y Treasury yields Integrate AI that adjusts parameters after major data releases
🚀 7. Prepare for 2025 Market Structure
Gold is increasingly driven by
Central bank digital currency rollouts
USD de-dollarization risks
Global stagflation or recession themes
DeFi and tokenized gold products
Your algo must factor in these macro narratives using real-time data feeds
📌 Gold Algo Trading Success Plan 2025
Use AI bots built for gold volatility
Trade high-probability breakouts post-news
Backtest with gold-specific macro filters
Maintain strict risk limits with max 15 percent drawdown
Monitor global news and macro data with bot triggers
Continuously optimize and adapt
Gold is not just a commodity — it’s a signal of global risk. Automate smartly, manage risk tightly, and use AI to stay one move ahead.

Learn KEY PRINCIPLES of Technical Analysis in Gold Forex Trading
In the today's article, we will discuss the absolute basics of trading - 3 key principles of technical analysis in Forex & Gold Trading.
1️⃣History Repeats
History tends to repeat itself in the Forex market.
Certain trends are cyclical and may reemerge in a predictable manner, certain key levels are respected again and again over time.
Take a look at the example:
Silver perfectly respected a historical horizontal resistance in 2011 that was respected in 1980 already. Moreover, the price action before and after the tests of the underlined zone were absolutely identical.
2️⃣Priced In
All relevant information about a currency pair: economical and political events, rumors, and facts; is already reflected in a price.
When the FED increased the rate 26th of July by 25 bp, EURUSD bounced instead of falling. Before the rate hike, the market was going down on EXPECTATIONS of a rate hike. The release of the news was already price in.
3️⃣Pattern DO Work
Some specific price models can be applied for predicting the future price movements.
Technicians strongly believe that certain formations - being applied and interpreted properly, can give the edge on the market.
Depending on the trading style, different categories of patterns exist: harmonic patterns, price action patterns, wave patterns, candlestick patterns...
Above, I have listed various price action patterns that are applied by many traders and investors as the main tool for analyzing the financial markets.
If you believe in these 3 principles, you are an inborn technician!
Study technical analysis and learn to apply these principles to make money in trading.
b]❤️Please, support my work with like, thank you!❤️
I am part of Trade Nation's Influencer program and receive a monthly fee for using their TradingView charts in my analysis.

Tariff War Easing Signals: Gold Trend Analysis for Next WeekSince the issue of tariffs broke out, the development of the situation has not been in line with the expectations of the US government. In the face of the escalating trade frictions, the senior officials of the United States have released signals of easing through multiple channels and repeatedly expressed their willingness to hold negotiations with China on issues such as tariffs. After a prudent assessment, China, proceeding from the overall situation of maintaining the stability of bilateral economic and trade relations and promoting the healthy development of the global economy, has decided to engage with the United States.
In fact, there are no real winners in the ongoing standoff of the tariff war. As the world's two largest economies, only by reaching a relatively appropriate solution through negotiation can the fundamental interests of both China and the United States be met. This positive development is bound to significantly reduce the market's risk aversion sentiment. As a traditional safe-haven asset, the price of gold will also be under downward pressure accordingly.
From the perspective of technical analysis, the weekly chart of gold shows that although there was a strong upward pull at the beginning of this week, the daily chart has formed a "big yang front resistance line" pattern. This classic technical pattern indicates that the bullish momentum is close to exhaustion, and the subsequent downside risks have intensified. It is expected that the price of gold will further decline next week. The first support level should be focused on around $3,270. If this level is broken, the price of gold may continue to decline and seek support at the $3,200 level. Investors need to closely monitor the progress of the China-US negotiations and the dynamics of the gold market and adjust their investment strategies rationally.
I am committed to sharing trading signals every day. Among them, real-time signals will be flexibly pushed according to market dynamics. All the signals sent out last week accurately matched the market trends, helping numerous traders achieve substantial profits. Regardless of your previous investment performance, I believe that with the support of my professional strategies and timely signals, I will surely be able to assist you in breaking through investment bottlenecks and achieving new breakthroughs in the trading field.

GOLD DAILY CHART ROUTE MAP UPDATEHey Everyone,
Here’s the latest update on our daily chart idea, it’s been playing out perfectly!
The daily chart is unfolding as projected, with price action respecting the structure of the Goldturn ascending channel. A breakout above the channel was confirmed by the EMA5 crossing and closing above the upper boundary. This move extended to test the 3433 Goldturn axis level, where price met resistance. Notably, EMA5 failed to sustain a close above 3433 Goldturn level, confirming a lack of bullish momentum and validating a rejection. Price has since reversed, re-entering the channel.
Below, broader support is identified around 3104, which aligns with the channel’s half line. While this level may not be reached immediately, the current price range between 3297 and 3104 is significant. We may observe continued consolidation within this zone, with the half line gradually ascending. This dynamic could result in price interacting with the half line earlier than a direct move to 3104, providing potential bounce opportunities best monitored through lower timeframes for refined entries and validations.
This is the beauty of our Goldturn channels, drawn using weighted averages instead of pure price action. This unique approach helps us clearly identify fake-outs and real breakouts, cutting out much of the noise that usually confuses traders.
Moving forward, we’ll focus on smaller timeframes (1H and 4H) to buy dips off the weighted Goldturns, aiming for clean 30–40 pip moves. Ranging markets are perfect for this style, allowing us to capitalize on quick moves without getting caught in the chop of larger swings.
Thank you all again for your continued likes, comments, and follows, we truly appreciate your support!
Mr Gold
GoldViewFX

Gold Bounces After Fake Break — More Upside AheadGold ( OANDA:XAUUSD ) fell to the Support zone($3,280-$3,240) as I posted yesterday ( Full Target) .
Gold started to rise again after making a Fake Break below the Support lines .
Gold is trading above the Resistance zone($3,330-$3,320) .
In terms of Elliott Wave theory , it seems that Bitcoin completed the main wave C with the help of the Ending Diagonal .
Educational note : The Ending Diagonal in Classic Technical Analysis is the Falling Wedge Pattern .
I expect Gold to resume its bullish trend, at least for the short term , and to at least $3,356 .
Note: If Gold breaks the Support lines with high volume, we can expect further declines.
Note: Worst Stop Loss(SL) = $3,031
Gold Analyze ( XAUUSD ), 15-minute time frame.
Be sure to follow the updated ideas.
Do not forget to put a Stop loss for your positions (For every position you want to open).
Please follow your strategy; this is just my idea, and I will gladly see your ideas in this post.
Please do not forget the ✅' like '✅ button 🙏😊 & Share it with your friends; thanks, and Trade safe.

XAU/USD: Bullish Momentum Builds Near Breakout Zone, Key SupportGold (XAU/USD) is gaining strength after rebounding from trendline support, forming a sharp impulsive move and now hovering near a potential breakout zone. Momentum remains bullish, as the price reclaims previous highs and eyes the upper resistance boundary around 3,495.000.
The structure favors trend continuation as long as price remains above the key support zone at 3,345.000, where trendline and previous day’s high converge. A sustained move above 3,400 could confirm a breakout, but the risk of a false breakout remains.
Currently, the price is consolidating above a critical intersection of trendline and horizontal support near 3,300. This level must hold for bulls to retain control. A bounce from this zone would support a move toward the upper resistance, with the next target at 3,495.000. However, a break below 3,345.000 may invalidate the setup and lead to deeper correction
