XAUUSD swing Analysis XAUUSD took support from support line,
All long targets are achieved.
this month taking rejection from major resistence,
Let's track the moves to down.
follow for more swing analysis on INDICES - CURRENCY - COMMODITIES
USCGC trade ideas

Gold Long Term RoadmapUsing multiple 'weight of evidence', Fibonacci, measured moves, support/resistance, distance from moving averages etc, this is what I consider to be the most likely outcome in the next few years.

XAU/USD - Bearish Flag Pattern (25.04.2025)The XAU/USD Pair on the M30 timeframe presents a Potential Selling Opportunity due to a recent Formation of a Bearish Flag Pattern. This suggests a shift in momentum towards the downside in the coming hours.
Possible Short Trade:
Entry: Consider Entering A Short Position around Trendline Of The Pattern.
Target Levels:
1st Support – 3232
2nd Support – 3188
🎁 Please hit the like button and
🎁 Leave a comment to support for My Post !
Your likes and comments are incredibly motivating and will encourage me to share more analysis with you.
Best Regards, KABHI_TA_TRADING
Thank you.

"Gold Ain’t Done Yet – Snipers Don’t Sleep, They Wait After a clean CHoCH from 3205 and bullish NY session push, Gold is currently hovering around 3239 ahead of major macro catalysts tomorrow (May 2):
💼 News to Watch:
NFP (133K vs. 228K prev)
Unemployment Rate
Average Hourly Earnings All releasing between 15:30–17:00 UTC+2, potentially fueling a volatility storm.
We remain in a broader retracement phase after April highs (ATH 3500), with price still sitting in higher timeframe discount zones and internal bullish signs building. However, supply above is unmitigated and could cap rallies.
🔁 MARKET STRUCTURE
Price is currently at 3239, just above a valid H1–H4 support zone.
Clean CHoCH confirmed from 3205
Liquidity still resting both above 3284 and below 3172
🔽 BUY SCENARIOS (From Discount + Liquidity Areas)
🟢 Buy #1 – 3205–3212
🔹 H1 CHoCH zone + internal FVG
🔹 Sell-side liquidity just swept
🔹 Entry if price retests post-NFP drop
⚠️ Ideal for short-term bounce or reaccumulation into 3260
🟢 Buy #2 – 3172–3185
🔹 H4 OB + sweep zone + EQ
🔹 Heavy stop cluster under 3200
🔹 If broken, becomes invalid → eyes move to 3120
🔸 High-risk/reward reversal zone if NFP panic spikes below
🔼 SELL SCENARIOS (From Premium + Imbalance Zones)
🔴 Sell #1 – 3284–3295
🔹 H1–H4 supply + FVG + internal BOS
🔹 Buy-side liquidity just above 3280
🔹 Classic pre-news pump & dump zone
⚠️ Watch for wicks above 3288 → sniper sell trigger
🔴 Sell #2 – 3325–3333
🔹 HTF OB shelf + imbalance + previous NY rejection
🔹 Final retail breakout trap before larger drop
🔹 Cleanest R:R setup if NFP drives price explosively upward
👀 Eyes On:
Zone Reaction Type What to Watch
3220–3235 Bounce or trap Current zone = fragile intraday demand
3284–3295 Rejection or flip Cleanest NY pump trap zone
3172–3185 Final support Below = invalidates bullish scenario short-term
3325–3333 Bull trap zone If reached = extreme precision sell only
🎯 Bias:
LTF: Bullish retrace valid above 3212
HTF: Still bearish under 3330
Macro: Wait-and-react on NFP → NO prediction
📣 Final Note for GoldMinds:
This is not a prediction plan.
It’s a reaction plan.
We mapped the real zones.
Now let the volatility reveal which liquidity gets hit first.
💬 Drop a 🧠 if you’ve evolved past “buy now / sell now” noise.
Let’s hunt like pros — not guess like rookies.

XAUUSD:Sharing of the Trading Strategy for Next WeekAll the trading signals this week have resulted in profits!!! Check it!!!👉👉👉
On Friday, spot gold saw a slight rebound and regained the $3,320 level during the North American trading session. However, it showed a volatile trend throughout the week. The trend for next week remains bullish. The market interprets the US - UK trade agreement as a "hollow agreement". Coupled with Trump's tariff remarks ahead of the upcoming high - level talks among major economies over the weekend, the risk - averse sentiment has heated up again, providing support for the gold price. Pay attention to the support level at $3,300 below. Wait for a pullback to go long.
Trading Strategy:
buy@3300-3320
TP:3340-3360-3400
The signals in the Signature have brought about continuous profits, and accurate signals are shared every day. Hurry up and click to get them!
👇 👇 👇 Obtain signals👉👉👉

XAU/USD H2 AnalysisPrice is moving within a triangle with support having recently been tested and rejected.
We may now see buyers take price higher to test the top of the structure again.
At that point look for a rejection or breakout.
This is a IDEA of what may happen. You should always trade with a profitable strategy and good risk management.

XAUUSD Gold Trade Setup – Buy & Sell Zones | 2H Chart AnalysisThis XAUUSD (Gold vs USD) 2-hour chart analysis outlines a short-term swing trading plan using key supply and demand zones. Price has reacted from the Buy Zone (3197–3216) and is showing signs of bullish reversal. The target is the Sell Zone (3347–3363).
✅ Trade Plan:
🔽 Buy Entry:
Zone: 3,197 – 3,216 USD
Trigger: Bullish candle breakout above the falling trendline
Confirmation: Retest of breakout with bullish price action
🎯 Targets:
TP1: 3,302 (mid-range level)
TP2: 3,347 (Sell Zone bottom)
TP3: 3,363 (Sell Zone top)
🛑 Stop Loss:
Below 3,190 or latest swing low
🔼 Sell Setup (optional):
Zone: 3,347 – 3,363 USD
Look for bearish reversal patterns (e.g., bearish engulfing, double top)
Target retrace back to 3,302 or 3,260 area

XAUUSD SHORT TRADE TECH AGAINST FUNDAMENTALSHighly valuable metal gold has lost its shine even after India Pakistan war tensions. Is tariff war more valuable than real war? Anyways let see how this short analysis go .

XAUUSD SIGNAL READ THE CAPTAINxauusd signal technical analysis satup 👇🏼
(xauusd) buy zone
( TRADE SATUP)
ENTRY POINT (3331) to (3333) 📊
FIRST TP (3340)📊
2ND TARGET (3350) 📊
LAST TARGET (3356) 📊
STOP LOOS (3323)❌
FALLOW RISK MANAGEMENT

XAUUSD | Bullish | Fib RetracementGold has given yet another breakout after a brief accumulation.It has made a good bullish engulfing candle as well at breakout.Mpreover Fib retracement tool is also indicating its bullish run.

XAUUSD Macro & Equity Market Overview:
Global equities are showing signs of fragility following a strong rally, with the S&P 500 down 0.8%, the Nasdaq 100 off 0.9%, and the Dow Jones losing nearly 390 points. Weakness was broad, with Russell 2000 (-1.1%) underperforming, indicating rising risk aversion toward small caps. The CBOE Volatility Index (VIX) spiked 4.7% to 24.76, reinforcing the shift to defensive positioning.
Key drivers include renewed concerns over Trump’s tariff rhetoric, which hit pharma and trade-sensitive sectors, and an apparent stall in momentum after a multi-session rebound. Fed rate expectations remain a key overhang — traders are waiting for the Federal Reserve’s next move while the U.S. 10Y yield holds above 4.31%, showing sticky long-term inflation expectations. Germany’s political instability adds to risk-off sentiment in Europe.
------------------------
Oil (WTI/Brent) – Day Trading Outlook:
Crude oil (WTI) is trading around $58.67, having bounced 4% from recent multi-year lows triggered by OPEC+ supply announcements and economic concerns. The U.S. shale outlook has turned structurally bearish, as noted earlier, with capital expenditure and rig count cuts signaling a near-term production rollover. This underpins a medium-term bullish case.
For intraday traders, today's move matters because oil has recovered above the psychological $58 level, with Brent back at $62.59. Volatility is elevated, and the price action suggests a reversal from oversold conditions. Energy sector ETFs (XLE) were flat despite market-wide weakness, signaling possible rotation back into oil stocks. Watch for upside continuation above $59.50 WTI, with a likely target zone around $61.20–61.80 intraday if risk appetite stabilizes.
-------------------
S&P 500 – Day Trading Outlook: Technically Heavy, Breadth Deteriorating
The S&P 500 closed at 5,606, down 43 points, with negative breadth across almost every major sector. The only strength came from Utilities (XLU +1.2%), underscoring a defensive rotation, while Technology (XLK -0.8%), Financials (XLF -0.6%), and Health Care (XLV -2.8%) led to the downside.
Market internals suggest further downside is likely unless bond yields soften or volatility retreats. The S&P 500 is struggling at 5,600–5,640, and intraday resistance sits at 5,630–5,650. A break below 5,585 opens downside toward 5,545–5,500 in the short term.
Key bearish indicators:
High-yield credit (HYG) is flat to negative.
Small-cap underperformance.
U.S. equity factors: value, core, and growth all showing -0.8% to -0.9% performance in every size bucket.
----------------
XAU didnt change from weekend.
The U.S. 10Y and 30Y yields remain above 4.3% and 4.7% respectively, capping gold’s upside, but risk-off sentiment and volatility (VIX > 24) are providing strong tailwinds.

Gold if..What if Gold get rejected from this trend line again this week? that might be a bearish sign.

GOLD China’s massive gold purchases carry significant geopolitical implications that reshape global economic and financial power dynamics:
1. Dedollarization and Reduced US Dollar Dominance
China’s aggressive gold accumulation is a core part of its strategy to reduce dependence on the US dollar amid rising geopolitical tensions and economic decoupling. By increasing gold reserves-while sharply cutting US Treasury holdings-China aims to insulate itself from dollar-related risks such as sanctions or asset freezes, as highlighted by the 2022 Russia-Ukraine conflict experience. This shift undermines the dollar’s global reserve currency status and supports the emergence of a more multipolar currency system.
2. Enhanced Sovereignty and Financial Security
Gold provides China with a tangible, sovereign asset that cannot be frozen or devalued by foreign powers. This strengthens China’s economic autonomy and resilience against external pressures, especially amid ongoing US-China trade conflicts and Taiwan tensions. Physical gold reserves bolster confidence in China’s currency (yuan) and financial system, helping to back efforts to internationalize the yuan and reduce reliance on Western financial infrastructure.
3. Geopolitical Influence and Economic Restructuring
China’s gold market dominance is part of a broader “economic divorce” from the West, reflecting deglobalization trends and the formation of alternative trading and financial systems led by BRICS and allied nations. By controlling significant gold supplies and refining capacity, China gains leverage in global commodity markets and strengthens its geopolitical influence, challenging US-led economic order.
4. Impact on Global Financial Markets and US Economy
China’s gold buying fuels a “virtuous cycle” for itself but a “vicious cycle” for the US: rising gold prices in dollar terms signal dollar weakness, prompting further diversification away from dollar assets, reducing demand for US Treasuries, pushing US bond yields higher, and increasing US borrowing costs. This dynamic pressures US fiscal stability and economic growth.
5. Strategic Resource Control and Long-Term Planning
The recent discovery of a massive gold deposit in China’s Hunan province (over 1,100 tonnes) further strengthens China’s position, potentially boosting reserves by 44% and reducing reliance on imports. This strategic resource control enhances China’s ability to influence global gold supply and pricing, reinforcing its geopolitical and economic ambitions.

Gold Swing Short Trade Setup**Gold Market Analysis: Potential Reversal Formation**
Gold is finally showing strong signs of a potential top formation after an extended bullish run. After weeks of anticipation, yesterday's price action delivered a significant rejection candle at the psychologically important 3500 level, which could indicate the reversal signal we've been waiting for.
It's essential to recognize that in a robust bullish rally, tops can take longer to form than initially expected, as we've observed recently. The market often exhibits both time and price extensions in such conditions. Nevertheless, the rejection at 3500 in conjunction with the current technical setup suggests that we may be seeing a reversal pattern taking shape.
**Trading Perspective:**
From a trading standpoint, I am currently awaiting a confirmation candle (a follow-up to yesterday's rejection) to validate that the top is in place. If we witness follow-through selling pressure today or tomorrow, it could present an excellent swing short opportunity, with the following targets established:
- **Target 1 (TP1):** 3295
- **Target 2 (TP2):** 3250
- **Target 3 (TP3):** 3200
- **Target 4 (TP4):** 3170
- **Target 5 (TP5):** 3070 (psychological support level)
Stay vigilant and ready for potential short opportunities as the market unfolds. Let’s see if the signals align for a successful trade. Happy trading! OANDA:XAUUSD OANDA:XAUUSD EIGHTCAP:XAUUSD EIGHTCAP:XAUUSD

Technical Breakdown on Gold Spot / USD (XAU/USD) | 1H TimeframeTechnical Breakdown on Gold Spot (XAU/USD) – 1H Chart using Volume Profile, Gann, and CVD + ADX
1. Key Observations (Volume, Gann & CVD + ADX Focused)
a) Volume Profile Insights:
Value Area High (VAH): 3,312
Value Area Low (VAL): 3,230
Point of Control (POC):
High-Volume Nodes: Dense cluster near 3,229–3,250 and again around 3,312
Low-Volume Gaps: Noticeable void between 3,260 – 3,290, suggesting possible fast movement zone
b) Liquidity Zones:
Liquidity Pools:
Order Absorption:
c) Volume-Based Swing Highs/Lows:
Swing High (Volume Spike): 3,312 – area of rejection with reduced follow-through
Swing Low (Reversal Support): 3,230 – heavy volume absorption followed by rally
d) CVD + ADX Indicator Analysis:
Trend Direction: Currently shifting bullish after a prolonged downtrend
ADX Strength: ADX > 20 with DI+ > DI- (early bullish momentum building)
CVD Confirmation:
2. Support & Resistance Levels
a) Volume-Based Levels:
Support:
Resistance:
b) Gann-Based Levels:
Swing Low: 3,230
Retracement Levels:
3. Chart Patterns & Market Structure
a) Trend: Turning bullish (CVD rising, ADX > 20, price forming HLs)
b) Notable Patterns:
Reversal Base formed near 3,230 with upward breakout
Forming ascending channel – prices respecting the lower boundary support
Retest of breakout zone (POC + lower trendline) acting as potential launchpad
4. Trade Setup & Risk Management
a) Bullish Entry (CVD + ADX confirm uptrend):
Entry Zone: 3,240–3,250 (near lower trendline + POC retest)
Targets:
Stop-Loss (SL): 3,225 (below POC + swing low)
RR: Approx. 1:2.5
b) Bearish Entry (Only if trend reversal confirmed):
Entry Zone: Below 3,225 (loss of POC/VAL with CVD breakdown)
Target: T1: 3,200 (psychological + historical support zone)
Stop-Loss (SL): 3,255 (back above POC)
RR: Approx. 1:2
c) Position Sizing:
Use 1–2% capital per trade to manage downside risk

Gold Price Analysis – XAU/USD 4H Chart | Supply Zone Rejection +Gold is currently trading at $3,259, showing signs of rejection from a major supply zone around $3,271 - $3,259, highlighted by LuxAlgo's Visible Range. The price tapped into the high-volume area and faced rejection, signaling potential downside.
Key Levels:
Resistance (Supply Zone): $3,259 – $3,271
Current Price: $3,259
First Support: $3,200 – price previously reacted here.
Second Support: $2,998 – a significant former resistance turned support.
Major Demand Zone: $2,576 – strong institutional buying area.
Bearish Bias If:
Price fails to reclaim the $3,259-$3,271 zone.
Break and close below $3,200 could trigger a move toward $2,998.
Momentum below $2,998 opens a path toward $2,576, especially if macroeconomic data favors USD strength.
Watch For:
Reaction near $3,200 (potential bounce or continuation).
NFP or major U.S. economic data (highlighted on the chart) that could spike volatility.
Trade Idea: Short-term traders may look for short opportunities if the current supply zone holds. Confirmation would be a bearish candlestick close below $3,200.
Risk Management:
Use tight stops above $3,271 to limit exposure. Monitor macro events closely.
---
What do you think – will Gold hold the $3,200 support or break lower? Drop your analysis below!
#Gold #XAUUSD #PriceAction #SupplyAndDemand #TechnicalAnalysis #LuxAlgo #Forex #Commodities #TradingStrategy #ChartAnalysis

Final Leg of Wave 4 Before Wave 5 RallyGold (XAUUSD) is forming a textbook impulsive Elliott Wave structure on the 1-hour chart.
Wave 3 peaked around 3,131 USD, followed by a corrective Wave 4 currently in progress.
Substructure shows wave (iii) ending at 3,150.57 and an expected wave (iv) bounce capped near 3,228–3,198 USD, followed by a final dip.
The projected Wave 4 termination zone lies within the confluence of:
A key demand area: 3,110–3,000 USD
Rising channel support
1.618 Fib extension of Wave A ≈ 2,982.93 USD
A bullish breakout from this zone would mark the beginning of Wave 5, aiming for new highs above 3,360+ USD.
📉 Short-term Bias:
Expect one more drop to complete Wave 4 within the gray demand zone.
📈 Medium-term Outlook:
Anticipating a strong Wave 5 rally once support holds and price breaks the descending resistance trendline.
🔻 Invalidation:
A break below 2,982 USD would invalidate this count and suggest deeper correction.
#XAUUSD #Gold #ElliottWave #Wave4 #Wave5 #TechnicalAnalysis #TradingStrategy #Forex #ICMarkets #PriceAction #1HourChart #FibLevels #BullishOutlook

XAUUSD VIEW FOR UPCOMING WEEK Is the gold going to fall again as PW bearish and showing no strength to down side?

gold next target.perfect flag and pole formation. and seems that it has retested its flag. and
from chart we can see there is a suport near 3050
target of flag and pole seems to be the same

XAUUSD 1st week May 2025After this week continuing its correction to 3202, at the end of the week gold found its support. This has the opportunity as a reversal area to continue its bullish trend.
If Monday could break 3270, it has a strong posibility to reverse.
Goodluck !

Gold is trading at bearish market cycleGold is trading at bearish side of market cycle. Trying to attain its average value by mean reversion. Fundamentally heat of tariff war appears to be settling.

Up for gold!Hi traders,
Last week gold consolidated and dropped. It looks like the b-wave of the correction was a Triangle and now it's in the last Wave c (blue).
For next week we wait for the finish of the correction (Zigzag) into the Weekly FVG and after that we could trade longs again.
Let's see what price does and react.
Trade idea: Wait for the correction to finish and a change in orderflow to bullish to trade longs again.
If you want to learn more about trading FVG's & liquidity sweeps with wave analysis, please make sure to follow me.
This shared post is only my point of view on what could be the next move in this pair based on my technical analysis.
Don't be emotional, just trade your plan!
Eduwave

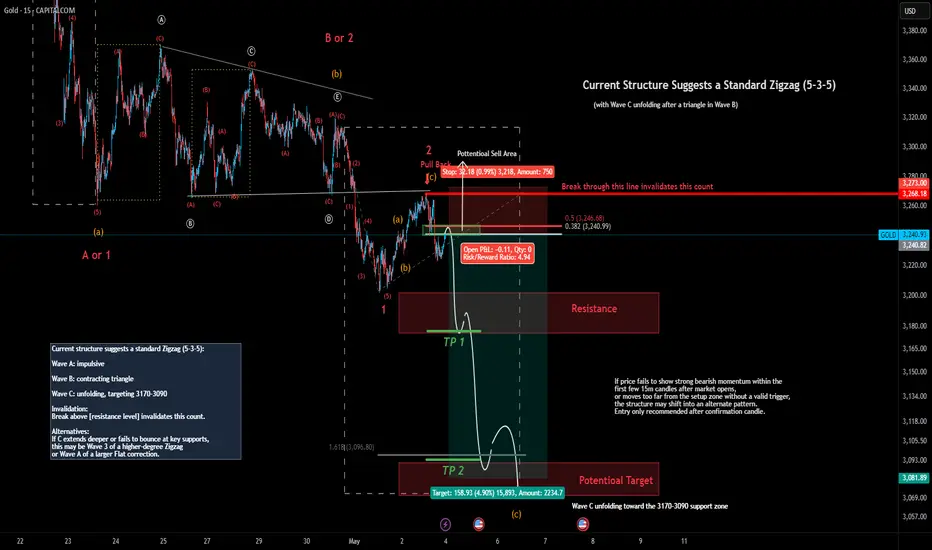
Gold 15m – Bearish Zigzag in Progress or a Larger Correction?This analysis presents a bearish short-term setup on XAUUSD (15m) based on a clean Zigzag structure:
Wave A: Impulsive decline
Wave B: Contracting triangle
Wave C: Currently unfolding, with potential targets at 3170–3090
A potential short entry is highlighted within the yellow zone, with invalidation clearly defined above 3248.
If price accelerates lower after confirmation, the trade offers a favorable R:R setup.
If momentum is weak or price breaks above resistance, this count will be invalidated.
Alternative Scenarios:
This may evolve into Wave 3 of a higher-degree Zigzag,
or Wave A of a larger Flat correction if downside persists beyond expectations.
Let me know your thoughts — would you take this short, or do you see something else unfolding?