Gold professional analysis can help you- Symmetrical Triangle as an corrective pattern in Short Time Frame
- Impulse correction
- Completed " 12345 " Impulsive Waves and " ABC " Corrective Waves
- Break of Structure
- Change of Characteristics
USCGC trade ideas

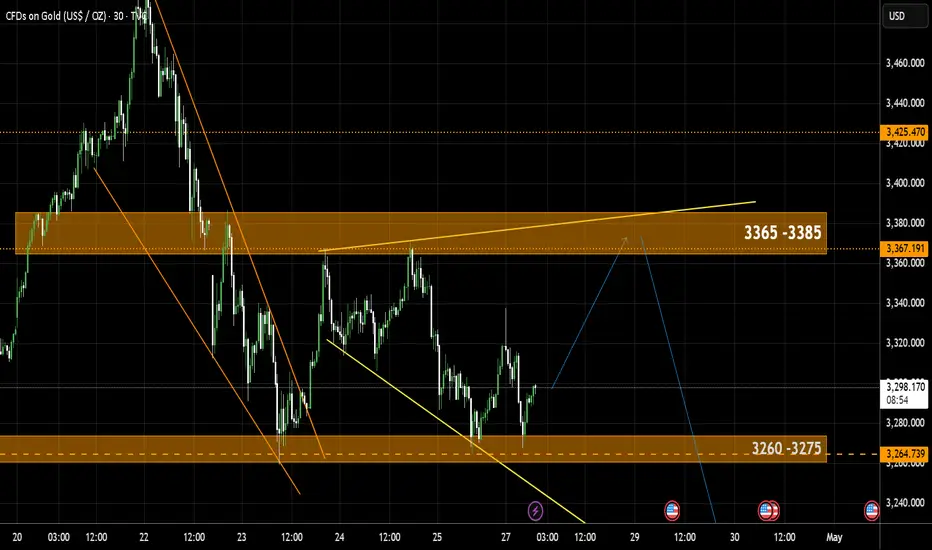
Lingrid | GOLD Market COMPRESSION: Coiling Up Before BREAKOUTOANDA:XAUUSD is forming a potential triangle pattern after bouncing from support near 3,220, where multiple key levels converge. The price is holding above the short-term upward trend-line, showing signs of compression. If buyers defend this area again, we could see a breakout toward the 3,380 resistance. Until then, the pair remains in a consolidation phase.
📈 Key Levels
Buy zone: 3,280 – 3,290
Buy trigger: bounce from trend-line
Target: 3,380
Sell trigger: break below 3,280 with confirmation
💡 Risks
Gold remains sensitive to USD news — strong data can limit upside.
A sudden break of the triangle base may shift bias to bearish.
Volatility expected ahead of key macro releases this week.
Traders, if you liked this idea or if you have your own opinion about it, write in the comments. I will be glad 👩💻

#XAUUSD: 676+ Pips Since Our Last Entry! Comment Your Views! As we explained in our previous chart, the price will retouch 3270$ and then continue the bullish movement. The price did exactly that, with a 674+ increase from our last idea. It’s now on the way towards $3500 or beyond. Get ready for a big move on gold this week, but be extra cautious as the price can be volatile.
Good luck and trade safely!
Thank you for your unwavering support! 😊
If you’d like to contribute, here are a few ways you can help us:
- Like our ideas
- Comment on our ideas
- Share our ideas
Team Setupsfx_
❤️🚀

XAUUSD: Intraday Bullish Move Up To $3400! The OANDA:XAUUSD price has shown strong bullish momentum, indicating it will likely continue to rise above $3400. However, the price is currently volatile and is likely to remain so.
Good luck and trade safely!
Thank you for your unwavering support! 😊
If you’d like to contribute, here are a few ways you can help us:
- Like our ideas
- Comment on our ideas
- Share our ideas
Team Setupsfx_
❤️🚀

Gold depends on GDP numbersTechnical analysis: Gold naturally found Buyers as Buying pressure is evident on the charts from DX on Selling sequence. It is important to note that #3,300.80 is new / old Resistance, which was near Weekly High’s as Price-action could find strong rejection there and deny the Buying response in extension. If broken, Price-action will be calling for #3,327.80 extension once again which represents local Top's for current fractal. I will engage my orders accordingly and wait for suitable entry even though I have closed my order ahead of the final push above the Resistance. However, Gold re-tested and was again rejected on the Hourly 4 chart’s Support keeping the Bullish bias alive. The Engulfing candle Bearish reversal candle on Hourly 1 chart succeeded at rejecting the Price-action and catching already the #32% Fibonacci level. I expect the last Daily chart’s candle to test again the #3,272.80 former Resistance now turned to Support when DX finds the Support zone and engages relief rally.
My position: As mentioned above, Gold is ranging and Scalpers are getting most of the returns out of this Price-action. I will await GDP numbers and only then make my move.

XAU/USD: Weak Support and Potential Reversal in FocusKey Features of the Chart:
Volume Profile Analysis:
The highlighted volume profile on the left shows concentrated trading activity around the 1D POC (Point of Control) at $3,272.200. This suggests the POC is a critical pivot level for the market.
Support Insights:
The horizontal yellow line labeled "Weak Support Because It Has Been Hit So Many Times" at $3,272.200 indicates a crucial support level. However, repeated tests of this level may weaken it, making it susceptible to a breakdown.
Market Sentiment:
The blue arrow suggests a potential upward movement from the current price. This could indicate a bullish bias if buyers defend the support at $3,272.200.
Current Price Action:
The price seems to hover near the weak support, showcasing market indecision. Traders are likely waiting for a clearer breakout or bounce signal.
Trading Plan:
Bullish Case:
If buyers manage to defend the weak support at $3,272.200, a potential rebound could occur.
Traders might consider long positions targeting resistance areas near $3,300 or higher.
Use a stop-loss just below the $3,270 level to manage risks.
Bearish Case:
If the price breaks below the weak support of $3,272.200, expect a bearish continuation toward lower levels, such as $3,250 or $3,200.
Short positions could be considered here, with a stop-loss above the POC.
Closing Thoughts: This chart provides a clear focus on critical support and volume zones. Traders should monitor price action around the 1D POC and weak support level for reliable signals.
Remember: Consistency | Discipline | Perseverance are the keys to staying ahead.

Gold Stuck in Limbo- Sell Rallies, Ride the DropAfter the explosive rally that pushed Gold up to the 3500 area, the market quickly reversed with a sharp sell-off on April 22–23, dropping almost 2500 pips.
Since then, price has entered a consolidation phase.
Initially, the range was between 3270 and 3370, but since yesterday, the range has started to tighten — a classic sign that a breakout is approaching.
Looking at the structure, we’re dealing with a blow-off top followed by a range with clear support and resistance levels. In this context, I lean toward a downside breakout.
The key support is now at 3300 — and a break below it would likely expose 3270 again.
However, I don’t expect the move to stop there. If 3300 is broken, a continuation toward the 3200 zone becomes very likely.
🔹 Trading Plan:
As long as price stays below the 3360–3370 resistance zone, the strategy is to sell rallies, especially when price approaches the upper boundary of the range. Entries can be taken on rejection candles or confirmation patterns near resistance, with stops just above 3370. If 3300 breaks, watch for continuation setups toward 3200.
Only a sustained breakout above 3370 with strong bullish momentum would invalidate the bearish scenario and call for a reassessment.
Disclosure: I am part of Trade Nation's Influencer program and receive a monthly fee for using their TradingView charts in my analyses and educational articles.

Gold another long 3285$ area is a nice long opportunity.
Let us wait for the price action to unfold.

Gold insights: 30-APRIL-2025Rise and shine, traders! Start your day with actionable Gold insights. Let's grow your skills together, one chart at a time.

Gold Short: H&S and Wave 3 downOver here, I've labelled all the waves breakdown as well as drawing a tilted head-and-shoulders. I believe that we are going into a wave 3 (minute degree) that is supported by the formation of the right shoulder.
I expect the neckline to be broken which will then goes down to the first resistance provided by the lower blue trendline.
The next resistance in green will be our first TP target. This is where we can choose to reduce the position, or to adjust the stop loss down in order to ride the position. As the lower target cannot be seen without squeezing the chart and causing the waves breakdowns to be unclear, I will update again when that happens.
The stop loss is above the right shoulder.
Good luck!

Gold Rally Continues (Bullish)XAUUSD (GOLD) 4H chart breaking out from Wave (4) with a clean Elliott Wave structure
Targeting the 3,480+ zone for Wave (5) — Fibonacci + EMA confluence + breakout confirmation all lining up!
Entry zone was right near the 0.5–0.618 fib sweet spot 🟦
Now we ride the wave
Current trade idea: Long bias
🎯 Target: $3,480
🛑 Risk: Below $3,166
🔍 Strategy: Wave theory + EMA trend confirmation + structure break
Let me know if you're in this move too — and drop a 🔥 if you caught the setup!

How to Regain Your Trading MOJOEvery trader, no matter how experienced, eventually hits a rough patch — a period where trades don’t work out, motivation fades, and confidence slips away.
If you feel like you've lost your trading mojo, you're not alone. The key is not to quit but to rebuild it methodically.
Here’s how to get your trading energy back on track:
1. Accept That Slumps Are Normal
First, realize that losing your mojo is part of the trading journey.
Even the best traders experience drawdowns — emotionally and financially.
Acknowledging that this phase is temporary immediately removes some of the pressure and guilt.
Self-acceptance is your first weapon.
2. Reduce Risk and Slow Down
When your confidence is low, lower your position size.
Trade smaller. Risk less.
You don’t need to stop trading completely — you need to stop damaging yourself further.
Think of it as “active recovery,” much like athletes training lightly after an injury.
3. Go Back to Basics
Strip your trading plan down to the essentials:
- Focus on one setup you trust.
- Use clear entry and exit rules.
- Avoid complicated strategies or "revenge trading."
Simplicity restores clarity, and clarity brings confidence.
4. Reframe Losses Mentally
Instead of seeing losses as failures, view them as fees for learning.
Ask yourself after each trade:
- "Was this trade according to my plan?"
- "Did I respect my stop loss?"
If yes, you are winning — even if the trade loses money.
Consistency in good decision-making rebuilds emotional momentum.
5. Visualize the Trader You Want to Be
Take 5 minutes each day to visualize yourself executing perfect trades:
- Calmly analyzing.
- Patiently waiting.
- Executing your plan without emotion.
Your brain needs new emotional associations with trading — not fear and anxiety, but calm and focus.
6. Set Tiny Wins
Don't chase the big win right away.
Set micro-goals like:
- "I will follow my stop loss rules today."
- "I will not overtrade today."
- "I will wait for my setup."
Achieving small wins daily rebuilds your trader identity brick by brick.
Final Thoughts :
Regaining your trading mojo is less about finding a "magic moment" and more about stacking good habits and resetting your mind.
You don't need a new system, a new market, or a lucky break.
You need to reconnect with the disciplined, focused trader within you.
Stay patient, stay structured, and remember — your mojo isn’t lost forever. It’s just waiting for you to catch up. 🚀

Gold Trade plan 29/04/2025Dear Traders,
Gold is still ranging within a triangle pattern. I believe that, considering the dollar index is at a bottom and there’s a potential for a 300-pip rise, gold may come under selling pressure. That said, as long as the price remains inside the triangle, it’s better to stay on the sidelines and wait to see which side the triangle breaks. If there’s an upward breakout, I consider the 3380–3400 area a suitable zone for selling.
if you enjoyed this forecast, please show your support with a like and comment. Your feedback is what drives me to keep creating valuable content."
Regards,
Alireza

Non-agricultural prospective data analysis Operation suggestions📌Fundamentals:
📊Technical aspects:
Technically, spot gold is in a downward trend in the short term, and there is a certain rebound or shock at the key support level. At the 4-hour level, the gold price is running above the lower track of the Bollinger Band, and the opening shows signs of contraction. The MACD indicator dead cross is gradually closing, and the RSI indicator is running in the 35-45 range, showing that the long and short forces are relatively balanced.
🎯Practical strategy:
3260-3270 light position short, target 3225-3200. When it reaches 3225-3200 and stabilizes, try to go long, target 3250-3270.

Next Move PossibleAs of April 29, 2025, the XAU/USD (gold) market remains highly volatile, influenced by geopolitical tensions, economic uncertainty, and central bank policies. Here’s an overview of the current outlook and potential next moves for gold prices:
📈 Current Market Overview
• Record Highs: Gold prices recently reached a record high of nearly $3,500 per ounce, driven by concerns over U.S.-China trade tensions, inflation, and geopolitical instability. 
• Recent Pullback: Following the peak, gold experienced a slight retreat, trading around $3,350 per ounce. This pullback is attributed to easing trade tensions and reassurances from U.S. President Trump regarding Federal Reserve Chair Jerome Powell. 
🔮 Forecast and Key Levels
• Short-Term Support Levels: Analysts have identified key support levels at $3,145, $2,955, and $2,790, based on historical highs and Fibonacci retracement levels. 
• Resistance and Profit-Taking: The $3,500 region is seen as a potential profit-taking point if gold mounts a recovery. 
• Long-Term Outlook: JP Morgan forecasts that gold prices will surpass $4,000 per ounce by Q2 2026, driven by heightened recession risks amid escalating U.S. tariffs and a prolonged U.S.-China trade conflict. Goldman Sachs also revised its 2025 year-end gold price forecast to $3,700/oz, noting that in extreme scenarios, gold could approach $4,500/oz. 
⚠️ Risks and Considerations
• Potential Decline: Morningstar analyst Jon Mills predicts a 38% decline in gold prices over the next five years, potentially falling to $1,820 per ounce, due to increased gold production and waning interest from central banks and investors. 
• Market Volatility: Gold’s status as a safe-haven asset makes it susceptible to sharp price swings in response to economic data releases, central bank decisions, and geopolitical developments.
For more updates follow my profile and share your thoughts.

XAUUSD correcting to its 4H MA200.Gold (XAUUSD) has been trading within a Bullish Megaphone pattern since the start of the year. Last week's rejection on its top (Higher Highs trend-line) has resulted into a break below the 4H MA50 (blue trend-line).
This has technically been the signal that started the previous 2 Bearish Legs, which both bottomed upon touching the 4H MA200 (orange trend-line) and once the 4H RSI got oversold below 30.00.
As a result, we expect more downside, targeting 3160.
-------------------------------------------------------------------------------
** Please LIKE 👍, FOLLOW ✅, SHARE 🙌 and COMMENT ✍ if you enjoy this idea! Also share your ideas and charts in the comments section below! This is best way to keep it relevant, support us, keep the content here free and allow the idea to reach as many people as possible. **
-------------------------------------------------------------------------------
💸💸💸💸💸💸
👇 👇 👇 👇 👇 👇

XAUUSD DAILY PLAN & MARKET UPDATE — APRIL 30, 2025Not predictions. Structure. Logic. Execution.
📍 What Happened:
🔻 3315–3325 SELL → Perfect rejection → Drop of 200+ pips
🔁 Retest at 3314 → Confirmed OB rejection zone
❌ 3284–3288 BUY → Invalidated, BOS clean
✅ 3260–3270 BUY → Real reaction zone. OB + FVG + full discount → Delivered bounce
👁🗨 Eyes On (Into NY Session & May 1):
3315–3325 = Decision zone
→ Break = bullish reversal
→ Rejection = new short trigger
3260–3270 = Key support. If holds = bounce continuation
3252–3244 = Next strong buy zone if 3260 fails
3350 / 3385 = Targets only if bullish breakout occurs post-news
🧠 Current Bias:
🔸 HTF Trend: Consolidation under ATH → bearish-leaning
🔹 LTF Flow: Bearish structure unless 3315 flips
🎯 Bias: Neutral-bearish → shifting bullish only above 3325
📊 KEY LEVELS TO WATCH:
Zone Type Level(s) Commentary
🔻 Resistance 3385 HTF FVG zone / reversal risk
🔻 Resistance 3350 Clean target above breakout
🔻 Resistance 3325 Final barrier before shift
🔻 Flip Zone 3315–3320 Must flip to validate bulls
🔁 Retest 3308–3312 Last OB rejection
⚖️ Mid Zone 3286–3292 Retest structure, weak
✅ Support 3260–3270 Confirmed bounce zone
🟩 Demand 3252–3244 Next high-conviction buy zone
🟢 Discount 3220–3235 Long-term OB zone
🟢 Discount 3192–3205 Extreme discount + FVG
🗓️ MACRO FOR MAY 1:
🗣️ 15:30 Trump Speech
📉 15:30 Unemployment Claims (forecast: 224K)
🏭 15:45 Final Manufacturing PMI
🏭 17:00 ISM Manufacturing PMI + Prices
⚠️ Expect high volatility. Prepare for breakout setups only after structure confirms — not before.
🎯 Final Note:
If 3315–3325 breaks cleanly → we’re heading to 3350 / 3385.
If it holds → we hunt reentry shorts with sniper precision.
This is not a place to guess. It’s where real traders wait.
—
📌 Like plans built on logic, not luck?
Drop a 🧠 if this structure helped you.
🔥 Follow if you're done with signal-chasing and ready to trade like a sniper.

GOLD → The chances of a further decline are growing...FX:XAUUSD continues to test support at 3270 for a breakout. Any de-escalation of the conflict between the US and China could trigger a price drop. But it's not that simple...
Gold under pressure amid tariff war and ahead of US data
On Monday, gold is testing last week's low of $3260, remaining under pressure from a strengthening dollar and easing trade risks between the US and China.
Investors are preparing for the release of key US GDP and labor market data, which could influence expectations for Fed rates. Against this backdrop, the correction in gold could be replaced by growth if macro statistics turn out to be weak and geopolitical risks remain.
Another retest of support could trigger a breakout. It is necessary to monitor the situation between China and the US. Any de-escalation will trigger a decline.
Resistance levels: 3299, 3326
Support levels: 3268.9, 3245, 3232
Since the opening of the session, the potential for a further decline has been exhausted. Gold may strengthen to the indicated resistance zones. A false breakout of 3300/3326 could trigger a decline, which could bring the price closer to the support breakout of 3270.
With respect, R. Linda!

Gold weekly outlookUsing Fibs and regression trend channel, we should see a continuation to the downside with a possible buy in the fibs buy zone potentially rising towards the sell zone.

Bearish and bullish possibility The market created a 4h descending triangle and it broke out and retested but now it seems to be creating an ascending triangle pattern below, if the descending triangle plays out we could see the market reach within the weekly fvg at the 3185 area which will present buying opportunities and if the ascending triangle plays out we could reach the 3387 area, overall we just have to wait and react accordingly

The latest trend of the gold market and operation suggestionsAt present, on the daily chart, gold closed with a medium-sized bearish candle. In the early trading session, it directly broke below the crucial defensive level of 3,370, thoroughly opening up the adjustment range. Meanwhile, it triggered the MACD indicator to form a death cross. Now that the gold price has reached a new low, the dominant strategy for the early trading session is still to sell on rallies.
On the 4-hour chart, in today's early trading session, the price directly broke down and smoothly pierced through the support area ranging from 3,270 to 3,260, realizing the transformation between the top and the bottom. At the 1-hour level, not only has it broken below the previous low of 3,260, but the moving averages have also formed a death cross, indicating strong bearish momentum. It is advisable to sell decisively when the gold price rebounds to around 3,270, which is the densely traded area at the lower part of the recent box consolidation. If the rebound fails to even reach the vicinity of 3,260, in an extremely bearish market situation, the downward space for the gold price will be further expanded.
Overall, for short-term trading of gold, the operation strategy should mainly focus on selling on rallies, supplemented by taking light long positions on pullbacks. Pay close attention to the resistance range from 3,235 to 3,245 on the upside, and closely monitor the support levels from 3,200 to 3,190 on the downside.
XAUUSD
sell@3225-3230
tp:3210-3200
Investment itself is not risky; it is only when investment is out of control that risks occur. When trading, always remember not to act on impulse. I will share trading signals every day. All the signals have been accurate without any mistakes for a whole month. No matter what gains or losses you've had in the past, with my help, you have the hope of achieving a breakthrough in your investment.

GOLD 45M CHART PATTERNChart Pattern: Descending Triangle
A Descending Triangle has formed on the 45-minute timeframe — a powerful bearish continuation pattern that reflects a battle between weakening buyers and increasingly aggressive sellers.
Key structure:
The triangle narrowed over time, indicating volatility compression and building pressure.
Pattern Psychology: As price continued to compress, sellers consistently undercut each bullish rally. Buyers held the line — until they couldn’t. The break below the support level marked the moment of surrender, triggering a wave of selling pressure and confirming the descending triangle’s bearish bias.
Resistance Level: Around $3,270
Post-breakdown, the previous support zone near $3,253–$3,270 has now become resistance. This level also aligns with:
The descending trendline from the pattern.
The recent retest zone where price attempted to recover but failed to break higher.
This area is now a critical ceiling — unless broken with force, it reinforces the bearish outlook and invalidates any short-term recovery attempts.
Target Point: $3,150
Based on the measured move technique, the target for this descending triangle is calculated by taking the vertical height of the triangle and projecting it downward from the breakout point.
Breakout Point: ~$3,265
Extended Target: With increased bearish momentum and no significant support until next structure, price is projected toward the key psychological and technical level of $3,150
