How to Trade Gold with AI-Powered Algos in 2025📊 How to Trade Gold with AI-Powered Algos in 2025
A practical action plan for serious gold traders
🔍 1. Know Why Gold Requires Custom Algo Tactics
Gold is volatile, news-sensitive, and driven by macro events like Fed policy, geopolitics, and inflation. Generic stock or crypto bots fail here — gold needs precise, event-aware automation.
🧠 2. Use AI-Powered Bots Trained for Gold Volatility
Deploy bots that adapt to real-time data like CPI releases, bond yields, and geopolitical headlines. Use machine learning models that detect gold breakouts, consolidations, and safe-haven flows.
Top AI algos for gold traders: Multiple systems based on MT4/MT5
Fully-automated, AI-based gold bot with breakout detection, precision entries, and built-in risk control.
⚙️ 3. Build or Choose the Right Algo Strategy for Gold
Trend-Following: Use 21/50 EMA crosses on H1 and H4
Mean Reversion: Bollinger Band fades in range-bound sessions
Breakout Algos: Trigger trades on CPI or FOMC event volatility
Volume-Based AI: Analyze volume spikes vs. historical patterns
🧪 4. Backtest Gold-Specific Models
Always test your bot using historical gold data, especially during NFP weeks, Fed meetings, and geopolitical escalations. Use data from 2018 to 2024 for high-volatility periods.
Tools: TradingView for Pine Script testing, MetaTrader 5 for EA deployment
🛡️ 5. Control Risk with Gold-Specific Parameters
Max drawdown: Keep under 15 percent
Stop-loss: Always use hard stops (not just trailing)
Position sizing: 0.5 to 1 percent of capital per trade
Use volatility filters: Avoid entries during thin liquidity hours
🔄 6. Automate Monitoring and Adaptation
Run multiple bots for breakout, momentum, and reversal setups
Use dashboards to track gold-specific metrics like VIX, USDX, DXY, and 10Y Treasury yields Integrate AI that adjusts parameters after major data releases
🚀 7. Prepare for 2025 Market Structure
Gold is increasingly driven by
Central bank digital currency rollouts
USD de-dollarization risks
Global stagflation or recession themes
DeFi and tokenized gold products
Your algo must factor in these macro narratives using real-time data feeds
📌 Gold Algo Trading Success Plan 2025
Use AI bots built for gold volatility
Trade high-probability breakouts post-news
Backtest with gold-specific macro filters
Maintain strict risk limits with max 15 percent drawdown
Monitor global news and macro data with bot triggers
Continuously optimize and adapt
Gold is not just a commodity — it’s a signal of global risk. Automate smartly, manage risk tightly, and use AI to stay one move ahead.
USCGC trade ideas

GOLD Technical Analysis - Deeper Pullback in PlayOANDA:XAUUSD remains within a broader ascending channel, but recent price action suggests that the market is undergoing a deeper corrective phase. Following a prolonged bullish rally, price appears overextended and is now pulling back more decisively.
This correction aligns with expectations for a healthy retracement after such strong upward momentum. I anticipate that the pullback will extend further toward the $3,160 level, a key technical level defined by the confluence of horizontal support, ascending trendline support, and the 0.618 Fibonacci retracement of the latest bullish impulse.
This zone will be critical for determining whether the broader bullish structure remains intact. If price holds at this level and shows signs of reversal, it may present a strong re-entry opportunity for buyers. However, a decisive break below this zone would invalidate the current bullish structure and open the door to a deeper correction.
Always confirm your setups and trade with a proper risk management.
Best of luck!

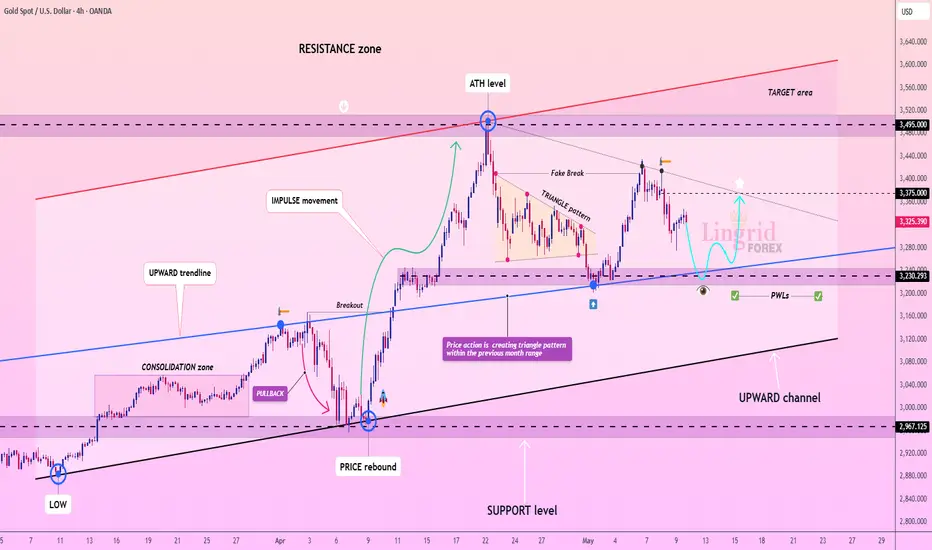
Lingrid | GOLD Weekly MARKET Analysis: CONSOLIDATION PhaseOANDA:XAUUSD has made a positive move but faced resistance at $3,430, with strong support established at $3,250. The market is likely to trade sideways or experience a deeper correction in the near term. A major resistance barrier appears to be forming overhead, making further upside difficult without significant catalysts.
These temporary pullbacks may prove beneficial within what appears to be a longer-term uptrend. It is natural for markets to move sideways and form consolidation patterns after the bullish momentum we've witnessed since the beginning of this year. Therefore, sideways consolidation currently represents the healthiest market reaction.
Last year, we observed similar price action where the market made a bullish move from February through April before consolidating for two months. Current price action suggests we may see consolidation in the form of a triangle pattern before a major catalyst fuels the next market move. Overall, I expect the market to continue moving sideways within the April trading range, with the possibility of a deeper correction.
Traders, if you liked this idea or if you have your own opinion about it, write in the comments. I will be glad 👩💻
DeGRAM | GOLD has reached the channel boundary📊 Technical Analysis
● Chart shows a bullish breakout from the falling wedge into a rising channel. Support near $3,300 held firm, and price is now above the $3,360 pivot, eyeing the $3,430–$3,500 resistance zone. Oscillators on daily chart remain positive, reinforcing the upward bias.
💡 Fundamental Analysis
● Global uncertainty is fueling safe-haven demand: tensions in Ukraine, the Middle East and renewed US-China trade fears are supporting gold.
● A softer US dollar and policy uncertainty also boost bullion; analysts note continued demand keeping prices elevated above $3,000.
● Bank of America highlights that US trade-policy uncertainty will “lend support” to gold prices.
✨ Summary
Upside momentum remains strong, with key support around $3,300–$3,360. Gold’s long bias points toward ~$3,500 in the short term, underpinned by geopolitical risks and a weak dollar.
-------------------
Share your opinion in the comments and support the idea with a like. Thanks for your support!

XAU/USD: Gold will fall ? (READ THE CAPTION)By analyzing the gold chart on the 2-hour timeframe, we can see that on Friday, after the price rose to $3248, it once again faced a correction and eventually closed at $3326. I expect that with the market opening, we’ll see further correction from gold, and the first potential target will likely be the $3213–$3216 area.
The key demand zones are $3253–$3274 and the $3313 level.
The key supply zones are $3355–$3369 and $3395–$3408.
Please support me with your likes and comments to motivate me to share more analysis with you and share your opinion about the possible trend of this chart with me !
Best Regards , Arman Shaban

XAUUSD Daily AnalysisGold long-term trend is still bullish. based on ICHIMOKU the Xauusd is in supposed correction. daily support level (3228) was touched. the price is near important support level (3188).
For next weeks:
Support levels:
3188
3166
Resistance levels:
3351
3381
After that waiting for Ichimoku to give us the exact road map.

Gold (XAU/USD) Analysis – Technical + Fundamental OutlookTechnical Outlook
Gold is currently trading inside a descending channel and has reached the midline, which is acting as dynamic resistance.
📍 Key Levels:
Resistance: 3310 – 3320 (aligned with the midline of the channel) – price has not yet confirmed a breakout above this zone
Next Bullish Targets: 3350 – 3358 / 3385 – 3390
Support Zone: 3270 – 3280 (potential bullish re-entry area)
🟣 All key price levels are marked on the chart with light purple lines for clarity.
🟠 RSI is near 65, showing bullish momentum but approaching overbought territory, signaling a possible short-term pullback.
🔁 Likely scenario: A minor correction toward 3270–3280 followed by continuation toward 3350+ if support holds.
Fundamental Context
The ISM Services PMI came in stronger than expected (51.6 vs. 50.2 forecast), reflecting economic resilience in the U.S. This typically supports the USD and weighs on gold, but:
Rising tariff threats from Trump raise recession concerns.
Services Prices Index rose to 65.1, signaling growing inflation pressures.
These inflation concerns may impact the Fed’s upcoming rate decisions.
Central bank demand and geopolitical risks continue to support gold medium-term.
Summary
Despite being inside a descending channel, gold is showing short-term bullish strength. A confirmed break above 3320 could open the way toward 3350+. Otherwise, a pullback to the 3270–3280 area may offer the next setup.

GOLD (XAUUSD): Retest of ATH Soon!Gold broke through a daily significant horizontal resistance level yesterday and closed above it.
It appears that the bullish trend is likely to continue, with the price expected to retest its all-time high soon.
After reaching this level, be prepared for a potential breakout that could drive prices even higher.

GOLD : This time is different Hello !
No, this time is now different. It was a joke.
*****************************************************
1- Bar pattern of the last bull run is a true way of gold for us. This is almost perfection.
***
2- The objective is 7000-8000$ per once. The top momentum can really hit 10k or 12k if the demand explode, because today, we are in a connected world.
***
3- The top is when Ma deviation is 200% of the 200 MA Monthly in RED like 2011. However, il will update in weekly because is very interesting. You will find below this idea.
***
4- What is the signification for the equity ?
The signification is : No New bullrun until the top of the gold. Probably a consolidation at those levels. However, we are in capital rotation, so, we can easily imagine an explosion of gold if Market drop hard.
***
5- At this level, if you buy now, you can do an easily 100% and maybe 200%.

Gold bulls are coming on strongFrom the 4-hour analysis, gold bulls are making another strong impact. On the top, we pay attention to the short-term suppression at 3385-90 and the suppression at 3400. On the bottom, we pay attention to the short-term support at 3350 and the important support at 3336-40. In terms of operation, we mainly go long on pullbacks. In the middle position, we should watch more and do less, chase orders cautiously, and wait patiently for key points to enter the market.

XAU/USD Market Outlook – Key Levels & Scenarios (May 2025)📊 Market Overview
Asset: XAU/USD (Gold vs. USD) – likely
Timeframe: 🕒 4H or Daily
EMAs:
🔴 50 EMA = 3,281 (short-term trend)
🔵 200 EMA = 3,179 (long-term trend)
🧱 Key Zones
🔺 Main Resistance Zone (🚫 Supply Area)
📍 ~3,320–3,400
🔍 Observation: Strong rejection zone with multiple failed attempts. 🚧 Price struggles to break and hold above here.
⚖️ Mid Support & Resistance Zone
📍 ~3,200–3,250
🧭 Current Action: Price is consolidating here. This is a key decision zone. A bounce or breakdown will likely decide the next big move. 🤔
🟦 Main Support Zone
📍 ~2,980–3,030
🛑 Observation: Major demand zone. If price falls here, it might attract buyers 👥 for a potential rebound.
📉 EMA Analysis
🔴 50 EMA is above 🔵 200 EMA → Trend still technically bullish ✅
🟡 BUT: Price is currently below 50 EMA, showing short-term weakness ⚠️
⚡️ 200 EMA is nearby (~3,179): Acting as dynamic support — a critical bounce zone! 🛡️
🔮 Scenarios
🐂 Bullish Path
✅ If price bounces from 3,200 support zone and reclaims 🔴 50 EMA:
🎯 Target: Retest of 3,320–3,400 🔺 zone
📈 Confirmation: Strong candle closing above 3,281 🔴 EMA
🐻 Bearish Path
🚨 If price breaks below 3,200 & 200 EMA:
🕳️ Expect drop towards 2,980–3,030 🟦 zone
📉 Confirmation: Candle closes below 3,179 with weak retest
✅ Conclusion
📍 Key Level to Watch: 3,200
⚖️ Market Sentiment: Neutral → Bearish bias unless price reclaims 50 EMA
🔒 Risk Tip: Avoid longs until price confirms bullish structure again 🔐

GOLD 4H CHART ROUTE MAP UPDATEHey Everyone,
Once again following on from yesterdays update, this 4 chart is also playing out perfectly. After completing both our Bullish 3343 and bearish 3282 targets; we stated price will play tennis between both levels. We also stated that we will look for ema5 cross and lock on either level to determine the next move.
- Ema5 crossed and locked below 3282 opening 3224. This was hit perfectly today on the drop completing the full retracement range. We will now look for a break below this level to open the swing range or failure to lock below will see a retest on the next Goldturn above. Each weighted level is still also providing the 30 to 40 pip bounces, just like we always state.
We will keep the above in mind when taking buys from dips. Our updated levels and weighted levels will allow us to track the movement down and then catch bounces up.
We will continue to buy dips using our support levels taking 30 to 40 pips. As stated before each of our level structures give 20 to 40 pip bounces, which is enough for a nice entry and exit. If you back test the levels we shared every week for the past 24 months, you can see how effectively they were used to trade with or against short/mid term swings and trends.
BULLISH TARGET
3343 - DONE
EMA5 CROSS AND LOCK ABOVE 3343 WILL OPEN THE FOLLOWING BULLISH TARGET
3404
EMA5 CROSS AND LOCK ABOVE 3404 WILL OPEN THE FOLLOWING BULLISH TARGET
3439
EMA5 CROSS AND LOCK ABOVE 3439 WILL OPEN THE FOLLOWING BULLISH TARGET
3503
BEARISH TARGETS
3282 - DONE
EMA5 CROSS AND LOCK BELOW 3282 WILL OPEN THE FOLLOWING BEARISH TARGET
3224 - DONE
EMA5 CROSS AND LOCK BELOW 3224 WILL OPEN THE SWING RANGE
SWING RANGE
3190 - 3138
EMA5 CROSS AND LOCK BELOW 3138 WILL OPEN THE SECONDARY SWING RANGE
SECONDARY SWING RANGE
3088 - 3046
As always, we will keep you all updated with regular updates throughout the week and how we manage the active ideas and setups. Thank you all for your likes, comments and follows, we really appreciate it!
Mr Gold
GoldViewFX

GOLD OUTLOOK: US–UK Trade Deal in Focus as Tariff Tensions Ease GOLD OUTLOOK: US–UK Trade Deal in Focus as Tariff Tensions Ease — Is War Risk Losing Grip?
The spotlight has shifted.
As geopolitical tensions between India and Pakistan continue to simmer, gold has surprisingly failed to respond with the expected safe-haven spike. Instead, the market’s attention has turned sharply toward global trade negotiations — particularly the latest developments between the United States and the United Kingdom.
🌐 Global Trade Truce: Why It Matters
Recent headlines confirm the UK is one of the first nations to sign a new trade and tariff agreement with the US — easing pressure from global tariff wars and restoring market confidence.
➡️ Result?
The US Dollar (DXY) has staged a meaningful recovery, limiting gold’s upside and reducing short-term bullish sentiment.
While the war narrative is still present, it's the economic diplomacy that’s dominating headlines and price action this week.
📉 Market Reaction: Mixed Signals & Wild Volatility
Recent gold movements have been erratic — sweeping liquidity zones of nearly $100 per ounce in single sessions. This type of behavior reflects deep uncertainty and makes short-term directional trading highly risky.
For now, the priority should be on key H2–H4 zones, with reduced exposure to scalp trades until structure stabilizes.
🔍 Key Levels to Watch (H4 Anchored)
🔻 SELL SCALP
Entry: 3,364 – 3,366
SL: 3,370
TPs: 3,360 → 3,356 → 3,352 → 3,348 → 3,344 → 3,340 → 3,330
🔻 SELL ZONE (Breakout Rejection Area)
Entry: 3,380 – 3,382
SL: 3,386
TPs: 3,376 → 3,372 → 3,368 → 3,364 → 3,360 → 3,350
🟢 BUY ZONE (Mid-Term Support)
Entry: 3,322 – 3,320
SL: 3,316
TPs: 3,326 → 3,330 → 3,334 → 3,340
📌 Strategy Notes:
The European session open has triggered bearish candles — be cautious on BUY setups during London hours.
If you’re holding long positions from earlier this week, consider scaling out around the 3,355 zone.
Keep an eye on upcoming comments from Donald Trump, especially around the new trade framework. These could trigger short-term volatility spikes or broader trend shifts.
🧠 Final Thoughts:
Gold is no longer driven solely by geopolitical unrest — macro narratives are back in control.
With tariff tensions easing and stronger-than-expected USD recovery, traders need to remain flexible, disciplined, and reactive — not predictive.
✅ Focus on clear levels.
✅ Trade with confirmation.
✅ Avoid emotional scalps during uncertainty.
📣 Follow this page for real-time zone updates and structured market reads. Let’s finish this week strong.

GOLD soars, geopolitical risks escalateIn the early morning trading session on Tuesday (May 6), the spot price of OANDA:XAUUSD suddenly jumped more than 50Dollar in the short term. The price of gold just hit 3,387USD/ounce, setting a new intraday high.
Trump's latest tariff announcement has increased risk-off sentiment, thereby pushing the price of gold up sharply.
WASHINGTON (Reuters) - U.S. President Donald Trump said on Sunday he plans to impose a 100% tariff on foreign-made films, extending his restrictive trade policy on U.S. imports to the entertainment industry for the first time, rekindling investor concerns about the potential fallout from a global trade war.
On Monday local time, Trump signed an executive order on biomedical research, hoping to use this opportunity to boost the US pharmaceutical industry. Trump also announced that tariffs on pharmaceutical products will be announced within the next 2 weeks.
Gold is often considered a safe haven in times of uncertainty and performs well in low interest rate environments. Gold prices have soared 26.3% this year and have set new historical records several times.
On the other hand, geopolitical tensions surrounding the conflict between Ukraine and Russia are also escalating as Ukraine actively attacks despite warnings from Russia. On May 9, Russia will solemnly celebrate the 80th anniversary of Victory Day - a significant historical milestone with the participation of many international politicians and military corps from many countries participating in the parade at Red Square.
Geopolitical risks often impact the market very quickly and dramatically, gold prices will increase sharply whenever geopolitical risks appear as dangerous as the current situation in Ukraine - Russia.
Technical analysis of OANDA:XAUUSD prospects
On the daily chart, after gold received support and recovered from the confluence area of EMA21 and 0.50% Fibonacci retracement, gold showed prospects of continuing to recover and entering a new technical bullish cycle, bringing price activity back above $3,300.
At the time of writing, gold has reached the weekly target level sent to readers in the weekly publication at $3,371, which is also the current nearest resistance. Once gold remains stable above the 0.236% Fibonacci retracement level, it will have the prospect of continuing to increase with the next target around $3,400 – $3,430 in the short term.
On the momentum front, the Relative Strength Index (RSI) has turned upward with a significant slope after receiving support from the 50 area, which should be considered a positive signal for further bullish expectations.
Intraday, the technical outlook for gold is bullish with the main support from the EMA21, the notable positions will also be listed as follows.
Support: 3,300 – 3,292 – 3,267USD
Resistance: 3,400 – 3,430USD
SELL XAUUSD PRICE 3409 - 3407⚡️
↠↠ Stop Loss 3413
→Take Profit 1 3401
↨
→Take Profit 2 3395
BUY XAUUSD PRICE 3306 - 3308⚡️
↠↠ Stop Loss 3302
→Take Profit 1 3314
↨
→Take Profit 2 3320

Gold (XAU/USD) 3H Chart Analysis – Bullish Setup Toward $3,500 TCurrent Price: $3,254.26
EMA 70: $3,285.50 (Price is below EMA – cautious zone)
Bias: Bullish 📈 (if demand zone holds)
Key Zones:
🟦 Demand Zone: $3,200 – $3,260
✅ Strong buy interest expected here
⚠️ Good place to look for entry signals
🟥 Resistance Zone: $3,223.60 – $3,323.84
🔄 Price is currently testing this zone
A breakout here can lead to bullish momentum
🎯 Target Point: $3,500 – $3,529 💰
📌 Defined as "Target Point 3500"
High potential for profit-taking here
⛔ Stop Loss: $3,161.32
🚫 Placed below demand zone for risk control
❗ Important to exit if price drops here
Trade Idea 💡
📥 Buy Entry: Near or above $3,223.60
✅ Hold as long as price respects demand zone
🎯 Target: $3,500
⛔ Stop Loss: $3,161.32
⚖️ Risk:Reward ratio looks favorable!
Quick Summary:
🟢 Bullish Setup
💪 Demand zone is strong
📈 Breakout above resistance may fuel a rally
⏳ Wait for confirmation before entry!

Gold – False Break Signals More DownsideIn my commentary yesterday, I highlighted the importance of the 3360 support zone. While Gold initially found a bid around this level, the sharp reversal from the 3415 Asian session high suggests a failed breakout.
Key Observations:
• The quick rejection above 3360 now looks like a false break, reinforcing the bearish outlook.
• The recent high around 3415 appears to be a lower high following the 3500 ATH, confirming potential trend weakness.
• Given this structure, a drop back to at least the 3270 support zone seems highly probable.
Disclosure: I am part of Trade Nation's Influencer program and receive a monthly fee for using their TradingView charts in my analyses and educational articles.

Gold trend analysis: Don't chase the rise in the US marketThe 1-hour moving average of gold begins to turn, so the unilateral decline of gold has temporarily come to an end. However, the rise of gold has reached the key resistance area in the early stage, which is the starting point of the early stage near 3330. It is obviously not appropriate to chase long at this position, so the short-term may begin to adjust. Gold will go short near 3300 in the US market. The market changes rapidly. If gold breaks upward and does not fall back, there will be no opportunity to go long. There is no need to chase gold. Go short first and wait for the decline and adjustment.
Gold strategy: It is recommended to go short at 3325-28, stop loss at 3337, and target at 3308-3295-3280;

GOLD - The Timeless Standard Bitcoin Can Only Dream Of ✨💰
1/ Bitcoin’s Aspirations vs. Gold’s Reality
Bitcoin proclaims to be “digital gold” , promising decentralization and stability. But the truth is clear: while Bitcoin is shaken by extreme wealth concentration and constant media hype, gold has built a centuries-long reputation for trust and enduring value. 🔥🏆
2/ The Digital Gold Revolution
Gold isn’t a relic—it's evolved! 🚀 Today, through blockchain tokenization, you can own digital gold that’s 100% backed by physical gold safely stored in vaults. 🏦🔐 This fusion of ancient value and modern tech shows that gold means business, while Bitcoin just tries to copy its legacy.
3/ Concentration vs. Distribution
Check this out: over 90% of Bitcoin is hoarded by a few whales 🐋, leaving everyday holders with crumbs. In contrast, gold’s market has naturally spread out over centuries of global trade. 🌍📈 This organic distribution reinforces stability and genuine market confidence.
4/ Liquidity, Custody & Security
🔹 Gold Is Easy to Custody
Gold is already stored securely in banks and reputable vaults all over the world, and its ownership transfers digitally. You can withdraw or trade anytime without relying on untrustworthy crypto exchanges or wallets vulnerable to hacks . 🔓💼 Meanwhile, Bitcoin’s security is often subject to risks and platform issues.
5/ Real-World Utility vs. Speculative Hype
Gold isn’t just an asset—it’s a workhorse! ⚙️ From use in electronics to medicine and aerospace, gold’s real-world applications generate organic demand. No aggressive, 24/7 hype machine is needed here. In contrast, Bitcoin runs on media-fueled life support, with bots and influencers relentlessly (and tediously) pushing its narrative . 😴📢
6/ Stability You Can Count On
Gold has weathered economic storms with calm resilience 🌪️➡️☀️, proving itself as the ultimate safe haven. Bitcoin, however, is notorious for its wild 80%+ price crashes, making it a volatile bet for long-term wealth preservation. 🏛️💚
7/ Finite Supply: Strength or Vulnerability?
Bitcoin’s fixed supply is often touted as a key advantage. Yet this scarcity makes it vulnerable to manipulation by a few major holders. 😬 Gold, on the other hand, sees a natural and gradual expansion through mining, ensuring a balanced, organic market flow. ⚖️🌿
8/ Institutional Adoption: Not the Magic Fix
State and corporate Bitcoin deals are usually quiet, behind-the-scenes OTC transactions that rarely impact open market prices. 🤫 Gold’s widespread institutional acceptance is built on centuries of trust and real-world use—no constant screaming into the void required. 📣🚫
9/ Gold: No Need for Hype, Just Legacy
Gold stands proudly without the constant need for promotion. 🌟 Its legacy of stability, digital adaptability, and secure custody speaks volumes. Bitcoin, burdened by relentless crypto spam and hype, can only watch from the sidelines. 🎭🗣️
10/ Invest in Timeless Security
When it comes to long-term wealth preservation, gold is your steadfast asset. It offers proven security, with both digital tokenization and secure physical storage, ensuring smooth withdrawals and trades every step of the way. 🏦🔐 Bitcoin, by contrast, survives on a steady diet of media noise and desperate promotions. 🚑🤖
Gold remains the reliable, time-tested choice in today’s fast-paced world of trends and fleeting hype. Whether you’re safeguarding your wealth or seeking an asset that seamlessly bridges digital innovation with physical security, gold’s enduring legacy is the real deal. 🌟💎
If you’d like to explore how tokenized gold is revolutionizing traditional finance or uncover more about its industrial applications and secure custody mechanisms, there’s always another layer of brilliance waiting to be discovered. 🚀🔍
TVC:GOLD TVC:SILVER INDEX:BTCUSD NASDAQ:MSTR NASDAQ:MARA NASDAQ:COIN CRYPTO:BTCUSD CRYPTOCAP:BTC.D

Gold Analysis: China - U.S Tariffs Talks and NFP ImpactGold Analysis: China - U.S Tariffs Talks and NFP Impact
Earlier today, China's Ministry of Commerce said it signaled a possible easing of tensions in the US-China trade war. Talks are still ongoing and this is creating a softer environment for gold to cool off from its strength.
On the other hand, today we also have the NFP data and, in relation to the data, the market is expected to anticipate a possible rate cut by the FED during the upcoming meeting, as well as new comments regarding their upcoming decisions.
This could be a strong reason why the GOLD continues to lose its bullish momentum.
However, do not forget that it moves up and down in a strange way most of the time. The current situation is bearish and nothing has changed so far. Even if the NFP data will be in line or less than expectations, I do not think that GOLD should rise for this reason. This is gold, it moves when you least expect it to happen
You may find more details in the chart!
Thank you and Good Luck!
❤️PS: Please support with a like or comment if you find this analysis useful for your trading day❤️

#XAUUSD SELL CHART This chart shows a short trade setup for gold (CFDs on Gold, US$/OZ) on the 45-minute timeframe. Here's a breakdown of what it suggests:
Entry Zone: Around the 3,314–3,315 level.
Stop Loss: Above 3,355, indicating the trade gets invalidated if the price breaks above this resistance zone.
Target Point: Near 3,234, aligning with a previous support area.
Risk/Reward Ratio: Looks favorable, with a larger potential reward (green zone) than the risk (red zone).
The yellow arrow suggests expected downward movement after hitting resistance.
Do you want help analyzing whether this setup aligns with current market fundamentals or technical indicators?

XAUUSD Bullish or bearish Detailed AnalysisXAUUSD is currently trading around 3380, continuing its bullish momentum as previously anticipated. The price action has followed the projected path, delivering substantial profits for those positioned early. The next key resistance level is at 3450, aligning with the upper boundary of the ascending channel.
Fundamentally, gold's rally is supported by heightened safe-haven demand amid ongoing geopolitical tensions and a weakening U.S. dollar. Investors are closely watching the upcoming Federal Reserve meeting, with expectations leaning toward a dovish stance, which could further bolster gold prices .
Technical indicators suggest that the bullish trend remains intact, with the price maintaining its position above key moving averages. However, traders should be cautious of potential pullbacks as the market approaches overbought conditions.
In summary, XAUUSD is on track toward the 3450 target, supported by both technical and fundamental factors. Traders should monitor key resistance levels and macroeconomic developments to manage their positions effectively.

Gold - Follow The Macro Trend!Hello TradingView Family / Fellow Traders. This is Richard, also known as theSignalyst.
📈 GOLD has been overall bullish from a macro perspective trading within the rising wedge pattern in orange.
After rejecting the $3,500 round number and upper bound of the wedge, XAUUSD signaled the start of the correction phase as marked by the red falling channel.
Moreover, the $3,100 - $3,150 zone is a strong support.
🏹 Thus, the highlighted blue circle is a strong area to look for buy setups as it is the intersection of support and lower orange trendline acting non-horizontal support.
📚 As per my trading style:
As #XAUUSD approaches the blue circle zone, I will be looking for bullish reversal setups (like a double bottom pattern, trendline break , and so on...)
📚 Always follow your trading plan regarding entry, risk management, and trade management.
Good luck!
All Strategies Are Good; If Managed Properly!
~Rich
Disclosure: I am part of Trade Nation's Influencer program and receive a monthly fee for using their TradingView charts in my analysis.

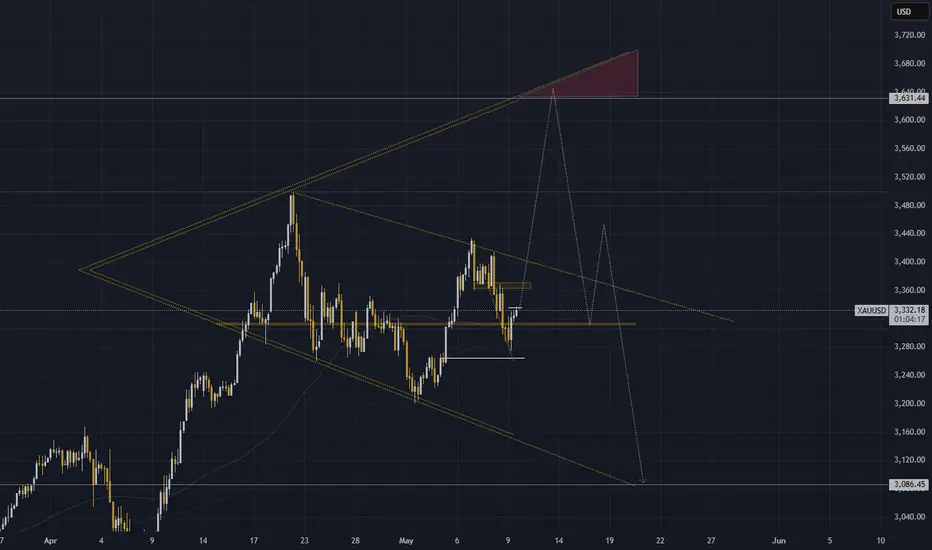
Gold heading to 3631 & then drop to 3086 As we can see, gold remains in a positive trend on both the daily and weekly charts. However, we're starting to observe emerging negative signals — both technically and politically. This presents what I believe is a good buying opportunity in the short term, followed by a potentially very strong selling opportunity once the upside momentum fades