Bearish GoldLooking to retest 3165 level, very important level since it was broken and never retested. A break thereof might lead to lower levels
USCGC trade ideas

XAUUSD BuyHello traders!
There’s an ideal buying opportunity on XAUUSD right now. I’ve activated a Buy position to take advantage of this setup.
The TP target is **3262.58** and the SL level is **3242.65**.
Make sure to adjust your lot size and risk according to your trading plan, and enter the trade with discipline.
🔔 I post detailed trade ideas and daily market analysis like this every day on my TradingView profile.
👉 Follow me to get notified and read the full breakdowns.

GOLD/USD Short-Term Bullish Setup – Final Wave 5 ExpectedAs per the current 30-min chart, Gold appears to be completing its corrective structure and is now poised for a bullish reversal. Key observations:
🔹 Support Zone:
Gold has respected the 78.6% Fibonacci retracement level (~3210), showing strong demand in this region. This marks the potential base of the upcoming 5th Elliott wave.
🔹 Trigger Level:
Price needs to break and sustain above 3240 to confirm bullish momentum. This is the neckline of the current consolidation and serves as the breakout zone.
🔹 Wave Projection:
We anticipate Gold to initiate Wave 5, the final impulsive move in the current sequence. A clear breakout above 3240 may trigger a rally towards 3300 / 3360 / 3420 in the short term.
🔹 Strategy:
Wait for a bullish candle close above 3240 to confirm breakout. Aggressive traders may initiate early positions near 3210 with tight stop-losses.
📌 Key Levels:
Support: 3210–3200 (78.6% Fib)
Breakout: 3240
Targets: 3300 / 3360 / 3420
🔻 Invalidation:
Break below 3200 would invalidate this bullish count and suggest deeper correction.
💬 Gold is gearing up for its final bullish thrust. Monitor 3240 zone for breakout confirmation. Keep risk managed!
❗ Disclaimer:
This analysis is for educational and informational purposes only. It does not constitute investment advice or a recommendation to trade. Always do your own research and consult your financial advisor before making trading decisions.

GOLD: Bullish Continuation & Long Trade
GOLD
- Classic bullish formation
- Our team expects pullback
SUGGESTED TRADE:
Swing Trade
Long GOLD
Entry - 3219.9
Sl - 3207.5
Tp - 3246.2
Our Risk - 1%
Start protection of your profits from lower levels
Disclosure: I am part of Trade Nation's Influencer program and receive a monthly fee for using their TradingView charts in my analysis.
❤️ Please, support our work with like & comment! ❤️

XAU/USD Targeting $3,250Gold (XAU/USD) shows strong bullish momentum with $3,250 as the next key target. Watch for breakout confirmation.

Bearish Rejection at Resistance – Potential Drop Incoming🔍 Chart Analysis Summary
1. Key Zones
Resistance Zone: ~$3,340 – $3,360
Price has been rejected multiple times from this area, showing strong selling pressure.
Support Zone: ~$3,200 – $3,240
Strong historical support level, previously held during a pullback after the last rally.
2. Moving Averages
EMA 50 (Red): Currently at ~$3,340
Price is fluctuating around it, indicating short-term indecision or a possible retest.
EMA 200 (Blue): Currently at ~$3,300
Acting as a mid-term support level. Price previously bounced from this region.
3. Pattern and Price Action
Fakeout Potential:
The chart suggests a possible false breakout above the resistance followed by a sharp drop—highlighted by the arrow. This is a common bull trap setup.
Bearish Outlook Indicated:
The projected path suggests a rejection from resistance and a drop to the support zone (~$3,200). This would create a lower high, a bearish sign.
4. Trading Bias
Bearish Setup if:
Price fails to hold above $3,340 (EMA50).
Price gets rejected from the resistance zone and breaks below $3,300 (EMA200).
Bullish Invalidated if:
Price closes convincingly above the $3,360 resistance with volume, flipping it into support.
📉 Potential Trade Idea
Short Entry: Around $3,350–$3,355
Stop Loss: Above $3,365 (above resistance zone)
Target: $3,220–$3,230 (support zone)

Gold Evening Star on WeeklyGold is working on its second consecutive red week which would be the first such occurrence in 2025. Interestingly, gold had only posted two red weeks in the prior 16, until the $3500 level came into play.
That high in gold syncs with a long-term spot of support in the US Dollar, and going into next week's FOMC meeting the two scenarios appear linked as a dovish Fed would likely be needed if we are to see another $3500 test, much less a break.
For now, support is at the psychological level of $3200 and for next week, that becomes lower-high resistance potential for breakdown scenarios. - js

Hanzo | Gold15 min Breaks – Will Confirm the Next Move🆚 Gold – Hanzo’s Strike Setup
🔥 Timeframe: 15-Minute (15M)
——————
💯 Main Focus: Bullish Breakout at 3301
We are watching this zone closely.
💯 Main Focus: Bearish Breakout at 3270
We are watching this zone closely.
📌 If price breaks with high volume, it confirms Smart Money is in control, and a strong move may follow.
———
Analysis
👌 Market Signs (15M TF):
• Liquidity Grab + CHoCH at 3361
• Liquidity Grab + CHoCH at 3336
• Strong Rejections seen at:
➗ 3270 – Major support / Key level
➗ 3300 – Proven resistance
🩸 Key Zones to Watch:
• 3300 – 🔥 Bullish breakout level X 3 Swing Retest
• 3345 – Strong resistance (tested 5 times)
• 3270 – Equal lows
• 3370 – Equal highs

XAU/USD buy to sell outlookThis week, I’ll be monitoring potential long entries from the nearby 3H demand zone, but my primary focus will be on price retracing into the 4H supply zone around 3,300, where I’ll be watching for a sell opportunity.
This zone aligns with the current bearish momentum we've seen recently, and I’ll wait for price to slow down and show signs of distribution once it reaches this area.Once we see that slowdown, I’ll aim to refine a clean order block for entry, ensuring a clear change of character and avoiding any potential smart money traps or false moves.
Confluences for Gold Sells:
- A clean 4H supply zone has formed, which caused a break of structure to the downside.
- There's significant liquidity resting below, making further downside likely.
- Gold has been heavily overbought and saturated, which supports this correctional bearish move.
- The DXY recently reacted bullish from a strong 2-day demand zone, adding confluence for downside in gold.
- After last week’s sharp decline, a retracement is expected before further downside continuation.
P.S.: There’s also liquidity to the upside in the form of uncollected Asia highs, so don’t be surprised if price sweeps those first before tapping into our supply zone.
Let’s stay patient and smart with entries — have a great weekend, everyone!

[ TimeLine ] Gold 28-29 April 2025Hello everyone,
📅 Today is Friday, April 25, 2025
I will be using the High-Low price levels formed on the following dates as reference points for potential trade entries:
📌 April 28, 2025 (Monday)
📌 April 28 & 29, 2025 (Monday & Tuesday)
🧠 Trading Plan & Notes:
✅ Gold has broken its ATH multiple times over the past two weeks—volatility remains high
✅ Gold has significant reversal more than 2000pips from its ATH 3500 to 3260
⚠️ If the formed range is big, reversal entries or trades based on Fibonacci levels may be more appropriate
✅ I will personally trade both signals as part of my ongoing research and strategy
⚠️ If you're unsure or risk-averse, consider skipping April 28 & 29 signal
📋 Execution Plan:
🔹 Wait for the price range from the candles above to fully form (marked with green lines)
🔹 Entry will be triggered upon breakout, with a 60-pip buffer
🔹 If the trade hits Stop Loss (SL), switch direction and double the position size on the next valid entry for potential recovery
📉📈 Chart Reference:
🔗 Copy & paste this code into TradingView URL : TV/x/9932ommw/

GOLD...LONGPYTH:XAUUSD
Market structure suggests is preparing for its next move.
The AND level will likely play a critical role in the upcoming direction.
** If structure breaks and confirms the shift, a new bias might form after the retest. **

continue to accumulate, gold price waiting for NF⭐️GOLDEN INFORMATION:
Gold price (XAU/USD) continues its downward trajectory, slipping toward $3,315 during early Asian trading on Wednesday as improving global risk sentiment and signs of easing trade tensions weigh on demand for the safe-haven asset. Market participants remain cautious ahead of key US economic data releases, including the ADP Employment Change, the Core PCE Price Index, and the preliminary Q1 GDP figures, all scheduled for later in the day.
Meanwhile, US President Donald Trump is reportedly aiming to reduce the overall impact of automotive tariffs by avoiding cumulative duties on foreign vehicles and loosening restrictions on imported parts used in domestic production. Treasury Secretary Scott Bessent added that major trade partners have made “very good” proposals to avert further US tariffs. Furthermore, exemptions on select US goods from retaliatory duties suggest a growing intent to de-escalate ongoing trade disputes.
⭐️Personal comments NOVA:
Gold price maintains accumulation range of 3265 - 3360, temporary stability awaits big fluctuations
⭐️SET UP GOLD PRICE:
🔥SELL GOLD zone : 3368- 3370 SL 3375
TP1: $3350
TP2: $3340
TP3: $3330
🔥BUY GOLD zone: $3264 - $3262 SL $3257
TP1: $3280
TP2: $3300
TP3: $3318
🔥BUY GOLD zone: $3285 - $3283 SL $3280 scalping
TP1: $3290
TP2: $3295
TP3: $3300
⭐️Technical analysis:
Based on technical indicators EMA 34, EMA89 and support resistance areas to set up a reasonable SELL order.
⭐️NOTE:
Note: Nova wishes traders to manage their capital well
- take the number of lots that match your capital
- Takeprofit equal to 4-6% of capital account
- Stoplose equal to 2-3% of capital account

XAUUSD Bearish - SELLMarket Overview
Asset: Gold (XAU/USD)
Timeframe: 1H
Current Trend: Downtrend
Market Context:
Fundamental Drivers: Gold faces downward pressure due to a strengthening US Dollar, driven by the Fed’s hawkish outlook on April 28, 2025, with no anticipated rate cuts in Q2 2025. Rising US 10-year Treasury yields (near 4.6%) are reducing demand for non-yielding assets like Gold.
Recent Price Action: Gold rallied to the $2,450–$2,460 zone but was rejected, forming a lower high after failing to break above the 50-period EMA, consistent with a broader downtrend from the March 2025 high ($2,500).
Sentiment: Bearish sentiment prevails, with risk-on markets (e.g., S&P 500 gains) diminishing Gold’s safe-haven appeal.

Gold INTRADAY corrective pullback supported at 3218Gold slipped to the $3,200 area as optimism grew over possible US-China tariff talks, which boosted risk sentiment and pushed the US Dollar to a 3-week high. However, gold’s downside may be limited as traders grow cautious ahead of Friday’s US Nonfarm Payrolls (NFP) report.
Despite USD strength, growing expectations of Fed rate cuts—possibly four by year-end—are supportive for gold in the medium term. This follows weak US economic data:
GDP contracted for the first time since 2022
PCE inflation is easing
Jobless claims hit a 2-month high
ADP jobs report showed cooling private-sector hiring
ISM Manufacturing PMI remained in contraction
Key NFP Expectations (Friday):
+130K jobs (down from 228K prior)
Unemployment Rate: steady at 4.2%
Wage Growth: +0.3%
Conclusion for Gold Traders:
Short-term pressure on gold from stronger USD and trade optimism, but soft US data and rising rate cut bets may provide support. Watch NFP closely — a weak report could trigger a bullish move in gold.
Resistance Level 1: 3392
Resistance Level 2: 3457
Resistance Level 3: 3500
Support Level 1: 3218
Support Level 2: 3173
Support Level 3: 3130
This communication is for informational purposes only and should not be viewed as any form of recommendation as to a particular course of action or as investment advice. It is not intended as an offer or solicitation for the purchase or sale of any financial instrument or as an official confirmation of any transaction. Opinions, estimates and assumptions expressed herein are made as of the date of this communication and are subject to change without notice. This communication has been prepared based upon information, including market prices, data and other information, believed to be reliable; however, Trade Nation does not warrant its completeness or accuracy. All market prices and market data contained in or attached to this communication are indicative and subject to change without notice.

CHECK GOLD SIGNAL UPDATE READ THE CAPTAINgold signal analysis satup gold buy now entry point 3266 to 3264 take profits (3270) target 2 (3275) last target (3280) techinal analysis satup fallow risk managment

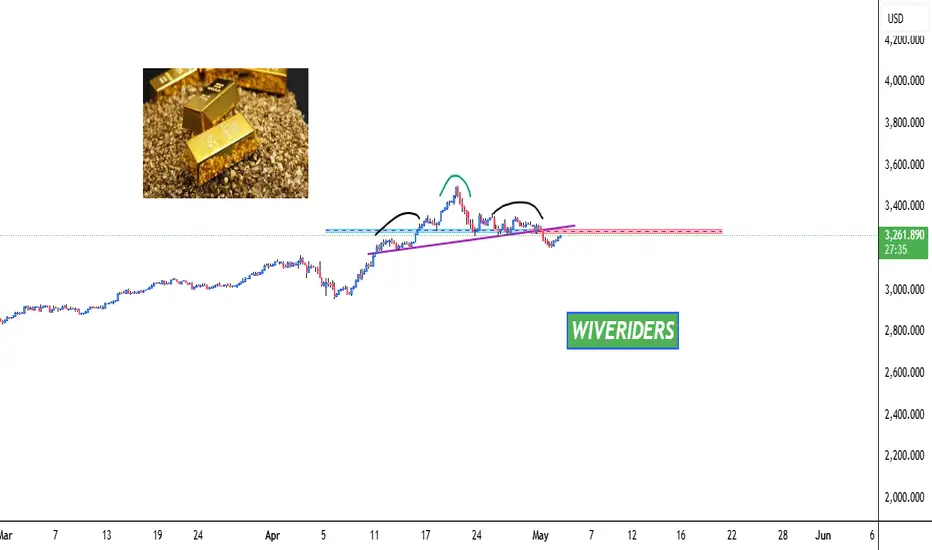
GOLD Formed Bearish Head and Shoulders Pattern🚨 TVC:GOLD Formed Bearish Head and Shoulders Pattern 🚨
TVC:GOLD has formed a bearish head and shoulders pattern and appears to be making a pullback to the neckline before a potential drop. However, if the price breaks out above the right shoulder, the bearish pattern could be invalidated.
📈 Technical Overview:
Pattern: Bearish Head and Shoulders
Neckline: Current pullback area.
Bearish Confirmation: A drop below the neckline could confirm the bearish move.
Invalidation: If the price breaks out above the right shoulder, the bearish pattern may be invalidated.
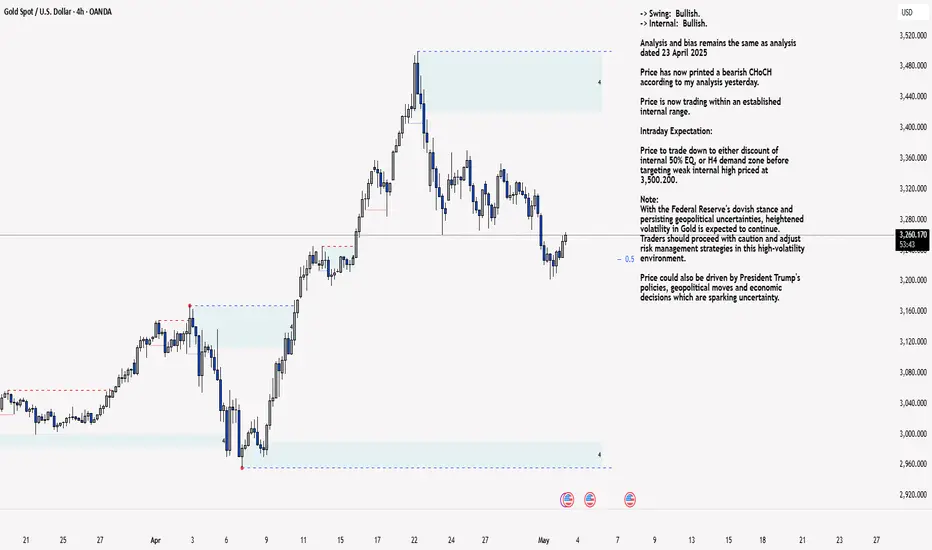
XAU/USD 02 May 2025 Intraday AnalysisH4 Analysis:
-> Swing: Bullish.
-> Internal: Bullish.
Analysis and bias remains the same as analysis dated 23 April 2025
Price has now printed a bearish CHoCH according to my analysis yesterday.
Price is now trading within an established internal range.
Intraday Expectation:
Price to trade down to either discount of internal 50% EQ, or H4 demand zone before targeting weak internal high priced at 3,500.200.
Note:
With the Federal Reserve's dovish stance and persisting geopolitical uncertainties, heightened volatility in Gold is expected to continue. Traders should proceed with caution and adjust risk management strategies in this high-volatility environment.
Price could also be driven by President Trump's policies, geopolitical moves and economic decisions which are sparking uncertainty.
H4 Chart:
M15 Analysis:
-> Swing: Bullish.
-> Internal: Bearish.
As mentioned in yesterday's analysis dated 01 May 2025 whereby I mentioned that I would continue to monitor price and depth of bullish pullback following the printing of a bearish iBOS followed by a bullish CHoCH.
Price did not pullback significantly enough to warrant a further bearish iBOS, therefore, I will apply discretion and not classify this as such, I have however marked in red.
Price has since continued bearish, subsequently printing a bullish CHoCH.
Internal structure is now established, however, I will continue to monitor price regarding depth of pullback as previous.
Intraday Expectation:
Price to trade up to either premium of internal 50% EQ, or M15 supply zone before targeting weak internal low priced at 3,201.955
Note:
With the Federal Reserve maintaining a dovish stance and ongoing geopolitical tensions, volatility in Gold prices is expected to remain elevated. Traders should exercise caution, adjust risk management strategies, and stay prepared for potential price whipsaws in this high-volatility environment.
Trump's tariff announcement will most likely cause considerably increased volatility and whipsaws.
M15 Chart:
Gold sell target confirm Check this guys, I have done a 45 minute analysis, so if it is a confirmed target, go for the sale.

Gold Price Analysis May 2D1 frame confirms closing below the disputed zone showing the downtrend continues to extend in the following days
The recovery in the Asian and European sessions can be a stepping stone for a decrease in the US session. Sellers are waiting for high price zones and old breakout zones to sell their goods. The 3271-3273 zone plays an important role in the bearish structure as long as this zone is held by the sellers, the possibility of a price increase is relatively low.
The barrier in the Asian session around 3257 will be where we consider the trading strategy. If the European session breaks this zone, we can buy at the target of 3271-3273. If the US session does not break this zone, SELL breaks it, the downtrend structure is broken and holds the BUY order until 3299. The daily resistance zone will be 3312. When 3371 is not broken, SELL and this is a good Swing signal to 3200. The possibility of a strong sell-off after Nonfarm is also understandable.
Strategy: If it does not break 3257 but falls, wait for the reaction at the border of 3243. When this zone is broken, the trend is broken, then we only SELL. If it increases from 3243, then maintain the above strategy with a better entry.

GOLD trades around $3,300, market lacks major impactOANDA:XAUUSD sare trading lower around the $3,300/oz flatline as easing US-China trade tensions dampen the appeal of gold as a safe-haven asset, while investors await US economic data to gauge the Federal Reserve's policy direction.
OANDA:XAUUSD have been trading in a narrow range recently as the market awaits details of the first trade deal, which is expected to be announced this week or next.
OANDA:XAUUSD has reversed to a downside correction since last week as Trump made some very positive comments and the risk of stagflation was further ruled out, and gold prices continued to fall. Stagflation has pushed gold higher and as the market starts to price in this risk, a correction is natural, especially considering that “buying gold” has become the top trade and it is technically in overbought territory.
Looking at the larger picture, gold prices remain in an uptrend as real yields are likely to continue to fall amid the Fed’s easing. But in the short term, more positive news on tariffs could see gold prices continue to fall as the market adjusts to the new conditions.
OANDA:XAUUSD , traditionally seen as a hedge against political and financial uncertainty, hit a record high of $3,500.05 last week amid heightened uncertainty.
Investors will be watching economic data for the rest of the week, including Wednesday's personal consumption expenditure report and Friday's non-farm payrolls report.
Technical Outlook OANDA:XAUUSD
On the daily chart, gold continues to move sideways as the accumulation state takes place as the market has no fundamental impact of any sudden change. With the current position, gold is not qualified to increase or decrease significantly with the sideway area of attention in the range of 3,371 - 3,292 USD being the positions of the Fibonacci retracement of 0.236% and 0.382%.
However, overall, gold is still inclined to increase in the long term with the price channel as the main trend and support from EMA21 as the main support. As long as gold remains above/within the price channel, above EMA21, it still has the technical conditions for the main trend to be up, the declines should only be considered as short-term corrections and not an official trend.
During the day, the sideways accumulation state with the main uptrend will be noticed again by the following positions.
Support: 3,292 – 3,267 USD
Resistance: 3,371 USD
SELL XAUUSD PRICE 3382 - 3380⚡️
↠↠ Stop Loss 3386
→Take Profit 1 3374
↨
→Take Profit 2 3368
BUY XAUUSD PRICE 3283 - 3285⚡️
↠↠ Stop Loss 3279
→Take Profit 1 3291
↨
→Take Profit 2 3297

Gold TechnicalsThis chart outlines a potential bullish breakout scenario for XAUUSD on the 1-hour timeframe. Price has been respecting a descending trendline, but recent upward momentum has brought it back to a key decision point near the trendline resistance. The circled area labeled "BOS" (Break of Structure) suggests a possible shift in market structure from bearish to bullish if price breaks and sustains above that zone. The main expectation is for price to push higher toward the upper resistance around 3,320 if the breakout confirms, offering a swing or intraday long opportunity. However, the alternative scenario (marked with a red arrow) highlights that failure to break the trendline could result in a rejection and continuation of the downtrend toward the 3,180–3,160 support zone. RSI near mid-levels supports the idea that price still has room to move in either direction, emphasizing the importance of watching price behavior at the breakout point.

Gold is expected to rebound to the 3270-3275 areaFundamentals:
Focus on today's NFP market;
Technical aspects:
Gold stopped falling near 3200 and gradually rebounded, and has now rebounded to around 3240. As for this round of rebound, I have actually made it clear in my previous opinion that the bulls and bears are wrestling at the 3200 mark, and there will still be repeated in the short term, and after the downward trend slows down, some trapped bulls must have self-rescue behaviors, so it is not surprising that gold has rebounded.
From the current structure, gold has not shown a clear bottoming signal, so the gold rebound is only temporary, and gold will continue to fall after the rebound. From the perspective of frequent switching of intervals, since gold has broken through the area near 3235 during the rebound, the rebound may continue, and is expected to continue to the area near 3270-3275. After breaking through this area, it is even expected to continue to around 3290. This is the position area where we must focus on entering the short position.
Trading strategy:
1. Consider buying gold in the 3235-3230 area, TP: 3245-3255; pay attention to setting protection.
2. Consider selling gold in batches after gold rebounds to the 3270-3275 area, TP: 3240-3230

Gold Analysis Break Out SupportGold Analysis Break Out Support waiting for retest and opportunity to short entry.
