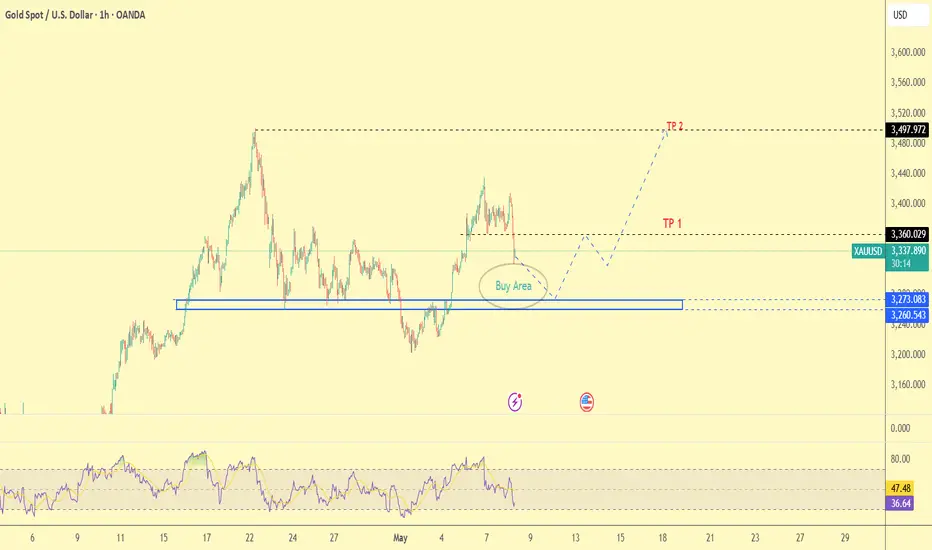
Hellena | EUR/USD (4H): LONG to the resistance area 3495.Colleagues, price has successfully formed an “ABC” correction and I see that the upward movement is not over.
I think that wave “5” of the higher order consists of five waves and at the moment wave “1” of the lower order is formed.
This means that I predict a target at the high of wave 3495.
Presumably correction “2” can reach a rougher target in the area of 3240.
Manage your capital correctly and competently! Only enter trades based on reliable patterns!
USCGC trade ideas

XAUUSD: Price Mitigated Earlier, We Got Left Behind! Hey Everyone
Happy Friday
So, yesterday, we were expecting gold prices to dip down to around 3172. But guess what? It didn’t quite go as planned! The price took a nosedive from 3208 and is currently sitting at 3260, almost 520 pips move.
It’s not always going to be a smooth ride, so let’s not get discouraged. We can focus on analysing this chart and keeping an eye on the price as it moves.
Once the trade is activated, there are two targets you can set. You can choose your own take-profit based on your analysis and trade management.
Good luck and trade safely! 😊
Thanks a bunch for your unwavering support! ❤️🚀
If you’re feeling generous, here are a few ways you can help us out:
- Like our ideas
- Comment on our ideas
- Share our ideas
Cheers,
Team Setupsfx_
❤️🚀

GOLD What Next? SELL!
My dear friends,
Please, find my technical outlook for GOLD below:
The price is coiling around a solid key level - 3263.7
Bias - Bearish
Technical Indicators: Pivot Points Low anticipates a potential price reversal.
Super trend shows a clear sell, giving a perfect indicators' convergence.
Goal - 3249.1
Safe Stop Loss - 3271.6
About Used Indicators:
The pivot point itself is simply the average of the high, low and closing prices from the previous trading day.
Disclosure: I am part of Trade Nation's Influencer program and receive a monthly fee for using their TradingView charts in my analysis.
———————————
WISH YOU ALL LUCK

#GOLD Buy 3222 - 3211#GOLD Buy 3222 - 3211
Stoploss 3189
Breakeven 3222.5
TakeProfit 1: 3224
TakeProfit 2: 3232
TakeProfit 3 :3246
TakeProfit 4: 3258
TakeProfit 5: 3270
Trade at your own risk
Protect your capital
The Wizard 🧙♂️ FDT
Thu May 01 25' 08 AM EST

Hanzo : Gold15m : Reversal Zone / Next Move is Confirmed🆚 Gold – Hanzo’s Strike Setup
🔥 Timeframe: 15-Minute (15M)
——————
💯 Main Focus: Bearish After Retest at 3354
We are watching this zone closely.
———
👌 Market Signs (15M TF):
• Liquidity Grab + CHoCH at 3350
• Liquidity Grab + CHoCH at 3400
• Strong Rejections seen at:
➗ 3325 – Major support / Key level x5 Retest
➗ 3360 – Proven resistance

XAUUSD Daily Sniper Plan – Monday, May 12, 2025“Structure First. Noise Later. Gold Moves Clean When You Do.” ⚖️🧠
Intraday Bias: Bullish, short-term recovery inside broader pullback
Structure: CHoCH confirmed at 3284 → market forming higher low structure
🔍 H1 Market Flow Overview:
Price broke structure above 3284–3292, forming a clean CHoCH on H1.
Since then, price impulsively pushed toward 3340, pausing around 3314–3318.
EMAs (5/21/50) are starting to align bullish, with EMA5 now crossing above 21.
Volume compression + wicks suggest potential accumulation in the 3314–3318 zone.
📌 Key H1 Zones (Above & Below Price)
🔺 Resistance Zones
Zone Description
3340–3345 Friday’s high + intraday liquidity trap zone
3380–3395 Strong H1/Daily confluence resistance (OB + FVG)
🔻 Support Zones
Zone Description
3314–3318 🔵 Micro liquidity pocket + HL accumulation zone – potential inducement/reentry base
3284–3292 🔵 CHoCH base – must hold for bullish structure to continue
3260–3265 🔵 Deep intraday OB + liquidity sweep zone
3220–3235 🔵 Major HTF demand – structural last line of defense
🔁 Scenarios for Monday (May 12):
🟢 Bullish Setup:
If price holds above 3314–3318, we may see a reattempt toward 3340, then potentially push into 3380–3395.
Retest of 3314 zone could serve as HL confirmation before breakout.
🔴 Bearish Setup:
If 3314 fails and price closes below 3284, this invalidates current bullish micro-structure.
In that case, we target 3260 or even 3235 depending on momentum.
Rejection from 3340 or 3380 without BOS → short toward 3284 or 3250
Clean break below 3284 flips LTF bearish
🎯 Sniper Logic:
Gold is trapped in a battle between Friday’s high and the CHoCH base.
The true breakout will come once either 3345 is reclaimed clean, or 3284 fails hard.
Until then, play inside structure — sniper entries only.
💬 Final Words:
Gold doesn’t bluff — but it does bait and trap.
Mark your zones, wait for confirmation, and let the impulsive ones get hunted.
Gold doesn’t care about your bias — only about the zones that hold.
If 3284 stays protected, bulls might reload. If it cracks, fade the optimism and follow the flow down.
🟡 Stay smart. Stay patient. And remember: clean structure = clean profit.
✨ Drop your thoughts in the comments, smash that like, and follow GoldFxMinds for sniper-level clarity every session.

XAU/USD (Gold) H1 Breakout (29.04.2025)The XAU/USD Pair on the H1 timeframe presents a Potential Selling Opportunity due to a recent Formation of a Breakout Pattern. This suggests a shift in momentum towards the downside in the coming hours.
Possible Short Trade:
Entry: Consider Entering A Short Position around Trendline Of The Pattern.
Target Levels:
1st Support – 3158
2nd Support – 3025
🎁 Please hit the like button and
🎁 Leave a comment to support for My Post !
Your likes and comments are incredibly motivating and will encourage me to share more analysis with you.
Best Regards, KABHI_TA_TRADING
Thank you.

Gold is expected to fall below 3300, continue to short gold!Fundamentals:
1. Pay attention to whether the geopolitical conflicts escalate, including the situation between India and Pakistan, Russia and Ukraine, and the situation between the United States and Iran, etc.
Technical aspects:
Although the gold price gradually rebounded after hitting 3320 points, the current rebound momentum is relatively weak. The gold price has turned from strong to weak, and the short-term "M"-shaped top structure formed by 3435 points and 3414 points above has suppressed the upward space of the gold price. Therefore, we still focus on shorting gold after the rebound. First, we focus on the resistance area of 3355-3365 points above. If the gold price rebound fails to successfully break through this area, the gold price will fall again and is expected to continue to fall to around 3280 points.
Trading strategy:
Consider shorting gold after gold rebounds to the 3355-3365 area, target price: 3340

GOLD/USD showing short-term corrections during the downtrendPrice Action Overview
Current Price: $3,389.030
Change: -47.536 (-1.38%) at the time of the snapshot.
Recent High: Around $3,453
Support Levels:
$3,370.793
$3,236.478
$3,201.685
Resistance Levels:
$3,393.756
$3,453.443
Technical Indicators & Patterns
Price Zones:
A red shaded area near the top indicating a strong resistance zone.
Multiple green shaded boxes below suggesting prior demand zones (support).
Trade Markers:
"B" = Buy signals (e.g., on May 3–4, where a rally followed)
"R" = Resistance/reversal points
"T" = Possibly a target or technical level
Volume Spikes:
Notable spike on April 23 (2.619M) and another smaller one around April 30 (568.623K).
Price Movements:
Recent Rally: A sharp upward movement from early May, rising from support near $3,200 to resistance at ~$3,450.
Corrections: Several pullbacks marked (-0.80%, -0.95%, etc.), showing short-term corrections during the downtrend and consolidation phases.
Percentage Gains/Losses:
Ranges from minor gains (0.67% to 1.19%) to losses (e.g., -0.95%) across various candles, highlighting short-term trading opportunities.

GOLD (XAUUSD): Your Plan to Buy
The recent fundamentals pumped Gold prices again.
The market is currently trading above a significant
daily resistance.
To confirm a validity of a breakout and to avoid a trap,
I suggest paying close attention to a minor horizontal
range on a 4H time frame.
Your signal to buy will be a 4H candle close above 3388.
It will confirm a breakout and increase the chances that the price will go up.
Goal will be 3435
❤️Please, support my work with like, thank you!❤️
I am part of Trade Nation's Influencer program and receive a monthly fee for using their TradingView charts in my analysis.

XAU/USD..gold 15M chart pattern..Im planning a gold (XAU/USD) trade based on a trend line breakout strategy. Here's a breakdown of your setup:
**Trade Summary:**
- **Action:** SELL GOLD
- **Entry Price:** 3384
- **Target 1 (TP1):** 3352 (-32 points)
- **Target 2 (TP2):** 3322 (-62 points)
- **Strategy:** Trend line breakout (likely a breakdown below support).
### Key Considerations:
1. **Confirmation:**
- Ensure the trend line breakout is confirmed (e.g., a close below the trend line with momentum, high volume, or candlestick patterns like a bearish engulfing).
- Watch for retests of the broken trend line (now resistance) for added validity.
2. **Risk Management:**
- Place a stop-loss (SL) above the trend line or a recent swing high (e.g., 3405–3415, depending on volatility).
- Risk-reward ratio: TP1 offers ~1:1 if SL is ~30 points, TP2 ~1:2.
3. **Targets:**
- TP1 (3352): Partial profit-taking level.
- TP2 (3322): Final target, possibly near a support zone (adjust based on price structure).
4. **Market Context:**
- Check higher timeframes (H4/Daily) for alignment with the downtrend.
- Monitor USD strength, yields, or geopolitical news impacting gold.
Would you like help refining the stop-loss or analyzing the chart structure further?

GOLD 4H CHART ROUTE MAP UPDATE & TRADING PLAN FOR THE WEEKHey Everyone,
Please see our updated 4h chart levels and targets for the coming week.
We are seeing price play between two weighted levels with a gap above at 3282 and a gap below at 3224. We will need to see ema5 cross and lock on either weighted level to determine the next range. We have a bigger range in play then usual.
We will see levels tested side by side until one of the weighted levels break and lock to confirm direction for the next range.
We will keep the above in mind when taking buys from dips. Our updated levels and weighted levels will allow us to track the movement down and then catch bounces up.
We will continue to buy dips using our support levels taking 30 to 40 pips. As stated before each of our level structures give 20 to 40 pip bounces, which is enough for a nice entry and exit. If you back test the levels we shared every week for the past 24 months, you can see how effectively they were used to trade with or against short/mid term swings and trends.
The swing range give bigger bounces then our weighted levels that's the difference between weighted levels and swing ranges.
BULLISH TARGET
3282
EMA5 CROSS AND LOCK ABOVE 3282 WILL OPEN THE FOLLOWING BULLISH TARGET
3343
EMA5 CROSS AND LOCK ABOVE 3343 WILL OPEN THE FOLLOWING BULLISH TARGET
3404
EMA5 CROSS AND LOCK ABOVE 3404 WILL OPEN THE FOLLOWING BULLISH TARGET
3439
EMA5 CROSS AND LOCK ABOVE 3439 WILL OPEN THE FOLLOWING BULLISH TARGET
3503
BEARISH TARGETS
3224
EMA5 CROSS AND LOCK BELOW 3224 WILL OPEN THE FOLLOWING RETRACEMENT RANGE
3190
3138
EMA5 CROSS AND LOCK BELOW 3138 WILL OPEN THE SWING RANGE
SWING RANGE
3088 - 3046
EMA5 CROSS AND LOCK BELOW 3046 WILL OPEN THE SECONDARY SWING RANGE
SECONDARY SWING RANGE
3015 - 2988
As always, we will keep you all updated with regular updates throughout the week and how we manage the active ideas and setups. Thank you all for your likes, comments and follows, we really appreciate it!
Mr Gold
GoldViewFX

Gold Bears Back in Control – Targeting 3270 AgainIn my analysis yesterday, I noted that after the false break above 3370 resistance, there was a high likelihood of a reversal, potentially driving Gold back down to the 3270 support zone.
Market Reaction:
• As expected, Gold turned lower after retesting the broken 3370 support, now acting as resistance.
• The price dropped nearly 1000 pips, which has become the new norm for daily Gold fluctuations lately.
W hat’s Next?
• With the current rebound, the 3370 zone should once again act as a barrier.
• The strategy remains to sell rallies, targeting a fresh test of the 3270 support zone.
Until this support is broken, expect very volatile moves, but the broader trend remains bearish
Disclosure: I am part of Trade Nation's Influencer program and receive a monthly fee for using their TradingView charts in my analyses and educational articles.

Gold will continue to fall after correctionGold after exiting the consolidation, which is the basis of the H&S reversal pattern, and falling by 1.7% gold may form a correction to accumulate the potential to continue its fall
The correction allows to accumulate energy before the fall at the expense of those who were selling (collect sellers' stoplosses), those who are now buying (collect stoplosses after the reversal).
Scenario: if the correction continues to the resistance 3260, it will be a key point from which we can consider the continuation of the fall. The signal for the fall will be the lack of opportunity to continue growth, i.e. false breakout and consolidation below 3260.

Gold XAUUSD Move 06.05.2025🔹 BUY-1: 3350–3355 Zone
Conditions to Enter:
Support must hold at the 3350–3355 zone.
Wait for a clear bullish M15 candle close above the support area to confirm strength.
Rationale:
This zone overlaps with a Fresh Demand Zone identified on your chart.
Entry here takes advantage of potential accumulation and demand absorption.
It's an early entry with a tighter stop loss (just below 3346–3350).
Ideal Setup:
Stop Loss: Below 3346.
Target: Near 3380–3400 zone or higher depending on momentum.
🔹 BUY-2: 3380–3385 Zone
Conditions to Enter:
Price must break above the 3380–3385 resistance zone.
Wait for a successful retest and bullish confirmation (engulfing/imbalance/M15 close above).
Rationale:
This is the breakout and retest trade mentioned on the chart.
Entering after confirmation reduces risk of a fakeout.
Aligns with institutional breakout behaviors.
Ideal Setup:
Stop Loss: Below the retest candle or previous structure (~3370 area).
Target: 3410–3430+ depending on R/R and momentum continuation.
Kindly show your support by follow, comment and share.

Gold Intraday Trading Plan 5/9/2025Gold has broken 3360 yesterday and tested 3300. Currently in daily timeframe, it is still bullish. As long as it is above 3270, I am bullish on gold.
I have two strategies for buying orders today.
1. Buy from 3270
2. Buy if 3330 broken
We can target 3360 for today.

Buying every dip on Gold / Fed sessionTechnical analysis: Wednesday’s session Inverted Hammer practically took Gold nowhere as Hourly 1 chart remained ranged within Higher High’s Upper and Lower zone, closing out last and this week on an expected positive note. The Monthly (#1M) candle remains on decent gains (# +11.57%) and the last two sessions on the second Highest Volume throughout April - May (this is translated to Gold’s cyclical behavior which I spotted lately when #2-High Volumed sessions are delivered, strong move follows). Despite the Higher High’s, it is clear that since the #3,400.80 local High’s, Gold undergoes a consolidation phase with equal demand and supply, which according to previous models is an Resistance zone preparation for the next leg Lower or Higher regarding Weekly chart (#1W). I remain idle until Fed announcement while Buying every dip last #2-session horizon.

XAUUSD MARKET OUTLOOKPrice consolidates at 3329.65 ahead of US FED INTEREST RATE CUT what do we expect next? Technically, price has found support around 3219.18 I anticipate more bullish price action to develop away from a 50% Fibonacci retracement level (3329.65)

Bearish Cypher Harmonic PatternGold prices might drop based on the Cypher harmonic pattern! 📉
Keep an eye on the charts, traders.

XAUUSD Shortshorting XAUUSD with TP and SL as per chart
XAUUSD will be short because there BOS (Break Of Structure) before.

XAU/USD (GOLD) TRADE PLAN 6/5/2025XAU/USD (Gold) Trading Outlook
The current price of XAU/USD around 3380 to 3375. We are anticipating a pullback towards the 3300 level, at which point we will look for long (buy) entry opportunities.
Key Resistance/Target Level:
TARGET 1: 3400
TARGET 2: 3450
TARGET 3: 3480
Key Support Levels:
SUPPORT 1: 3200
SUPPORT 2: 3150
This Strategy is based on the expectation of a price retracement, providing a more favorable risk-reward setup for long positions.

GOLD Trade Plan 08/05/2025Dear Traders,
after FOMC and After Powell's speech, we saw heavy fluctuations in gold. I expect the price to drop below the 3300 zone, which is a buying area, and from there, we could see a strong move toward the all-time high.
If you enjoyed this forecast, please show your support with a like and comment. Your feedback is what drives me to keep creating valuable content."
Regards,
Alireza
Gold opening rise and fall prediction?The current gold market is in a range of fluctuations, maintaining a wide range of fluctuations. Technically, the key support level below is still focused on the 3270 area, while the 3450 price level above constitutes a significant double-top structural resistance level. Although the conclusion of the US-UK tariff agreement has a phased negative effect on precious metals at the geopolitical level and may provide a demonstration effect for other regional trade negotiations, the overall technical structure still maintains a downward trend. At the daily level, the recent K-line combination has completed a deep retracement from the 3500 mark with two long negative lines, directly breaking through an important support platform. The current daily K-line continues to close the adjustment pattern with an upper shadow line, and the alternating yin and yang oscillation rhythm conforms to the technical correction characteristics. It is worth noting that the 50-period moving average continues a clear downward trajectory, forming a resonance suppression with the double-top structure in the 3450 area.
The 1-hour gold chart shows that the short-term price trend presents a clear downward channel feature, and the seller's power continues to dominate the market. Combined with the Fibonacci extension level calculation, the first target below can still focus on the 3300 area. If this support platform is lost, the price will have a technical demand to further explore the 3320 integer mark. The current volume and price coordination shows that the market is brewing a new wave of trending market conditions. It is necessary to pay close attention to the breakthrough direction of the 3300-3380 range, which will determine the continuation or reversal of the medium-term trend. Taken together, the short-term operation of gold is recommended to be mainly longs on callbacks, supplemented by shorts on rebounds. The top short-term focus is on the first-line resistance of 3360-3380, and the bottom short-term focus is on the first-line support of 3320-3300.
