Gold Spot (XAU/USD) – Bullish Double Bottom BreakoutHello guys!
Yesterday we got our profit from gold!
It is a new one:
Gold has formed a clear double bottom on the 1H timeframe, accompanied by a bullish divergence—a classic signal of potential reversal. Following the breakout above neckline resistance, the price is currently in a retest phase, revisiting the breakout zone (now turned support).
🔹 Pattern: Double Bottom
🔹 Signal: Bullish Divergence
🔹 Breakout: Confirmed
🔹 Support Zone: ~$3,300–$3,305
🔹 Target: ~$3,375–$3,385
The bullish scenario remains valid as long as the price holds above the support area. A failure to hold may invalidate the setup and lead to further consolidation or decline.
📌 Watch for bullish price action near the retest zone for potential entries.
USCGC trade ideas

Gold Intraday Trading Plan 5/3/2025Gold behaved just as I predicted but a bit lagged. Instead of going straight to 3228, it went to 3270 first and went up to 3370 and then dropped to 3200. This behavior indicates the further drop in the coming week.
Although overall trend is bullish, I don't think the correction is over yet. I am expecting it to test at least 3165, which is the last weekly resistance and also the top of previous channel.
For the trading strategy next week, I will engaged selling orders toward 3165 and if it holds, I will buy from there and monitor the price along the way.
Let's have a profitable week ahead and enjoy your weekend!

XAUUSD H4 Outlook – Monday, May 12, 2025Short-Term Bias: Bullish retracement toward premium zones
Structure: CHoCH confirmed at 3284 → forming potential bullish leg inside retracement
🔍 Recent Price Action (H4 Insight):
Clear CHoCH on H4 above 3292 → short-term structure flipped bullish.
Last impulsive leg pushed price into the 3330–3345 zone before rejecting slightly — signs of near-term resistance.
EMA5 and EMA21 are crossing upward, with price trying to retest EMA21 for a bounce.
Next H4 candle closure is critical — either holds 3290 for continuation or re-tests deeper zone.
📌 Key H4 Zones
Zone / Level Description
3380–3395 🔺 H4 FVG + OB zone – major near-term premium resistance (also Daily level)
3340–3345 🔁 H4 internal resistance – Friday top, low-volume gap area
3314–3318 🔁 Micro H4 imbalance – intraday fill zone
3284–3292 ✅ H4 CHoCH + OB – current bullish base, critical to hold
3250–3265 🔵 Deep demand – final intraday bounce zone before HTF demand
These levels will be your H4 battle zones — where price is likely to bounce, reverse, or accelerate depending on confirmation.
🔁 Potential Flow on Monday:
Bullish scenario:
If price holds 3284–3292 → intraday targets = 3318 → 3340 → 3380.
Clean structure = higher low + EMA support confluence.
Bearish scenario:
If price loses 3284 → could test 3250–3265. Only below this would invalidate current H4 bullish flow.
⚠️ Confluence Check:
EMAs: EMA5 crossing up through EMA21 → short-term bullish momentum building
Liquidity: Buy-side above 3345 → price may attempt sweep if supported
FVGs: Still unfilled gaps between 3314 and 3380 → magnet zones for bullish flow
CHoCH: Valid on 3284 → first HL attempt happening now
🧠 H4 Summary (for May 12):
Type Zone Reaction Potential
Resistance 3380–3395 Strong rejection possible
3340–3345 May slow price if volume weak
Support 3284–3292 Critical bullish structure zone
3250–3265 Breaker block zone (last bounce before HTF demand)
💬 Final Word to the Community:
Gold may have paused its moon mission at 3500, but the engines are refueling. Monday’s battle will be all about 3284 — hold it, and bulls might just take flight toward 3380. Lose it, and we buckle in for a deeper dip.
🟡 Whether you’re team buy-the-dip or wait-for-the-fade… stay sharp, stay patient, and always follow structure.
Like what you see? Drop a comment, tag a gold friend, and follow GoldFxMinds to never miss the real flow. 🧠⚡

THE KOG REPORT - UpdateEnd of day update from us here at KOG:
BOOMING! We said we would stick with the plan, we did, and BOOM, straight into the level we wanted. What we did want from there however is a bounce, but instead, we got just over 100pips long and then back into the lower level where we are now ranging.
Unless there is a late session move and 3210 holds us up to target the 3250-55 level initially, we'll wait lower now which is where the Asia session may take it.
With NFP tomorrow, we can expect that typical pre-event price action to begin soon, so maybe best practice now is to wait for them to do what they want, and come back next week to capture better set ups.
DOW, NAS, BTC, GOLD, EU and Oil all performing for us today, well done team. Another day in the office.
We'll be back tomorrow with the NFP KOG Report and our view.
As always, trade safe.
KOG

Bearish Cypher Harmonic PatternGold prices might drop based on the Cypher harmonic pattern! 📉
Keep an eye on the charts, traders.

Can we get a leg lower on XAUUSD?Hi fellow traders, XAUUSD will be ready to make a move lower from the golden pocket within the blue box after completing the correction. Target the 3195.03 level. Good luck and trade safe!

Gold awaits Fed / Buy every dipTechnical analysis: Wednesday’s session Inverted Hammer practically took Gold nowhere as Hourly 1 chart remained ranged within Higher High’s Upper and Lower zone, closing out last and this week on an expected positive note. The Monthly (#1M) candle remains on decent gains (# +11.57%) and the last two sessions on the second Highest Volume throughout April - May (this is translated to Gold’s cyclical behavior which I spotted lately when #2-High Volumed sessions are delivered, strong move follows). Despite the Higher High’s, it is clear that since the #3,400.80 local High’s, Gold undergoes a consolidation phase with equal demand and supply, which according to previous models is an Resistance zone preparation for the next leg Lower or Higher regarding Weekly chart (#1W). I remain idle until Fed announcement while Buying every dip last #2-session horizon.

Sideway range, gold price accumulates below 3302⭐️GOLDEN INFORMATION:
Gold price (XAU/USD) kicked off the week on a positive note, rising toward the $3,271 level during Monday’s Asian session as a blend of geopolitical and economic concerns fueled demand for the safe-haven asset. The prolonged Russia-Ukraine conflict, coupled with renewed tensions in the Middle East, continues to elevate global risk sentiment. Meanwhile, lingering uncertainty surrounding US President Donald Trump's tariff agenda has added to investor caution, further supporting the appeal of gold as a hedge in times of instability.
⭐️Personal comments NOVA:
Gold price continues to accumulate, low amplitude at the beginning of the week, waiting for the most important interest rate information this week
⭐️SET UP GOLD PRICE:
🔥SELL GOLD zone : 3302- 3304 SL 3309
TP1: $3290
TP2: $3280
TP3: $3270
🔥BUY GOLD zone: $3204 - $3206 SL $3199
TP1: $3215
TP2: $3224
TP3: $3240
⭐️Technical analysis:
Based on technical indicators EMA 34, EMA89 and support resistance areas to set up a reasonable SELL order.
⭐️NOTE:
Note: Nova wishes traders to manage their capital well
- take the number of lots that match your capital
- Takeprofit equal to 4-6% of capital account
- Stoplose equal to 2-3% of capital account

#XAUUSD: Price to go beyond $3650 to $3700 around 3500 pips moveThe XAUUSD price is moving nicely as we had predicted in our previous analysis. Both of our analyses have hit the take-profit target, and we are likely to see more bullish momentum continue in the coming time. There are two areas where price could move or reverse. Both targets have a long-term view, which means we are talking about a possible swing move that will take time to complete. Stop-loss and intraday target and position can be taken based on your own analysis and overview. Strong fundamentals are needed for price to reach our designated target area.
Good luck and trade safely. Trading financial instruments like gold and other markets brings extreme risk and can be severe if the risk is not managed correctly.
We are sharing our bias here, but it does not guarantee that the move will happen as described.
Once the trade is activated, you can set two targets. You can choose your own take-profit based on your analysis and trade management.
Good luck and trade safely! 😊
Thanks a bunch for your unwavering support! ❤️🚀
If you’re feeling generous, here are a few ways you can help us out:
- Like our ideas
- Comment on our ideas
- Share our ideas
Cheers,
Team Setupsfx_
❤️🚀
Gold: The Start Of The C Wave (Extreme Danger!)After the FED announces their business Gold (XAUUSD) is likely to crash-down and hard.
I will support my statement with data coming from this chart.
The crash doesn't necessarily need to happen instantly. My idea is that we are witnessing a classic ABC correction in Elliott Wave Theory terminology. Let's dive in.
» Trading volume peaked in early April and has been dropping considerably.
» The ATH session ended as a very strong bearish (reversal) signal.
» There is a strong bearish divergence with the RSI. The RSI peaked February 2025 while Gold (XAU) peaked recently. Here is the chart:
Currently, Gold is showing a bounce until the resumption of the corrective bearish move.
Gold is set to move lower based on my interpretation of this chart. Approach with caution, or, go SHORT. You can't go wrong by shorting the top/resistance. Sell at resistance, buy at support.
Namaste.

GOLD → Trend reversal, downward distribution, and new targetsFX:XAUUSD breaks through 3270 and enters a distribution phase amid a rising dollar. We are most likely at the beginning of a trend reversal...
On Thursday, gold remains under pressure, trading at a two-week low, as the market reacts to Trump's statements about potential trade agreements with a number of countries, including China. Optimism surrounding the negotiations is boosting risk appetite, reducing interest in gold as a safe-haven asset. Even weak US GDP and inflation data failed to halt the rise in gold prices, as traders' attention is focused on the trade agenda and upcoming labour market statistics.
Gold is changing its trend due to the rise of the dollar and a shift in the fundamental background. A breakout of the local low could reinforce the decline. The first target is 3190. There is a possibility of a retest of the previously broken consolidation support at 3268 before the decline continues.
Resistance levels: 3245, 3270
Support levels: 3190, 3186, 3167
A breakout of the local low of 3221 could trigger a further decline. The first stop could be around 3190. From this level, a small correction or consolidation may follow before the decline continues.
I do not rule out the possibility of a retest of 3245-3270 before the decline continues.
Best regards, R. Linda!

Gold operation strategyFrom the 4-hour analysis, the support below is around 3300-08. If it does not break, continue to be bullish. Pay attention to the short-term suppression of 3360-66 above. If the daily level stabilizes above this position, continue to maintain the low-multiple rhythm.
Gold operation strategy:
1. Go long when gold falls back to 3320-25, and cover long positions when it falls back to 3300-10, stop loss 3297, target 3355-3360, and continue to hold if it breaks;

sell zone is hereThe price has been in the sell zone. I am using the modified Fiboretracement. The price has shown strength to go down. Now the price is performing a pullback. If the price rises to the cutloss level, then we will cutloss. We have done the analysis, the rest we will wait to see what will happen.

Gold making triangle shape in 4H chart- BearishGold is making triangle shape in 4H chart that will possibly be bearish sign.

XAU/USD Analysis: Chart Indicates Elevated VolatilityXAU/USD Analysis: Chart Indicates Elevated Volatility
The XAU/USD chart shows that the ATR (Average True Range) indicator has reached its highest level in several weeks, signalling increased market volatility.
In addition, trading activity is being fuelled by heightened geopolitical tensions, now including an escalation of the conflict between India and Pakistan.
The price action analysis of the precious metal also provides valuable insight, highlighting the ongoing battle between supply and demand.
Technical Analysis of the XAU/USD Chart
On 23 April, we noted a sharp shift in sentiment after the price of XAU/USD peaked around $3,500.
Gold price fluctuations today suggest continued bearish pressure above $3,400, leading to a downward reversal at peak B, which sits below the previous high at A.
This forms the basis for outlining a descending channel and suggests that bears may attempt to keep the price within its boundaries. On the other hand, the $3,333 level was decisively broken by a wave of buying (shown with a blue arrow), and a bullish “cup and handle” pattern is emerging in the background — it is possible that, as part of the May rally, bulls may try to surpass peak B.
Whatever the outcome, elevated volatility appears likely to persist — especially with the US Federal Reserve’s interest rate decision due today at 21:00 GMT+3, followed by Jerome Powell’s press conference at 21:30.
This article represents the opinion of the Companies operating under the FXOpen brand only. It is not to be construed as an offer, solicitation, or recommendation with respect to products and services provided by the Companies operating under the FXOpen brand, nor is it to be considered financial advice.

Market Analysis: Gold Dips FurtherMarket Analysis: Gold Dips Further
Gold price started a fresh decline below $3,300.
Important Takeaways for Gold Price Analysis Today
- Gold price climbed higher towards the $3,350 zone before there was a sharp decline against the US Dollar.
- A key bearish trend line is forming with resistance near $3,270 on the hourly chart of gold at FXOpen.
Gold Price Technical Analysis
On the hourly chart of Gold at FXOpen, the price climbed above the $3,250 resistance. The price even spiked above $3,300 before the bears appeared.
A high was formed near $3,352 before there was a fresh decline. There was a move below the $3,300 support level. The bears even pushed the price below the $3,250 support and the 50-hour simple moving average.
It tested the $3,200 zone. A low has formed near $3,203 and the price is now showing bearish signs. There was a minor recovery wave above the 23.6% Fib retracement level of the downward move from the $3,352 swing high to the $3,203 low.
However, the bears are active below $3,270. Immediate resistance is near $3,270. There is also a key bearish trend line forming with resistance near $3,270.
The next major resistance is near the $3,295 zone and the 61.8% Fib retracement level of the downward move from the $3,352 swing high to the $3,203 low. The main resistance could be $3,352, above which the price could test the $3,400 resistance. The next major resistance is $3,500.
An upside break above the $3,500 resistance could send Gold price toward $3,550. Any more gains may perhaps set the pace for an increase toward the $3,620 level.
Initial support on the downside is near the $3,240 level. The first major support is near the $3,225 level. If there is a downside break below the $3,225 support, the price might decline further. In the stated case, the price might drop toward the $3,205 support.
This article represents the opinion of the Companies operating under the FXOpen brand only. It is not to be construed as an offer, solicitation, or recommendation with respect to products and services provided by the Companies operating under the FXOpen brand, nor is it to be considered financial advice.

The bull market ends and gold continues to fallGold is currently trading around $3310, facing strong resistance near the )$3320–$3330) zone after a sharp upward move. I am supporting a SELL bias, anticipating a potential rejection from resistance and a move to the downside.
📈Key Resistance:$3330 A key level where I expect sellers to step in.
📈Major Resistance Zone: $3330–$3340 – If broken, further upside is possible, but this zone remains a strong barrier for now.
📉Bearish Targets:
📉Target 1: $3290 Initial support and short-term profit zone.
📉Target 2: $3264 Deeper pullback level.
📉Target 3: $3242 Final target before reaching major demand.
📉Support Area: $3220 $3210
A high-probability demand zone where buyers may defend the level and sellers could take profit.
📊Outlook: I remain bearish as long as price holds below $3330. A clear rejection from this area would strengthen the bearish case. A break above $3340 would invalidate the setup and shift focus to the bullish side.
I know that many people are losing their accounts or opinions due to the sudden rise and fall of their accounts. If you are a novice or you need some free professional advice, please contact me. I hope to help you.

GOLD (XAUUSD): Support & Resistance Analysis For Next Week
Here is my latest structure analysis for Gold.
Resistance 1: 3260 - 3288 area
Resistance 2: 3350 - 3386 area
Resistance 3: 3482 - 3501 area
Support 1: 3191 - 3210 area
Support 2: 3135 - 3167 area
Support 3: 2956 - 2981 area
Consider these structures for pullback/breakout trading.
❤️Please, support my work with like, thank you!❤️
I am part of Trade Nation's Influencer program and receive a monthly fee for using their TradingView charts in my analysis.

Gold Trade Plan 5/5/2025Dear Traders,
If we take a look at the gold chart, it is currently in a descending channel, and the price is trying to reach the top of that channel. Given these conditions, I believe the price will reach the target zone around 3285–3290 by midweek. If we observe a rejection at that level, we can enter a sell position, with the first target being the midline of the channel and the final target being the bottom of the channel. If the descending channel is strongly broken and the price stabilizes above it, a new update will be necessary.
Trend-base Fibo Extension AB=CD 3290
Fibo Retracement(1.618)= 3298
Top Of Descending Channel : 3290-3300
So we Are looking for Reversal 3290-3300 Area !
If you enjoyed this forecast, please show your support with a like and comment. Your feedback is what drives me to keep creating valuable content."
Regards,
Alireza

Valid or fake out? - [1H] formationHere is what I noticed—let me know if this aligns with your perspective or if you see something different.
📌 Wave Structure Alignment
Wave A → C → E show corrective declines within the contracting triangle.
Wave B → D retrace in a controlled manner, respecting contraction limits.
Price tightening near 3392 - 3360, signaling absorption before a breakout move.
📌 Fibonacci Relationship Check
Wave A retraced ~38.2% - 61.8% of the previous impulse move.
Wave B & C followed standard corrective depths (~50% - 78.6%), aligning with expected fib levels.
Wave E represents the final squeeze (~38.2% - 61.8% of Wave D), acting as a breakout trigger.
📌 Liquidity Positioning & Institutional Play
Bullish Breakout Potential: A strong push above 3417 could activate momentum toward 3440 - 3510, but only if absorption transitions into expansion.
Bearish Breakdown Risk: If price rejects 3392, expect a liquidity grab driving price into 3303 - 3370 range.
💡 Verdict: What to Watch Next
The triangle structure appears valid, following typical Fibonacci relationships and smart money positioning. However, the breakout direction remains uncertain—monitor liquidity behavior closely before confirming entry.
📌 Key Levels in Play
🔹 3378 Retest: A crucial resistance zone—failure to reclaim suggests strong sell pressure.
🔹 Break Above: If buyers absorb selling pressure, the move could extend past 3385 pivot, favoring bulls.
🔹 Failure to Hold: A rejection at 3378 could induce fast liquidation, sending price toward 3363 and below.
🔥 Smart Money Perspective
Institutions may test 3378 multiple times before deciding the next move.
If absorption strengthens , price may lean bullish.
If rejection dominates , expect a fast downward sweep into 3339 - 3326 range.
The liquidity game is in play—what’s your take on this setup? Anything you’d fine-tune based on current order flow? 🚀🔥 Would love to hear your perspective!

Latest gold operation analysisFrom the daily level, the current price resistance is in the 3310 area, which is the key watershed of the band trend. If the price is below this position, the subsequent band will be shorted. At the same time, for the short-term four-hour price resistance, it is in the 3253 range. The gains and losses of this position determine the key to the short-term trend. The price will consolidate up and down at this position in the short term. Pay attention to the support of this position and further test the daily resistance area before looking at the pressure.

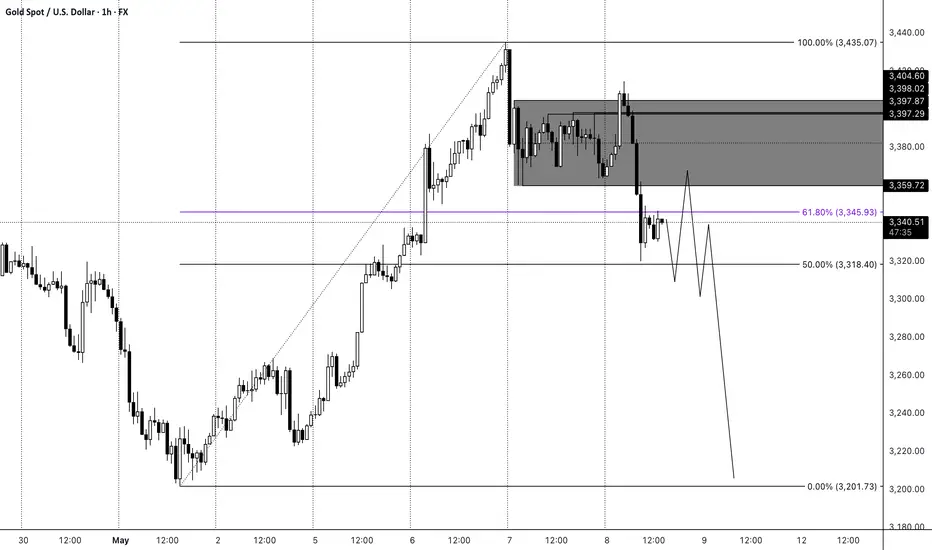
Gold Narrative OverviewGold remains in a long-term and medium-term uptrend, while currently showing signs of a short-term pullback. Given this context, the most logical stance is to continue looking for buying opportunities. However, price has reached rather extreme levels after a sharp and uninterrupted rally in recent weeks. That’s why I lean toward the expectation of at least a temporary pause followed by a downside correction and the formation of a consolidation phase.
On the local timeframe, I anticipate that the price may continue to move lower through a consolidation, targeting the previous support level around 3,201. While short-term bullish impulses are still possible, I expect the broader move to be downward. This bearish setup would be invalidated if the price breaks above 3,380.
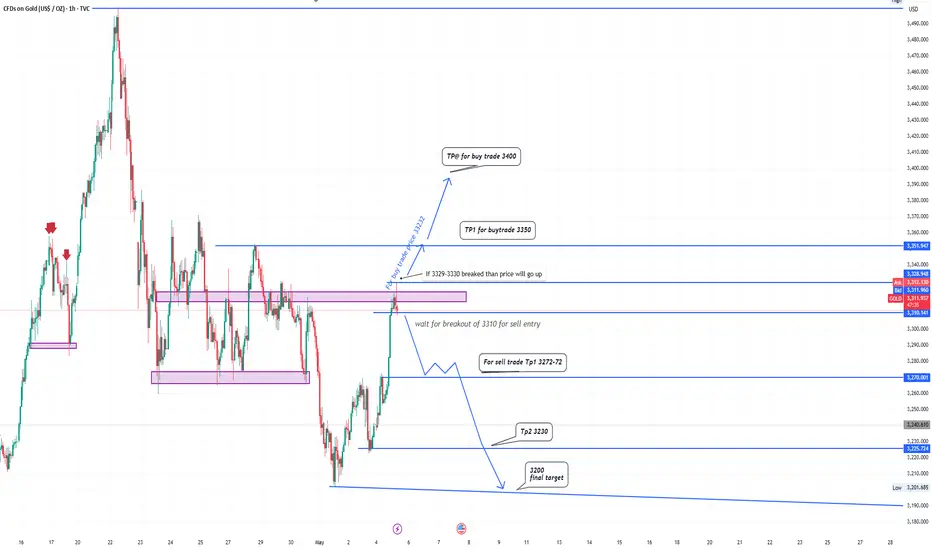
Quick setup on XAUUSD current scenario> The chart shows a consolidation area near 3310–3330, which is a key resistance zone.
> Price recently made a sharp bullish move into that resistance, now testing the zone.
> Several historical rejections (red arrows) align with this level, reinforcing it as a decision point.
:Bullish Scenario (Buy Plan):
Entry Trigger:
If 3329–3330 is broken with confirmation (i.e., retest or strong close above).
Targets:
TP1: 3350
TP2: 3400
Note:
Confirmation might be a retest of 3322, labeled as "buy trap price", which could serve as new support.
Bearish Scenario (Sell Plan):
✅ Entry Trigger:
Wait for a clean break below 3310, which has held as a support.
🎯 Targets:
TP1: 3272–3270
TP2: 3230
Final Target: 3200
🔹 Bearish Flow:
The projected price path is a stair-step decline, suggesting pullbacks before continuation downward.
Summary & Trade Logic:
Bias Condition Entry Level Take Profits
Bullish Break & hold above 3330 Above 3330 (ideally 3329–3330) 3350, 3400
Bearish Break below 3310 Below 3310 3272–70, 3230, 3200