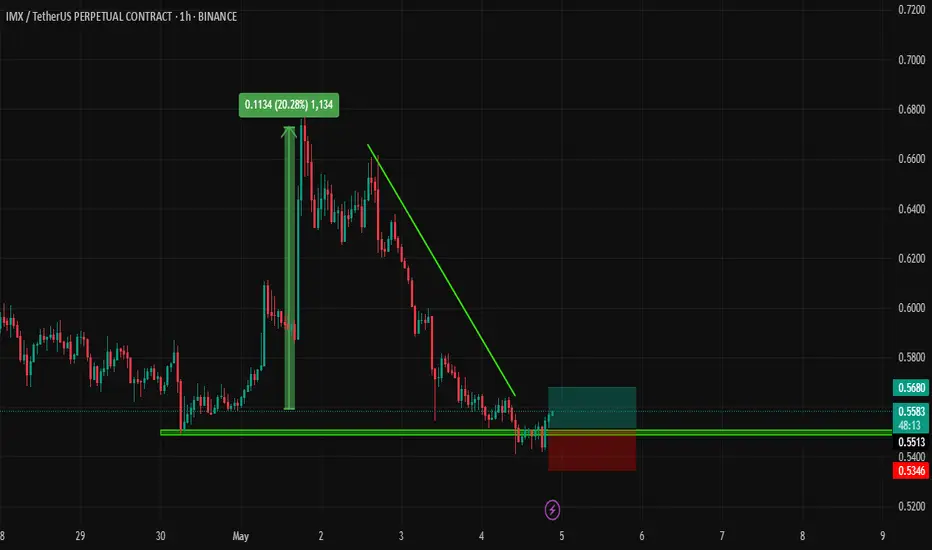
IMX - Is it a movie?IMX Looks like a structure is broken for everyone to watch, but the stances is as shown below!!!!!! We can see that the price was building value comfortably above $0.63–$0.65 until May 2nd. Then, a strong selling move broke below that range, followed by a new value area formation below $0.59, showin

IMXUSDT Forming Inverse Head and Shoulder
IMXUSDT is currently showcasing one of the most reliable bullish reversal patterns on the charts – the inverse head and shoulders. This formation typically signals a shift from a bearish to a bullish trend, and with the neckline nearing a potential breakout point, this setup is becoming increasing

IMX - LONG HOLD The chart tells its own story. Analyzing IMX/USDT on the 1D timeframe, I see strong potential for a long position. The price has broken out of a descending wedge pattern — a classic bullish signal. Current structure shows early signs of a reversal from the bottom zone.
We’ve already seen a bounce

IMX | Trend Is Your FriendTrend is your friend
Expecting massive bullish rally on hourly timeframe✅
Expected 15% bullish wave in coming days🎯🚀


#IMX/USDT#IMX
The price is moving within a descending channel on the 1-hour frame, adhering well to it, and is heading for a strong breakout and retest.
We are seeing a bounce from the lower boundary of the descending channel, which is support at 0.599.
We have a downtrend on the RSI indicator that is abou

#IMX/USDT#IMX
The price is moving within a descending channel on the 1-hour frame, adhering well to it, and is heading for a strong breakout and retest.
We are seeing a bounce from the lower boundary of the descending channel, which is support at 0.390
We have a downtrend on the RSI indicator that is about

LongBuy in part thirty percent,drop ten percent,buy more ,let say 30 percent and if it drop more load thirty percent

#IMX/USDT#IMX
The price is moving within a descending channel on the 1-hour frame and is expected to continue upward.
We have a trend to stabilize above the 100 moving average once again.
We have a downtrend on the RSI indicator, which supports the upward move with a breakout.
We have a support area at t

See all ideas
Summarizing what the indicators are suggesting.
Oscillators
Neutral
SellBuy
Strong sellStrong buy
Strong sellSellNeutralBuyStrong buy
Oscillators
Neutral
SellBuy
Strong sellStrong buy
Strong sellSellNeutralBuyStrong buy
Summary
Neutral
SellBuy
Strong sellStrong buy
Strong sellSellNeutralBuyStrong buy
Summary
Neutral
SellBuy
Strong sellStrong buy
Strong sellSellNeutralBuyStrong buy
Summary
Neutral
SellBuy
Strong sellStrong buy
Strong sellSellNeutralBuyStrong buy
Moving Averages
Neutral
SellBuy
Strong sellStrong buy
Strong sellSellNeutralBuyStrong buy
Moving Averages
Neutral
SellBuy
Strong sellStrong buy
Strong sellSellNeutralBuyStrong buy
Displays a symbol's price movements over previous years to identify recurring trends.