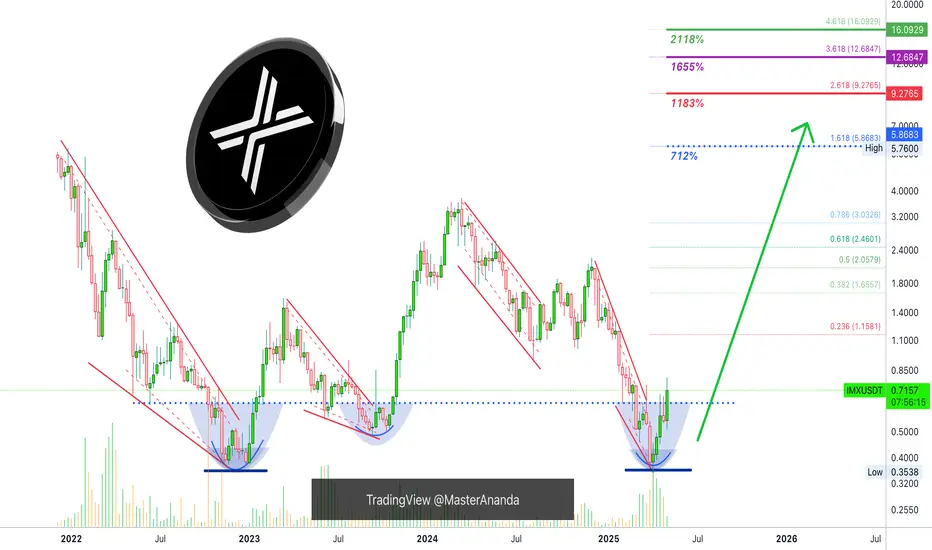
Immutable Long-Term Support Established (New 3000% Wave Starts)Here we have the establishment and confirmation of a long-term support and double-bottom. IMXUSDT activated in April 2025 the same level and low as back in November 2022.
From November 2022 through March 2024 IMX went bullish. This bullish cycle produced 900% total growth (10X).
From March 2024 th
Over 140% profit with IMX (3D)IMX appears to be in a large wave B, which is forming a triangle. It is currently at the end of wave d of B.
It is expected that upon touching the green zone, wave e of B will begin, pushing the price into a bullish phase.
We are looking for buy/long positions in the green zone.
A weekly candle c

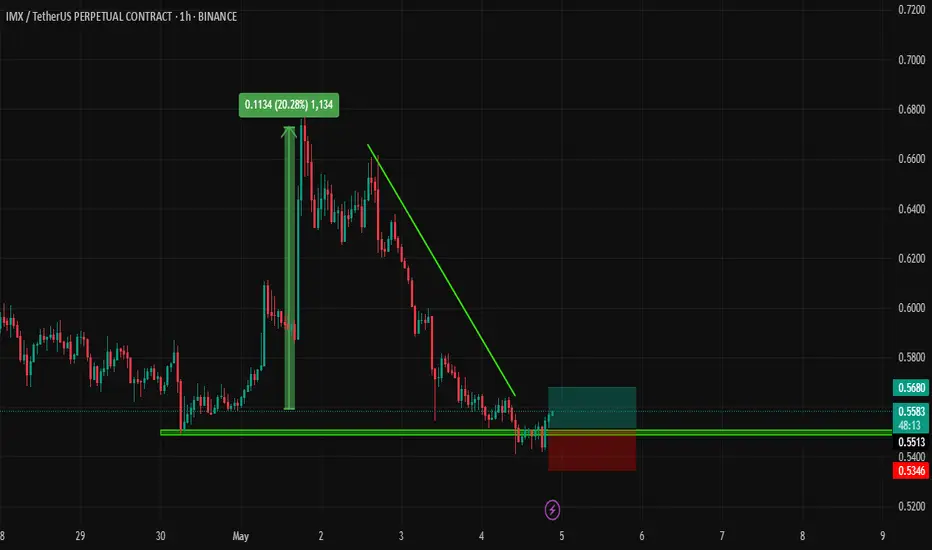
IMX/USDT Analysis. Short Setup
This coin has just tested the volume anomaly zone at $0.72–$0.735 and is already showing an initial reaction. We are considering an intraday short, at least toward the local low (marked with a yellow line).
This publication is not financial advice.

IMX - Is it a movie?IMX Looks like a structure is broken for everyone to watch, but the stances is as shown below!!!!!! We can see that the price was building value comfortably above $0.63–$0.65 until May 2nd. Then, a strong selling move broke below that range, followed by a new value area formation below $0.59, showin

IMXUSDT Forming Inverse Head and Shoulder
IMXUSDT is currently showcasing one of the most reliable bullish reversal patterns on the charts – the inverse head and shoulders. This formation typically signals a shift from a bearish to a bullish trend, and with the neckline nearing a potential breakout point, this setup is becoming increasing

IMX retesting inverse head and shoulders breakout lineIMX is currently retesting the inverse head and shoulders pattern. If we bounce off here we can see a bullish move to the upside. Gaming tokens haven't really taken off yet compared to memes and the big dogs such as BTC and ETH.


IMX - LONG HOLD The chart tells its own story. Analyzing IMX/USDT on the 1D timeframe, I see strong potential for a long position. The price has broken out of a descending wedge pattern — a classic bullish signal. Current structure shows early signs of a reversal from the bottom zone.
We’ve already seen a bounce

#IMX/USDT#IMX
The price is moving within a descending channel on the 1-hour frame, adhering well to it, and is heading for a strong breakout and retest.
We are seeing a bounce from the lower boundary of the descending channel, which is support at 0.599.
We have a downtrend on the RSI indicator that is abou

See all ideas
Summarizing what the indicators are suggesting.
Oscillators
Neutral
SellBuy
Strong sellStrong buy
Strong sellSellNeutralBuyStrong buy
Oscillators
Neutral
SellBuy
Strong sellStrong buy
Strong sellSellNeutralBuyStrong buy
Summary
Neutral
SellBuy
Strong sellStrong buy
Strong sellSellNeutralBuyStrong buy
Summary
Neutral
SellBuy
Strong sellStrong buy
Strong sellSellNeutralBuyStrong buy
Summary
Neutral
SellBuy
Strong sellStrong buy
Strong sellSellNeutralBuyStrong buy
Moving Averages
Neutral
SellBuy
Strong sellStrong buy
Strong sellSellNeutralBuyStrong buy
Moving Averages
Neutral
SellBuy
Strong sellStrong buy
Strong sellSellNeutralBuyStrong buy
Displays a symbol's price movements over previous years to identify recurring trends.