IMX 80% move Incoming? Strong Case for Head @ Shoulders setup.Not financial advice and all charts are posted under current market conditions .
Please do your own research.
IMX has a strong setup here that has me to believe a leaning head and shoulders setup is playing out with entry in the range of around .50-.52c.
I believe below this was a bear trap and as long as .50c area holds we can aim for a target of around 1.00-1.11 range upon completion of head and shoulders.
You can even take profits as it moves up.
Again .50c is key to hold overall.
Risk to reward favors Reward by roughly a little over 80% .
Not to shabby.
Also of note we are holding the bottom channel of the Gaussen channel currently with the bottom of that channel spiking up. Also a great sign.
Lots of hype and and good crowd backing behind this project.
Comment like and follow and for more market insights come see us at exmostudy
IMXUSDT.PS trade ideas

$IMX$IMX
On Daily timeframe level the price action of $IMX broke down the Horizontal Support leve of its Descending Triangle pattern level where the price action took out all the liquidities at Daily Sell Side level where Market Structure Shift also is marked
If the price action breaks the MSS level and closes below it we further expect to see the downward movements

IMX and maybe a good chance for a short positionAn interesting one!
A good purchase order block
An explosive growth and gradual improvement!
Wait for a good confirmation candle to enter

IMX/USDT is Showing Bullish Momentum | Immutable Analysis💎 IMX/USDT is currently navigating a descending channel, with a potential breakout on the horizon.
💎 If this breakout happens, it's poised to catalyze a projected impulsive surge.
💎 Notably, there's a confirmed order block in the shorter timeframe. Due to existing liquidity, the price is anticipated to gravitate toward these levels.
💎 In a previous phase, demand transitioned to supply, leading to a marked price decline and aiming for the prior OB.
💎 In the ever-fluctuating crypto landscape, being updated and flexible is essential. Keep a lookout for further insights and savor your trading voyage.

IMX ANALYSIS (1D)Hi, dear traders. how are you ? Today we have a viewpoint to BUY/LONG the IMX symbol.
For risk management, please don't forget stop loss and capital management
When we reach the first target, save some profit and then change the stop to entry
Comment if you have any questions
Thank You

IMX Big BullsHello Traders!
Welcome back to another trade with analyst Aadil1000x.
Strong bulls are ready to dive in IMX and these bulls will take IMX to previous High.
IMX Buy Now @ 0.7017
Stoploss 0.6728(-4%)
Target 1, 0.7465(+6.3%)
Final Target 0.7961(+13.59%)
Tolls/Indicators
>Directional
Trendline
>Entry
SMA 6 vs EMA 6 Cross, RSI(11 RSI length above 6 MA)
>Strength
Volume Indicator
>Exit/Target strategy
A1000x TR point Strategy
>Impact
LaRSI
I am using an A1000x Breakout Strategy that relies on trendline Breakouts to determine the trade direction. Additionally, I utilize Indicators to determine whether to enter the trade or abstain from it.
Remember to click on the "like" button and follow to stay connected.

IMXUSD ❕ tests the supportPrice and RSI chart formed a convergence (1H TF)
Trading volumes remain low.
I believe that the asset will return to the range.


$IMX, Testing highs since May$IMX
If it can surpass May's highs, it might be worth following or taking action on.
Interestingly, a UCTS 2D Buy signal emerged on yesterday's close while most of the market was showing bearish signals.

imximx technical analysis basically on elliott waves Principles and RTM priceaction strategy
imx can be make high and higher high in 2.50$ and more
wait and watch.


IMXUSDT Steady Ascent in Ascending Channel 📈💎 Over the past 30 days, #IMXUSDT has maintained a consistent upward trajectory within the confines of an ascending channel. Throughout this period, the price has remained above a critical demand zone, situated near $0.6962, suggesting strong interest from buyers in this area.
💎 Recently, #IMX tested the support zone once again, effectively bouncing off the bottom of the ascending channel. This price action signals a continuation of the upward trend, with #IMX potentially aiming for the 161.8% Fibonacci resistance at $0.8360, which aligns with a previously established supply zone.
💎 However, it is essential to consider an alternative scenario where a downtrend takes shape. In this case, a break below $0.6710 would signal a shift from bullish to bearish dominance.

IMX liquidity grab done imx wicked above its strong rejection line and is now trading below it i think that all shorts stop loss are hunt and its now heading towards my target point always manage your risk before taking trades to stay in trading space good luck !

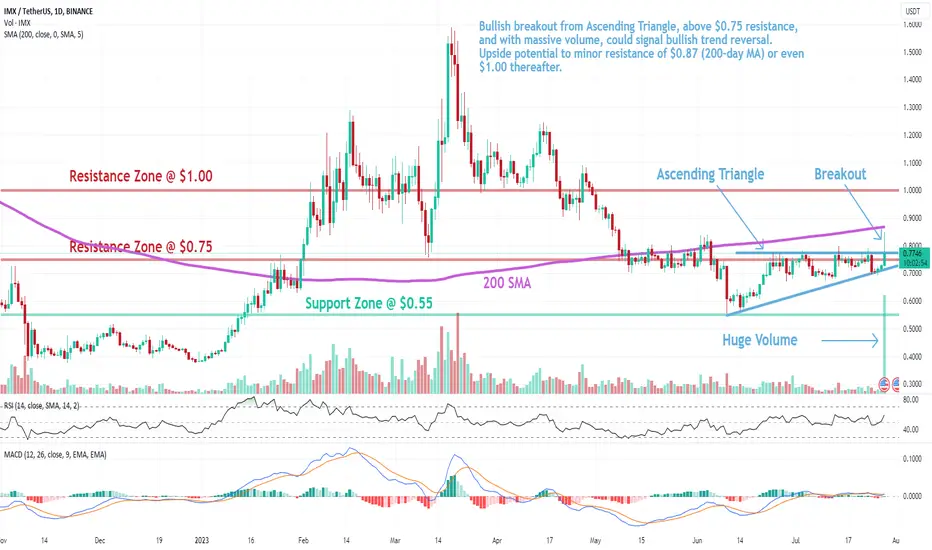
IMX: Ascending Triangle BreakoutTrade setup : Bullish breakout from Ascending Triangle, above $0.75 resistance, and with massive volume, could signal bullish trend reversal. Upside potential to minor resistance of $0.87 (200-day MA) or even $1.00 thereafter.
Pattern : Ascending Triangle which is a continuation pattern (it typically breaks out in the direction of existing trend). Most traders wait for a breakout but Swing traders could trade between the trendlines (Buy at Support, Sell at Resistance) as long as the trendlines are still relatively far apart.
Trend : Neutral on Medium-Term basis and Downtrend on Short- and Long-Term basis.
Momentum is Bullish (MACD Line is above MACD Signal Line and RSI is above 55).
Support and Resistance : Nearest Support Zone is $0.55. The nearest Resistance Zone is $0.75, which it broke, then $1.00, and $1.30.
IMX/USDT bullish setup …!!👀 🚀IMX Today Analysis💎 IMX is primed for a bullish move as it's currently trading within a falling wedge pattern while maintaining strong support. We're anticipating a breakout in the near future.
💎IMX is on the verge of crossing over the EMA 50. If it manages to sustain its position above this level, it could further bolster the bullish momentum.
💎The VRVP is currently showing substantial volume, which is another factor to consider. Moreover, trading in a high-demand area could be a strong signal for a bullish move.
💎If IMX manages to break the resistance area at .749, we could see a significant move towards the $1 mark
💎However, if the price re-enters the box area, it could trigger a significant downward move.
💎In the dynamic world of crypto, staying informed and adaptable is key. Stay tuned for more updates and enjoy your trading journey

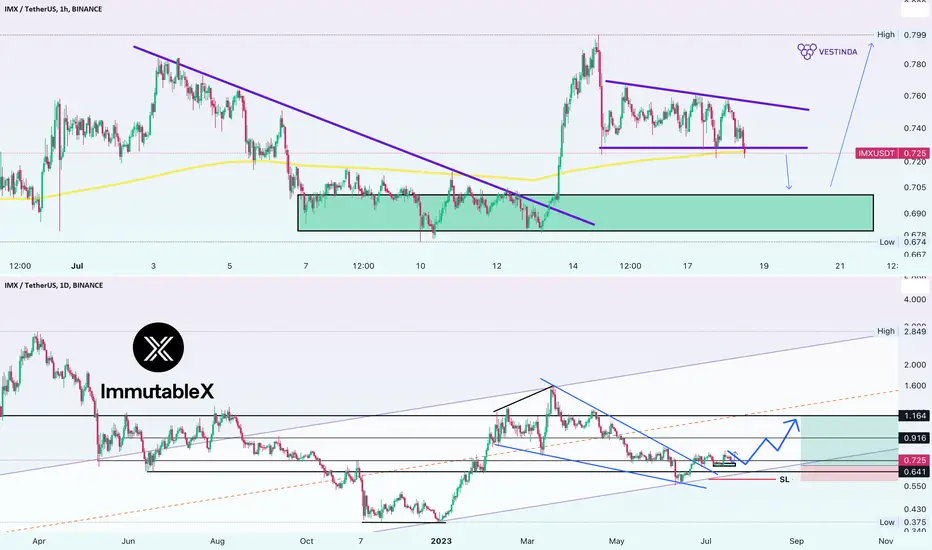
ImmutableX IMXUSDT Price Analysis (1h - 1d)📊✨ IMXUSDT on the 1h timeframe presents an interesting opportunity! Here's what we observed:
Support Zone: There is potential for a slight dip towards the $0.70 support zone, which could set the stage for a potential rebound.
Big Picture Analysis: Looking at the 1-day timeframe, we see a larger structure supporting an upward move.
RSI Divergence: IMXUSDT shows a strong correlation with RSI Divergence, making it a reliable indicator for predicting price movements.
Breakout from Resistance: The price has broken out from the red resistance line, signaling a potential rise and presenting a bullish opportunity.
Bullish Divergence: Prior to the breakout, a bullish divergence pattern was observed, further supporting the anticipated upward movement.
🎯 Price Targets: Our analysis identifies two significant targets at 0.916 and 1.164, representing strong historical resistance and support levels.
Considering the correlation, breakout, and bullish divergence, we anticipate a potential rise in IMXUSDT.

IMX good level for breakAfter a fairly long consolidation, a locally upward movement began.
We are seeing increasing volumes and a tightening of the resistance zone, which can tell us about the continuation of price growth.

45% chance of growth after a little patienceFor this currency, according to the corner pattern and the head and shoulder pattern, there is a break of an important resistance range that coincides with the neck line, so for now we have to wait for it to reach this range and a break with consolidation for this currency. If it happens, then according to technical analysis, we can have a safe entry for this currency with a risk to a good reward.
Analysis every day...


IMX USDT: Short term 2x potential!! We lose the range (danger zone) after spending a considerable amount of time trading within it. We will take part in this by making our trade on the new higher low, which I anticipate will be at the level of 0.6150 since the begin of the big impuls to the new high is a important price point.

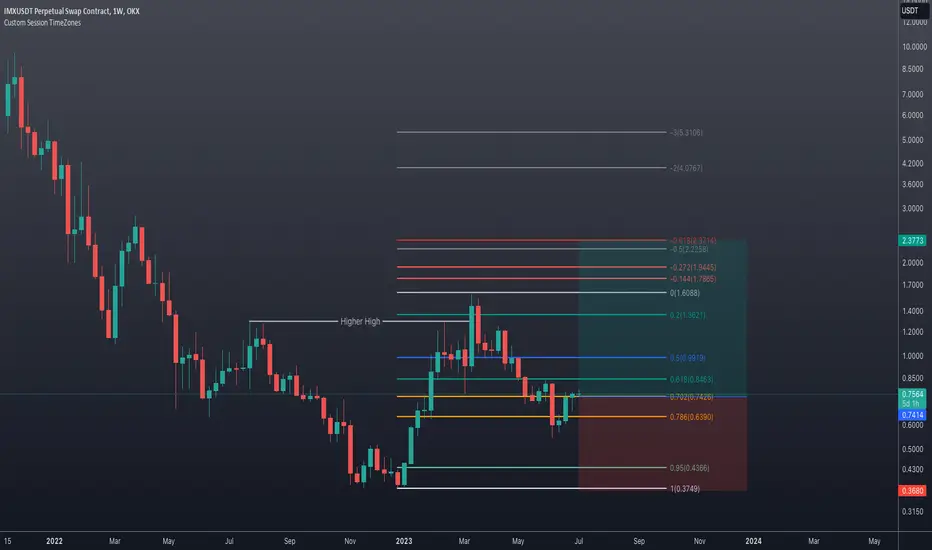
$IMX long tradeIMX is putting in some decent market structure where we could bet on a higher high. Current validation conditions are that the last swing high was a higher high on the weekly time frame.
And we are currently bouncing the the optimal trade entry zone for a fib movement.
Can wait for further confirmation with a higher high on the fractal move around current price ranges.
IMXDisclaimer
High Risk Investment
Trading cryptocurrencies and Forex carries a high level of risk, and may not be suitable for all investors. Before deciding to trade cryptocurrency you should carefully consider your investment objectives, level of experience, and risk appetite. The possibility exists that you could sustain a loss of some or all of your initial investment and therefore you should not invest money that you cannot afford to lose. You should be aware of all the risks associated with cryptocurrency and Forex trading, and seek advice from an independent financial advisor. Since Any opinions, news, research, analyses, prices, or other information contained on this website is provided as general market commentary, and does not constitute investment advice. The Bibres will not accept liability for any loss or damage, including without limitation to, any loss of profit, which may arise directly or indirectly from use of or reliance on such information. All opinions expressed are owned by the respective writer and should never be considered as advice in any form.
A qualified professional should be consulted before making any financial decisions.
-------------------------------------------------------------------------------------------------------------------
