DXY Analysis: Rising Dollar and Market ImplicationsAnalyzing the recent DXY chart, we observe a significant upward movement following a demand build-up. This article explores the implications of a rising U.S. Dollar Index (DXY) on currency pairs and major indices like the SP 500 and NASDAQ, aligning with current market dynamics.
DXY Chart Breakdown:
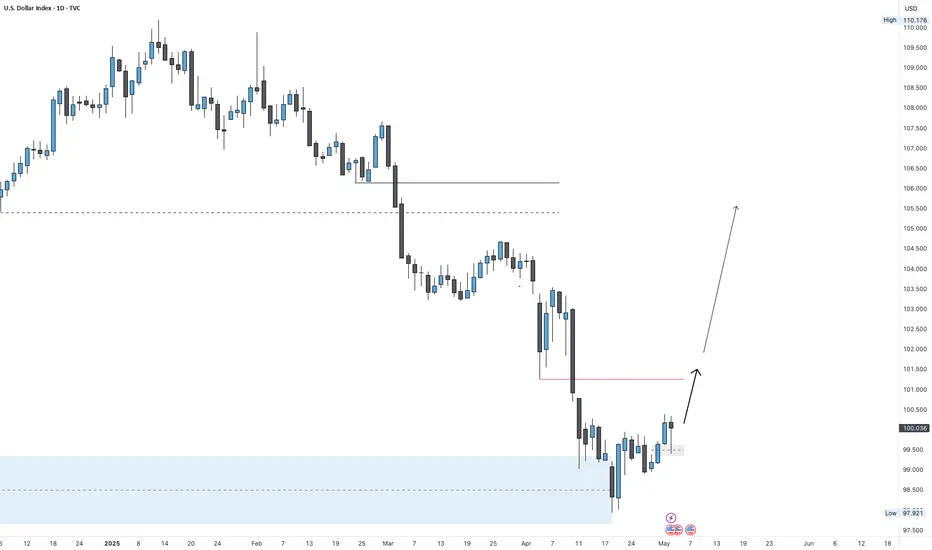
The chart highlights a strong weekly/daily demand level at 98,500, with an internal structural shift marking a pivot point. A demand build-up preceded a sharp rise, tapping the extreme level
of the last point of supply at 100.385, suggesting bullish momentum. The DXY currently
stands at 99.915, with potential to test previous supply levels around 101.850.
Impact on Currency Pairs:
A rising DXY typically strengthens the USD, influencing forex markets:
• XXXUSD Pairs (e.g., EURUSD, GBPUSD): These pairs are likely to decline
as fewer dollars are needed to purchase foreign currencies, reflecting the USD’s
increased value.
• USDXXX Pairs (e.g., USDJPY, USDCAD): These pairs are expected to
climb, as a stronger USD buys more of the counterpart currency.
Exceptions may arise due to region-specific economic data or central bank policies.
Effects on Major Indices:
The strengthening dollar has broader market implications:
• SP 500: Multinational companies may face pressure from reduced overseas earnings, while higher interest rates (often linked to a rising DXY) could lower valuations, potentially leading to declines.
• NASDAQ: Tech-heavy and growth-oriented, the NASDAQ may underperform due
to its sensitivity to a stronger USD and rising borrowing costs, especially for firms
with global revenue.
However, a risk-off sentiment or strong U.S. economic data could counter these effects,
supporting both indices.
Conclusion:
The DXY’s upward trajectory signals a robust USD, likely pressuring XXXUSD pairs
downward and lifting USDXXX pairs. For indices, the SP 500 and NASDAQ may face
headwinds, though context like economic releases or global sentiment will play a key role.
Traders should monitor these levels closely for strategic entries and exits.
Trump’s speech today may create short-term volatility for the DXY. A focus on tariffs could push it toward 101.850.
DXY trade ideas

DXY:Sharing of the Latest Trading StrategyAll the trading signals today have resulted in profits!!! Check it!!!👉👉👉
Today, the 4-hour chart of the DXY shows a volatile downward trend, and it is currently testing the support area of 99.40 - 99.30. Overall, it remains in a downtrend. Pay attention to the resistance near 100.00 above and the support near 99.00 below. Wait for a rebound and then go short.
Trading Strategy:
sell@100.00-99.80
TP:99.00-98.80
The signals in the Signature have brought about continuous profits, and accurate signals are shared every day. Hurry up and click to get them!
👇 👇 👇 Obtain signals👉👉👉

DXY Bullish ideaDXY has a few PD Arrays to support the Bullish idea as I'd like to see the market rally from the Daily FVG but with the current candle bearing I'll monitor the Hourly chart for market structure.

DXY Breakout! Bullish Momentum Targets 103.6 and 107.4 The US Dollar Index (DXY) has just made a strong bullish breakout from the 99.05–100 demand zone, confirming a reversal from its recent downtrend. This region has acted as a high-volume node and key institutional accumulation zone, as highlighted by the LuxAlgo Supply & Demand Visible Range.
Key Technical Highlights:
Demand Zone: The 98.5–100.5 range showed significant volume buildup and price rejection, signaling strong buyer interest.
Breakout Confirmation: Price broke through minor resistance at 101.2 with strong momentum and a bullish candle close.
Next Target: Eyes on 103.621, the next key resistance zone. A break above may push DXY towards 107.467, aligning with a major supply area.
Volume Profile: Low volume between 101.2 and 103.6 suggests a potential quick move toward the next resistance.
Indicators: RSI trending up but not yet overbought. MACD shows early bullish crossover on the 4H timeframe.
Fundamentals to Watch:
Upcoming USD economic data (CPI, Retail Sales, FOMC minutes).
Risk-off sentiment globally could boost USD as a safe-haven play.
Trade Plan (Not Financial Advice):
Buy Zone: Already triggered breakout above 101.2.
TP1: 103.6
TP2: 107.4
SL: Below 99.8 to invalidate the breakout thesis.
What do you think? Will DXY continue its bullish move or face rejection around 103.6? Let’s discuss in the comments.

Viper Sunday Breakdown May11th 2025On Sunday's we give a weekly peek into the markets and see what happened last week and what's possible for the week ahead.
Using the Viper indicator and 3 distinct strategies we breakdown DXY,Gold, US30, Nas100, Oil and Forex pairs.
CPI news coming this week, looking for a great volatile week ahead!!

Dollar Index AnalysisThe index is in an ascending channel on the 4-hour timeframe.
With the correction in the middle line, we expect the trend to continue to the specified targets.

DXY – Bullish BiasThe dollar remains firm, supported by persistent U.S. inflation and a hawkish Fed narrative. With CPI data due midweek, an upside surprise could reinforce dollar strength

Do Not Be Fooled TVC:DXY is not truly weak. Over the past 2 months the only thing mainstream Fin Media has been talking about is how Dollar value is plummeting and while I do not debate the merits o that I do take contention with the idea that this means the DXY Will KEEP going down significantly from here. From a pure TA perspective DXY is simply in a consolidation phase with a high level volatility which did not begin with the recent drop in March. I began watching DXy like a HAWK in November 2024 and for anyone who has not, the extreme volatility began then with DXY going on a rally from Nov 24 to feb 25. The move from Mach until now has been simply another leg of vol extension. This is important to realize because the volatility now points to higher levels of it eventually returning and when that happens I predict it will take the form of an explosive impulse to the upside based on the long term inverse head and shoulders pattern coupled with the near textbook bull flag pattern

DXY Outlook: FVG Retest Complete — Is 105 the Next Sweep?DXY Weekly Forecast
In recent weeks, DXY dropped to the extreme demand zone, sweeping the lows around 98–99, before launching a bullish reversal and breaking through multiple minor highs.
Last Friday, price retested a daily Fair Value Gap — perfectly aligned with the NFP release — and held. Now, we may see some sideways consolidation at this level before continuation higher toward the 105.000 zone, where key liquidity sits above prior highs.
Bias: Bullish
Key Zones:
• Support: 102.000 (FVG / demand area)
• Resistance: 105.000 (liquidity target)
The structure is clean: bulls in control, as long as the FVG zone holds.
—
Weekly forecast by Sphinx Trading
Drop your thoughts in the comments.
#DXY #DollarIndex #USD #ForexAnalysis #LiquiditySweep #SphinxWeekly #FairValueGap #NFP #SmartMoney
Bearish reversal?US Dollar Index (DXY) is rising towards the pivot and could reverse to the 1st support.
Pivot: 100.51
1st Support: 97.85
1st Resistance: 101.83
Risk Warning:
Trading Forex and CFDs carries a high level of risk to your capital and you should only trade with money you can afford to lose. Trading Forex and CFDs may not be suitable for all investors, so please ensure that you fully understand the risks involved and seek independent advice if necessary.
Disclaimer:
The above opinions given constitute general market commentary, and do not constitute the opinion or advice of IC Markets or any form of personal or investment advice.
Any opinions, news, research, analyses, prices, other information, or links to third-party sites contained on this website are provided on an "as-is" basis, are intended only to be informative, is not an advice nor a recommendation, nor research, or a record of our trading prices, or an offer of, or solicitation for a transaction in any financial instrument and thus should not be treated as such. The information provided does not involve any specific investment objectives, financial situation and needs of any specific person who may receive it. Please be aware, that past performance is not a reliable indicator of future performance and/or results. Past Performance or Forward-looking scenarios based upon the reasonable beliefs of the third-party provider are not a guarantee of future performance. Actual results may differ materially from those anticipated in forward-looking or past performance statements. IC Markets makes no representation or warranty and assumes no liability as to the accuracy or completeness of the information provided, nor any loss arising from any investment based on a recommendation, forecast or any information supplied by any third-party.

A Brief Summary of Trump's 100 Day and Effects on U.S. EconomyOverview
In the 2024 campaign, Donald Trump proposed an aggressive "America First" economic agenda. His key proposals centered around four pillars: tariffs and trade, tax policy, energy and environment, and regulatory changes . These proposals built upon his first-term policies but were more sweeping and intense.
Key Proposals
1. Tariffs & Trade
Universal import tariffs of 10–20% across all goods.
60% tariffs on Chinese imports , plus targeted tariffs on Mexico and Canada (linked to immigration and drug policy).
Threatened reciprocal tariffs and 100% tariffs on BRICS nations .
Proposed tariffs on U.S. companies that offshore production.
2. Taxes & Fiscal Policy
Make all 2017 Tax Cuts and Jobs Act provisions permanent (individual, corporate, estate taxes).
Lower corporate tax rate to 20% or 15% for domestic production.
Expand tax credits for “ Made in America ” goods, SALT relief, caregiver and overtime pay.
Analysts estimate a $5–11 trillion reduction in federal revenue over a decade due to these cuts.
3. Energy & Environment
Rescind Biden-era climate regulations, including EPA emissions standards and clean-energy mandates.
Repeal unspent Inflation Reduction Act (IRA) funds, ending subsidies for EVs, solar, wind, and batteries.
Open federal lands and waters for fossil fuel production, aiming to boost oil output by 3 million barrels/day .
4. Deregulation & Crypto
Slash regulations in energy, finance, and technology sectors.
Promote crypto: proposed a government Bitcoin reserve and replacing SEC leadership.
Vowed to cut federal bureaucracy and fast-track project permitting.
Projected Economic Impact (2024–2026)
GDP Growth
Analysts predict modestly slower growth under Trump.
High tariffs may reduce long-run GDP by 6% and wages by 5% , per Penn Wharton Budget Model.
Tariff effects are projected to outweigh gains from tax cuts and deregulation.
Employment
Slower GDP growth would moderate job gains.
Tariffs could hurt export industries and raise input costs.
Deregulation and tax incentives may support hiring in energy and construction.
Inflation
Most economists agree Trump’s tariffs would raise consumer prices.
Combined with deficit-financed tax cuts, inflation could rise 4–7 percentage points above baseline by 2026.
This would likely delay or reverse Fed rate cuts.
Interest Rates
Rising inflation would pressure the Federal Reserve to keep rates higher for longer.
Bond markets have already priced in higher yields in response to Trump’s proposed tariffs.
Stock Market
Markets initially rallied on tax and deregulation hopes.
Bitcoin hit all-time highs; S&P 500 surged post-election.
However, trade war fears caused sell-offs in early 2025, especially in tech and consumer sectors.
Business & Consumer Sentiment
Business leaders expressed concern over trade uncertainty.
Consumer polls show widespread fear of rising prices.
CEO confidence rose post-election due to expected pro-business policies, despite tariff concerns.
Summary Outlook
GDP growth expected to slow below the ~ 2.8% pace of late 2024.
Inflation likely to climb above 3% , driven by tariffs and fiscal stimulus.
Interest rates may remain high due to inflationary pressures.
Markets may oscillate—rallying on tax cuts but reacting negatively to trade disruptions.
Overall effect is mixed: pro-growth tax cuts and deregulation may not fully offset the drag from trade and inflation risks.
Sources
Tax and Fiscal: Tax Foundation, Committee for a Responsible Federal Budget (CRFB)
Trade and Tariffs: Center for Strategic and International Studies (CSIS), Penn Wharton Budget Model
Energy and Environment: NPR, Thomson Reuters, Hoover Institution
Macroeconomic Impact: Hoover Institution, Stanford Institute for Economic Policy Research (SIEPR), Peterson Institute
Market Reaction: Reuters, ABC News, AP, Bloomberg
Sentiment Surveys: PwC, Conference Board, PBS, ABC/Washington Post

DXY Bearish Forecast for Quarter 2, 20251. Technical analysis
The idea is based in ICT's PO3; AMD pattern.
We have a rally above the open price of May 2025, to take out BSL above the highs.
It also aligns with Daily tf premium arrays to short from.
The lowest hanging fruit being the relative equal lows at equilibrium of the dealing range.
2. Fundamental analysis
Investor's confidence in the Dollar is low due to POTUS' tariffs.
ICT: Inner Circle Trader
PO3: Power of 3
AMD: Accumulation, Manipulation & Distribution
BSL: Buy side liquidity
tf: Timeframe

DXY Will Fall! Sell!
Hello,Traders!
DXY keeps strengthening
These last days and the index
Has almost reached a horizontal
Resistance level of 100.500
From where we will be expecting
A local bearish pullback and
A local move down
Sell!
Comment and subscribe to help us grow!
Check out other forecasts below too!
Disclosure: I am part of Trade Nation's Influencer program and receive a monthly fee for using their TradingView charts in my analysis.

USDX,DXYUSDX price is near the important support zone 98.23-97.75. If the price cannot break through the 97.75 level, it is expected that in the short term there is a chance that the price will rebound.
**Very Risky Trade
🔥Trading futures, forex, CFDs and stocks carries a risk of loss.
Please consider carefully whether such trading is suitable for you.
>>GooD Luck 😊
❤️ Like and subscribe to never miss a new idea!

Dxy bullish idea for next week - MMBMThis is a bullish possibility for DXY price action for next week.
Monthly:
- Price took a swing low confluent with a bearish breaker in discount and closed above the level;
Weekly:
- Price Took a swing below monthly swing with a bullish reaction. If this week closes with above previous weeks high, it confirms a bullish weekly swing;
Daily:
- Monday printed the likelly low of the week
- A daily fair value gap is open allow with a volume imballance around monday open signalling bullish price action - a retrace to these levels would be a good buying opportunity.
4h:
- there is a market maker buy model in play.
- as of now, price already printed an intermidiate term low signalling that low risk buy myght have happened.
News forecast:
- I expect NFP to either retrace price to daily fvg or daily volume imbalance and leave a bullish reaction.
- FOMC next week might bring the volatility to complete the mmbm
Thank you for reading

Bearish Crab Pattern Will Start from 100.7The dollar index has retreated from 100.7, a movement potentially correlated with a bearish crab pattern observed in market analysis.
Further observation is warranted to confirm the validity and predictive power of this pattern in forecasting future dollar index fluctuations.

US DOLLAR INDEX TO RISE TO 100.90Dear traders, based on the chart, the falling trend-line is clearly broken and retested and the price is supported by a rising trend-line as well. This implies a big possibility of further rise towards 100.90. Let's See!

DXY4h chartwe can see clearly a head and shoulders in DXY plus the last week make a big move to the down side, i think he looking for take a breath.

29.04.25 Morning ForecastPairs on Watch -
GBPJPY
AUDUSD
EURUSD
A short overview of the instruments I am looking at for today, multi-timeframe analysis down to what I will be looking at for an entry. Enjoy!

DXY updateDaily fractals shifted to bullish But the overall daily swing is bearish
so it might be counted as a retracement of the overall trend.
there is a supply zone upside high probs for price to tab 101 level .
In 2h fractals shift for upside has happened after a liq-swept .
so to conclude short time bearish trend gonna happend for xxx / usd pairs
and bullish for usd / xxx...

Dollar Index - April ReviewI am looking for a continuation in bullish price action, aiming for low hanging fruits with the first point of interest being 101.917


"DXY Dollar Index" Market Bullish Heist Plan (Day/Swing Trade)🌟Hi! Hola! Ola! Bonjour! Hallo! Marhaba!🌟
Dear Money Makers & Robbers, 🤑 💰💸✈️
Based on 🔥Thief Trading style technical and fundamental analysis🔥, here is our master plan to heist the "DXY Dollar Index" Bank Heist. Please adhere to the strategy I've outlined in the chart, which emphasizes long entry. Our aim is to escape near the high-risk ATR Line Zone. It's a Risky level, overbought market, consolidation, trend reversal, trap at the level where traders and bearish robbers are stronger. 🏆💸"Take profit and treat yourself, traders. You deserve it!💪🏆🎉
Entry 📈 : "The heist is on! Wait for the Crossing previous high (100.400) then make your move - Bullish profits await!"
however I advise to Place Buy stop orders above the Moving average (or) Place buy limit orders within a 15 or 30 minute timeframe most recent or swing, low or high level for Pullback entries.
📌I strongly advise you to set an "alert (Alarm)" on your chart so you can see when the breakout entry occurs.
Stop Loss 🛑: "🔊 Yo, listen up! 🗣️ If you're lookin' to get in on a buy stop order, don't even think about settin' that stop loss till after the breakout 🚀. You feel me? Now, if you're smart, you'll place that stop loss where I told you to 📍, but if you're a rebel, you can put it wherever you like 🤪 - just don't say I didn't warn you ⚠️. You're playin' with fire 🔥, and it's your risk, not mine 👊."
📍 Thief SL placed at the nearest/swing low level Using the 2H timeframe (99.000) Day/swing trade basis.
📍 SL is based on your risk of the trade, lot size and how many multiple orders you have to take.
🏴☠️Target 🎯: 102.300
🧲Scalpers, take note 👀 : only scalp on the Long side. If you have a lot of money, you can go straight away; if not, you can join swing traders and carry out the robbery plan. Use trailing SL to safeguard your money 💰.
💰💵💸"DXY Dollar Index" Bank Money Heist Plan is currently experiencing a bullishness,., driven by several key factors. .☝☝☝
📰🗞️Get & Read the Fundamental, Macro Economics, COT Report, Geopolitical and News Analysis, Sentimental Outlook, Intermarket Analysis, Index-Specific Analysis, Future trend targets with Overall outlook score... go ahead to check 👉👉👉🔗🔗🌎🌏🗺
⚠️Trading Alert : News Releases and Position Management 📰🗞️🚫🚏
As a reminder, news releases can have a significant impact on market prices and volatility. To minimize potential losses and protect your running positions,
we recommend the following:
Avoid taking new trades during news releases
Use trailing stop-loss orders to protect your running positions and lock in profits
💖Supporting our robbery plan 💥Hit the Boost Button💥 will enable us to effortlessly make and steal money 💰💵. Boost the strength of our robbery team. Every day in this market make money with ease by using the Thief Trading Style.🏆💪🤝❤️🎉🚀
I'll see you soon with another heist plan, so stay tuned 🤑🐱👤🤗🤩
