INJ short down to $8.833 areaLooking at he pa overall it seems INj market wants to dump the price lower down to $8.833 area.
Maybe it doesn't happen now fully but it probably will break down bearishly to start then correct a bit before continuing..or who knows.
I saw this a bit late. Would have liked a better entry with higher stop. Current stop is not that bad but it doesn't provide full invalidation. Anyone seeing this now - waiting for 15 minute tf to correct a bit or use wide stop best.
INJUSDT.P trade ideas

TradeCityPro | INJUSDT Ready for a Big Move?👋 Welcome to TradeCityPro Channel!
Let’s dive in and analyze one of the popular crypto projects, INJ, which has a high likelihood of movement, and check our entry triggers together.
🌐 Overview Bitcoin
Before starting the analysis, I want to remind you again that we moved the Bitcoin analysis section from the analysis section to a separate analysis at your request, so that we can discuss the status of Bitcoin in more detail every day and analyze its charts and dominances together.
This is the general analysis of Bitcoin dominance, which we promised you in the analysis to analyze separately and analyze it for you in longer time frames.
📊 Weekly Time Frame
On the weekly time frame, I see that the seventh period is stable, INJ, and compared to the majority of altcoins that have their own low price levels, it is in a better space and is engaged in its own supports!
After breaking the primary trend ceiling, namely 9.28, we experienced a sharp upward movement and formed a historical ceiling at $53, and after forming a distribution box and breaking the important floor of 16.20 and pulling back to it, we experienced a continued decline.
We have now reached support again, which was previously a very important resistance, and now, as a result, it is probably not lost, but the weekly candle is a very good and bearish candle! Don’t forget to save your profit, your strategy booklet, and your positions, otherwise, you will have made a 450% move without adding anything to your capital!
📉 Daily Time Frame
On the daily time frame, our trend is completely bearish as you can see, and the events are completely accompanied by the formation of a downward bottom and top, but we are likely to suffer for a while.
After getting rejected from 34.16 and forming a box between 20.16 and 25.93 and losing the bottom, it made a move and then while pulling back with low volume and the next conversion to red, it became an inverted Sharpe, we experienced a decline!
After breaking the daily trendline, which was also an important trendline, its trigger at 8.48 was broken, and we are currently engaged with the resistance at 10.47, and the next and most important trigger, so to speak, is after breaking 10.47, and you can even have a spot buy with this level!
🕓 4-Hour Timeframe
In the 4-hour time frame, we are also ranging between the box of 9.24 to 10.41, and practically, whichever side we break, we can say we can take its position and go along with it!
📈 For a long position, the trigger is completely clear, and after breaking 10.41, make sure to take a long position, and you can even open a position before this trigger breaks with the presence of momentum in lower time frames!
📉 For a short position, we have just formed the support at 9.24, and if we bounce from this support and hit a lower high, or better yet, get rejected before 10.41, we go for a short position and a break of 9.24!
✍️ Final Thoughts
Stay level headed, trade with precision, and let’s capitalize on the market’s top opportunities!
This is our analysis, not financial advice always do your own research.
What do you think? Share your ideas below and pass this along to friends! ❤️

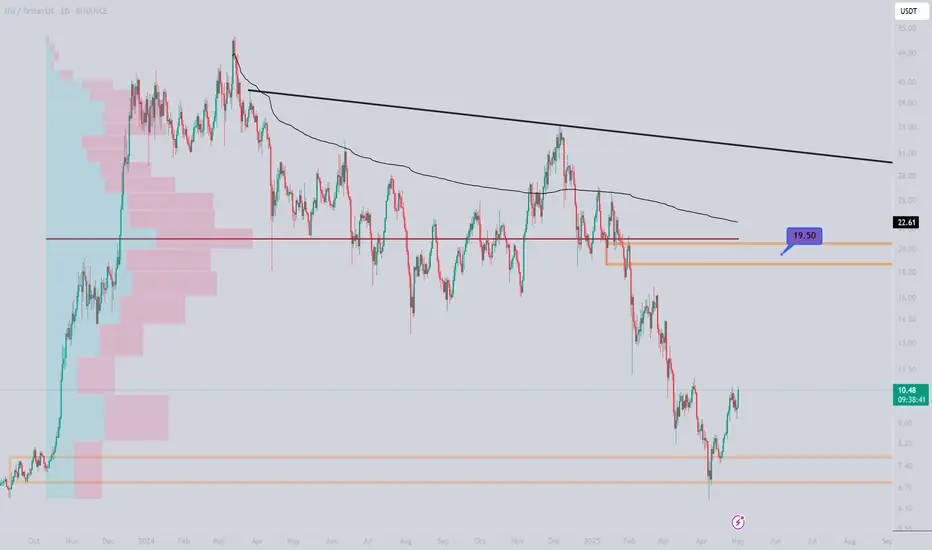
INJUSDT Potential UpsidesHey Traders, in today's trading session we are monitoring INJUSDT for a buying opportunity around 9.50 zone, INJUSDT is trading in an uptrend and currently is in a correction phase in which it is approaching the trend at 9.50 support and resistance area.
Trade safe, Joe.

$INJ Breakout Alert!CRYPTOCAP:INJ breakout alert!
-It finally broke above the downtrend line after months of
consolidation.
-Retest and holding the key support zone around $8.50–
$9.00.
-Now, we are aiming for the next leg toward $26, a
Potential 184% move.
-Trend shift confirmed. Watch closely!🚀
DYRO, NFA

INJUSDTConsidering the monthly candle close
and the important breakeven and montomai range that it has taken
I expect growth to reach the 19 range in the first price step
Inj scalp short to 9.5Just now opened a scalp short position on inj. Targetting 9.5 area. Just a quick trade. It might spike lower but being conservative

#INJ/USDT#INJ
The price is moving within a descending channel on the 1-hour frame, adhering well to it, and is heading for a strong breakout and retest.
We are seeing a rebound from the lower boundary of the descending channel, which is support at 9.54.
We have a downtrend on the RSI indicator that is about to be broken and retested, supporting the upward trend.
We are looking for stability above the 100 moving average.
Entry price: 10.00
First target: 10.32
Second target: 10.64
Third target: 11.00

INJ Breakdown in 1H | Bears in Control👀 Welcome to my Trading View Analysis and Trading Channel Here , we share the latest market analysis, trading signals, and key insights together .
Ready for smarter trades ? ⭐️
⚡️Today , we're going to analyze the INJ ( Injective) coin together on the daily timeframe and find triggers for our positions .
📉 INJ 1H Technical Breakdown
The INJ coin is currently exhibiting signs of weakness on the 1-hour timeframe, having broken below the key support level at $9.18 and continuing its downward trajectory. This movement indicates a shift in market sentiment towards bearishness.
Binance
🧭 Trend & Indicators:
Downtrend Formation: A clear downtrend is forming, characterized by lower lows and lower highs, suggesting sustained selling pressure.
Increasing Selling Volume: There's a noticeable increase in selling volume, reinforcing the bearish momentum.
Binance
RSI Approaching Oversold: The Relative Strength Index (RSI) is nearing the oversold zone, indicating potential for further downside but also cautioning traders of possible short-term reversals.
Price Below SMAs: The price is closing below all three Simple Moving Averages (SMAs), signaling a continuation of the bearish structure.
EMA 50 Rejection: A sharp rejection occurred after a retest of the EMA 50, followed by a strong red candle — a classic sign of bearish strength.
📰 Recent Developments:
Price Decline: Over the past week, INJ's price has declined by approximately 8.3%, reflecting broader market corrections.
CoinGecko
Market Activity: Despite the price drop, Injective's trading volume remains robust, indicating continued investor interest and market activity.
CoinCarp
+15
crypto.news
+15
Coinbase
+15
Technical Patterns: Analysts have observed that INJ has broken below the $10.25–$10.30 support zone, triggering a bearish continuation pattern.
Binance
📌 Trading Insight:
With proper risk management and a solid trading plan, this setup offers a potential short opportunity. The technical signals are aligned, and momentum appears to favor sellers for now.
🎯 Watch for continuation patterns or lower time frame triggers to enter with precision.
I love you all so much . 👀
don't forget about capital management and risk management .
Be careful with your positions . 🥇

Inverse H&S on Inj Injective has been very strong for the past two weeks
Now it will form an Inverse Head And Shoulders
89% profit target

INJUSDT 1D AnalysisINJ ~ 1D Analysis
#INJ Buy after successfully penetrating this resistant line with a short -term target of at least 10%+.

INJ Is Nearing An Important SupportHey Traders, in today's trading session we are monitoring INJ/USDT for a buying opportunity around 9.90 zone, INJ/USDT is trading in an uptrend and currently is in a correction phase in which it is approaching the trend at 9.90 support and resistance area.
Trade safe, Joe.

Inj long to $9.655 today!I flipped bullish on #Injective
📈Just went long
🎯Target: $9.655
💸partial: $9.555
🛑$9.193 stop or lower
DTT applied.
#injusdt #inj

InJ short to $9.42 areaJust opened a scalp short on INJ. Targeting $9.42.
Stop around $10.13 or higher
Time sensitive

#INJ/USDT#INJ
The price is moving within a descending channel on the 1-hour frame, adhering well to it, and is heading for a strong breakout and retest.
We are experiencing a rebound from the lower boundary of the descending channel, which is support at 7.50.
We are experiencing a downtrend on the RSI indicator that is about to break and retest, supporting the upward trend.
We are looking for stability above the 100 Moving Average.
Entry price: 7.71
First target: 7.92
Second target: 8.42
Third target: 8.90

#INJ/USDT#INJ
The price is moving within a descending channel on the 1-hour frame, adhering well to it, and is heading for a strong breakout and retest.
We are seeing a bounce from the lower boundary of the descending channel, which is support at 8.25.
We have a downtrend on the RSI indicator that is about to be broken and retested, which supports the upward trend.
We are looking for stability above the 100 Moving Average.
Entry price: 8.58
First target: 8.80
Second target: 9.03
Third target: 9.31

inj breaks long consolidation 30$ coming injective one the solid utilty token recently breaks long descending channel consolidation in result expecting strong recovery in coming weeks expecting move towards 30$ in coming weeks

Getting out of pain and breaking EMAThis currency has a recurring pattern on the daily time frame, which makes an upward Sharpe whenever it breaks out of the range and reaches the $8 price range.
$INJ: Preparing for a Possible Impulsive Move UpCRYPTOCAP:INJ – Setting Up for a Potential Impulsive Move
After a sharp correction, CRYPTOCAP:INJ may be preparing for a strong rebound.
In a previous idea, I forecasted a bottom at $8.5 — and it dipped even lower to $7, fully retracing last year's pump.
The price broke below the bearish flag after a clear bearish divergence at the top. It also sliced through my green buy zone and is now sitting right on a critical support level at $8.40.
🚀 Signs of recovery are starting to show:
🔹 MACD is climbing and approaching the median line — a bullish crossover could ignite an impulsive rally.
🔹 Price is stabilizing above the key $8.40 support.
🔹 RSI is low and consolidating — signaling potential upside.
🔹 Volume is quiet — often a precursor to strong moves.
The target is to re-integrate the green liquidity zone, to prepare another explosive pump.
📅 Reminder: around this time last year, CRYPTOCAP:INJ pulled off a 4x rally. While past performance doesn't guarantee future results, the setup looks promising.
🧠 DYOR | This is not financial advice.
#INJ #CryptoAnalysis #Altcoins #TechnicalAnalysis #MACD #CryptoMarket #BreakoutSetup #DYOR

INJUSDT | One of Today’s Top Volume GainersINJUSDT has been catching attention again, leading the pack in trading volume today. We already shared an analysis earlier, and now there’s a fresh opportunity: the red box marked on your chart is another high‑probability zone to consider for shorts.
🔴 Short Setup at the Red Box
• Observe how price approaches the red box and look for signs of exhaustion on lower time frames.
• Wait for a clean breakdown in structure, confirmed by CDV divergence and rising selling volume. That’s your trigger to enter a short position.
• Place your stop just above the red box to keep risk defined and manageable.
🟢 What Could Flip This Bias
If INJ breaks above the red box with conviction – strong volume and a successful retest as support – I will shift gears and look for longs instead. No breakout, no long bias.
✨ Why You Want to Follow This
These resistance levels aren’t random. They come from years of watching market behavior and fine‑tuning entries that work. Most traders chase every spike and get caught. You’re trading with clear signals and confirmations – and that makes all the difference.
I will not insist on my short idea. If the levels suddenly break upwards and do not give a downward break on the low time frame, I will not evaluate it. If they break upwards with volume and give a retest, I will look long.
📌I keep my charts clean and simple because I believe clarity leads to better decisions.
📌My approach is built on years of experience and a solid track record. I don’t claim to know it all but I’m confident in my ability to spot high-probability setups.
📌If you would like to learn how to use the heatmap, cumulative volume delta and volume footprint techniques that I use below to determine very accurate demand regions, you can send me a private message. I help anyone who wants it completely free of charge.
🔑I have a long list of my proven technique below:
🎯 ZENUSDT.P: Patience & Profitability | %230 Reaction from the Sniper Entry
🐶 DOGEUSDT.P: Next Move
🎨 RENDERUSDT.P: Opportunity of the Month
💎 ETHUSDT.P: Where to Retrace
🟢 BNBUSDT.P: Potential Surge
📊 BTC Dominance: Reaction Zone
🌊 WAVESUSDT.P: Demand Zone Potential
🟣 UNIUSDT.P: Long-Term Trade
🔵 XRPUSDT.P: Entry Zones
🔗 LINKUSDT.P: Follow The River
📈 BTCUSDT.P: Two Key Demand Zones
🟩 POLUSDT: Bullish Momentum
🌟 PENDLEUSDT.P: Where Opportunity Meets Precision
🔥 BTCUSDT.P: Liquidation of Highly Leveraged Longs
🌊 SOLUSDT.P: SOL's Dip - Your Opportunity
🐸 1000PEPEUSDT.P: Prime Bounce Zone Unlocked
🚀 ETHUSDT.P: Set to Explode - Don't Miss This Game Changer
🤖 IQUSDT: Smart Plan
⚡️ PONDUSDT: A Trade Not Taken Is Better Than a Losing One
💼 STMXUSDT: 2 Buying Areas
🐢 TURBOUSDT: Buy Zones and Buyer Presence
🌍 ICPUSDT.P: Massive Upside Potential | Check the Trade Update For Seeing Results
🟠 IDEXUSDT: Spot Buy Area | %26 Profit if You Trade with MSB
📌 USUALUSDT: Buyers Are Active + %70 Profit in Total
🌟 FORTHUSDT: Sniper Entry +%26 Reaction
🐳 QKCUSDT: Sniper Entry +%57 Reaction
📊 BTC.D: Retest of Key Area Highly Likely
📊 XNOUSDT %80 Reaction with a Simple Blue Box!
📊 BELUSDT Amazing %120 Reaction!
I stopped adding to the list because it's kinda tiring to add 5-10 charts in every move but you can check my profile and see that it goes on..

INJUSDT 1D#INJ is moving inside a falling wedge pattern on the daily chart. In case of a breakout, the targets are:
🎯 $10.68
🎯 $13.17
🎯 $17.39
🎯 $20.80
Use a tight stop-loss.

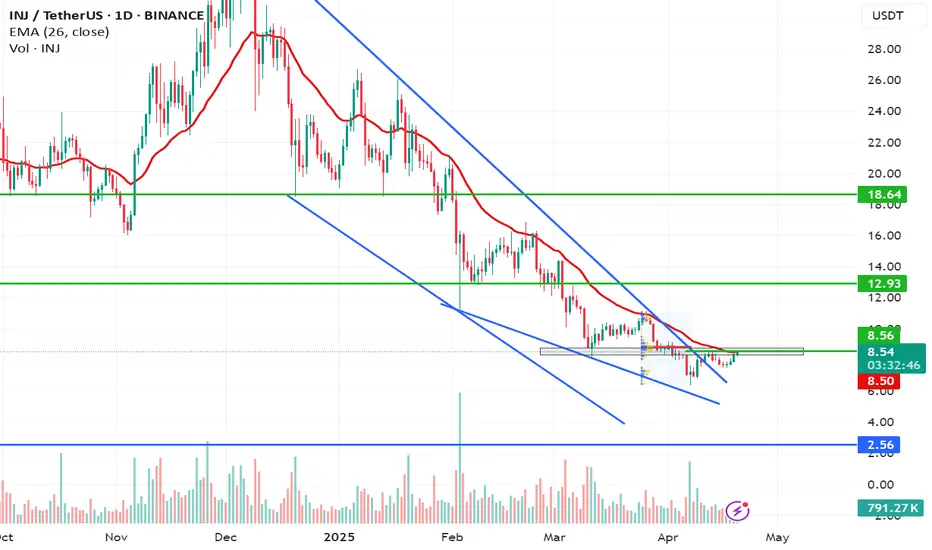
INJ at Key Support – Will History Repeat?INJ/USDT Weekly Chart Analysis
INJ is currently trading at a crucial technical level, touching the strong rising support line of a long-term ascending channel. Historically, this trendline has acted as a reliable base for strong upward reversals.
The Stochastic RSI is also deeply oversold, similar to the levels seen during previous bottoms in early 2022 and early 2023 — both of which led to significant rallies.
If the support holds, INJ could be poised for another upward move toward the key resistance line of the channel.
However, a breakdown below this support would invalidate the structure and could lead to further downside.

TradeCityPro | INJ: Key Triggers Amid Downtrend and Volume Shift👋 Welcome to TradeCity Pro!
In this analysis, I want to review the INJ coin for you—one of the attractive crypto networks, which with a market cap of $783 million, is ranked 73rd on CoinMarketCap.
📅 Daily Time Frame
In the daily time frame, as you can see, we have a downtrend that started after the price was rejected from the 25.43 top, and after breaking 16.04, the main bearish leg of the price began and dropped down to the 6.94 zone.
🔽 This bearish move has followed a trendline that we can also observe in most altcoins. Currently, market volume is decreasing, and it can be said that the price is diverging from the volume—and if this divergence is activated, the price will reverse trend.
✔️ The first trigger for a trend reversal is the break of the trendline. Given the volume divergence, if this happens and the trendline breaks, we can consider the break of the 8.96 trigger as the main reversal confirmation.
📈 If the price stabilizes above the 8.96 zone, it can move upward and start an uptrend. The next resistance for the price would be 16.04. However, for a spot buy, the 25.43 trigger is the most important one, which the price is still far from.
💥 On the other hand, if the 6.94 zone is broken, the price will move downward and may start another bearish leg. But an important point is that there’s a very strong support at the 5.65 zone, and if the price moves downward, it may be supported by this area—so it's better to confirm the next bearish leg with a break of 5.65.
⏳ 4-Hour Time Frame
Let’s move on to the 4-hour time frame to examine suitable triggers for futures positions.
🧩 As you can see in the 4-hour time frame, there’s a descending channel in which the price is moving, and it is currently near the top of the channel.
🔼 For a long position, if the channel top is broken, we can enter a position with the activation of the 8.51 trigger. If the price tests this zone multiple times, the position can become much more reliable, and the possibility of a sharp bullish move increases.
📊 The important point is that buying volume should increase as the price moves toward 8.51, because for a trend reversal, volume must converge with price.
📉 For a short position, the first trigger is the break of the 7.61 zone, which is a good trigger because the price is being rejected from the channel top, and there is a possibility that the price moves toward the midline or bottom of the channel.
🎲 The main trigger for the short position is the break of 6.94, which is a very important low, and breaking this zone can lead to a sharp move down to the 5.65 zone.
📝 Final Thoughts
This analysis reflects our opinions and is not financial advice.
Share your thoughts in the comments, and don’t forget to share this analysis with your friends! ❤️

INJ Analysis: 300% Profit Potential (1W)AI Sector Symbol Analysis: 300% Potential
The AI sector symbol is currently undergoing a significant correction, and it seems to be forming a diametric pattern, with the price now in Wave D. This wave could potentially end within the green buy zone, after which we expect the price to transition into Wave E.
It's important to note that this analysis is based on a weekly timeframe, meaning it will take time to unfold. Additionally, the entry zone is quite large, so a gradual REBUY strategy is recommended to manage risk effectively.
Target Levels are clearly marked on the chart, offering clear points of interest for traders.
However, be cautious: A weekly candle close below the invalidation level will invalidate this setup, so always monitor closely.
For risk management, please don't forget stop loss and capital management
When we reach the first target, save some profit and then change the stop to entry
Comment if you have any questions
Thank You
