$INJ – Extremely Oversold at Key Support | Long Setup PotentialInjective CRYPTOCAP:INJ is trading at an extremely oversold level, sitting directly on major horizontal support that has historically triggered strong bullish reversals. The current zone could offer a high-risk, high-reward opportunity for a long spot position.
🟢 Trade Setup
Entry Zone: $5.50 – $6.00
Targets (TP):
• TP1: $7.00 – $8.00
• TP2: $10.25 – $12.00
• TP3: $14.00 – $16.00
Stop Loss: $5.00
Trade ideas

$INJ 1H CHART UPDATE 📌 CRYPTOCAP:INJ is currently showing a price decline ✅
📌 CRYPTOCAP:INJ could be in a bullish reversal again from the green SUPPORT ZONE below 💹
📌Be careful of that Range ! If that happens, CRYPTOCAP:INJ will reach $6+ again 🔥💸

#INJ/USDT spot plan#INJ
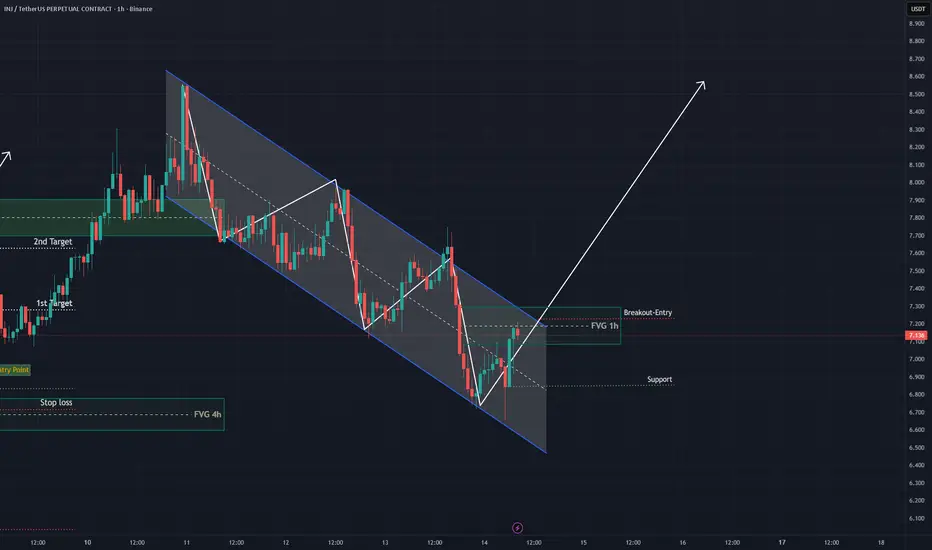
The price is moving in a descending channel on the 1-hour timeframe. It has reached the lower boundary and is heading towards breaking above it, with a retest of the upper boundary expected.
We have a downtrend on the RSI indicator, which has reached near the lower boundary, and an upward rebound is expected.
There is a key support zone in green at 5.46. The price has bounced from this zone multiple times and is expected to bounce again.
We have a trend towards consolidation above the 100-period moving average, as we are moving close to it, which supports the upward movement.
Entry price: 5.60
First target: 5.66
Second target: 5.76
Third target: 5.88
Don't forget a simple principle: money management.
Place your stop-loss below the green support zone.
For any questions, please leave a comment.
Thank you.

INJ USDT LONG SIGNAL---
📢 Official Trade Signal – INJ/USDT
📈 Position Type: LONG
💰 Entry Price: 5.430
---
🎯 Take-Profit Targets (Partial Exits):
TP1 = 5.575
TP2 = 5.711
TP3 = 5.936
TP4 = 6.113
TP5 = —
---
🛑 Stop-Loss: 5.125
📊 Timeframe: 15m
⚖️ Risk/Reward Ratio: 2.28
💥 Suggested Leverage: 5× – 10×
---
🧠 Technical Analysis Summary
INJ is showing bullish structure development after reclaiming the 5.40 zone.
Price is forming higher lows and pushing into early reversal momentum on the 15m chart.
Liquidity targets align with resistance clusters at 5.57, 5.71, and 5.93.
A breakout from the recent consolidation zone could trigger continuation toward 6.11.
---
⚙️ Trade Management Rules
✔️ Take partial profit at TP1
✔️ Move SL to Break-Even immediately after TP1 is hit
✔️ Trail SL as price progresses toward upper targets
✔️ Avoid re-entry if SL at 5.125 gets hit
✔️ Confirm structure before entering
---
⚠️ Risk-Management Note
After TP1 is hit, SL must be moved to the Entry Price — this is standard professional risk management.
If price reaches TP1 then reverses and hits break-even, it is not a loss.
The trade simply closed with zero risk while protecting capital.
---
📌 TradingView Hashtags
#INJUSDT #INJ #CryptoSignal #LongSetup #TradingView
#TechnicalAnalysis #FuturesTrading #Altcoins
---

inj spot plan“INJ macro view: Final corrective leg nearing completion. If we tap the green box, next macro leg targets $60+. 30x potential from the lows. Don’t hate me for this… it is what it is 🚀📈”

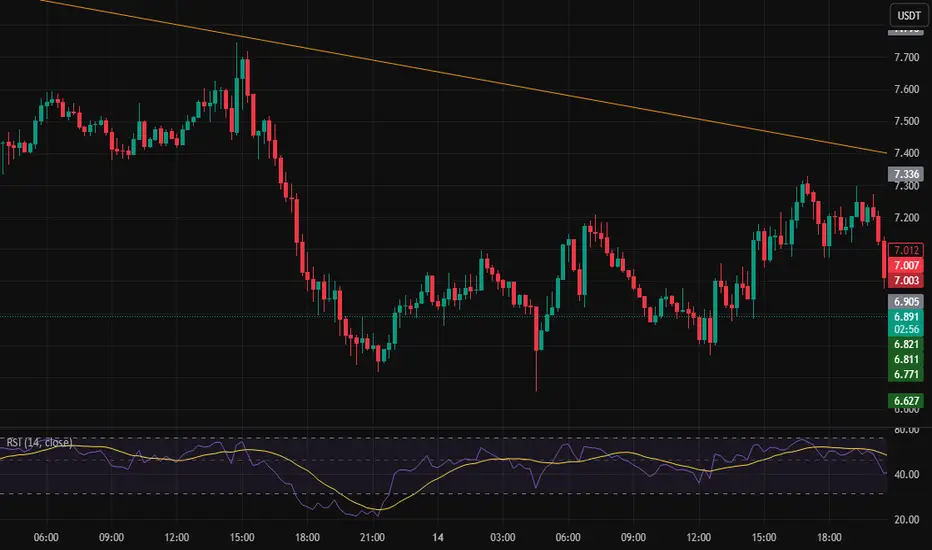
INJ USDT SHORT SIGNAL📢 Trade Signal – INJ/USDT
📉 Position Type: Short
💰 Entry Price: 6.890
---
🎯 Take-Profit Targets (Partial Exits)
TP1 = 6.8210
TP2 = 6.627
TP3 = 6.326
TP4 = —
TP5 = —
TP6 = —
---
🛑 Stop-Loss: 7.000
📊 Timeframe: —
⚖️ Risk/Reward Ratio: 5.9
💥 Suggested Leverage: 5× – 10×
---
🧠 Technical Analysis Summary
INJ is showing weakness after tapping the 6.95–7.00 supply zone.
Price has formed a bearish structure with lower highs and is now breaking below local liquidity.
A clean breakdown under 6.82 (TP1) will confirm continuation toward 6.62 and 6.32, where major liquidity pools sit.
Momentum indicators (RSI & volume) show increasing bearish pressure.
---
⚙️ Trade Management
Take partial profit at TP1
Move SL to Break Even after TP1 hits
Trail SL if price continues toward TP2–TP3
Avoid re-entry if price closes above 7.00
---
⚠️ Disclaimer
This signal is for educational purposes only. Always manage risk properly.
---
📌 Hashtags for TradingView
#INJ #INJUSDT #CryptoSignal #ShortTrade #TradingView #TechnicalAnalysis #FuturesTrading #Altcoins
---
INJ USDT LONG SIGNAL---
📢 Trade Idea: INJ/USDT
Type: Long
Entry Zone: 6.489 – 6.667
---
🎯 Take-Profit Targets (Partial Exits):
• TP1 = 6.850
• TP2 = 7.090
• TP3 = 7.324
• TP4 = 7.600
• TP5 = 7.860
• TP6 = 8.185
---
🛑 Stop-Loss: 6.234
⏱ Timeframe: 15m
⚖️ R/R Ratio: 3.56
💥 Suggested Leverage: 5x – 10x
---
🧠 Technical Analysis Summary:
INJ is trading inside a bullish accumulation zone between 6.48 – 6.66, showing strong support and repeated higher lows.
A breakout above 6.85 will likely trigger bullish continuation toward 7.09 → 7.32 → 7.60.
Momentum indicators (RSI & MACD) show early bullish reversal signals.
Price is reclaiming EMA20 and EMA50 on lower timeframes, supporting a long setup.
---
⚙️ Trade Management Tips:
• Take partial profit at TP1 and move SL to entry.
• Use a trailing stop from TP2 onward.
• Avoid re-entry if price closes below 6.23.
---
⚠️ Disclaimer:
This is educational analysis, not financial advice.
Always manage risk and use proper position sizing.
---
📌 TradingView Hashtags:
#INJUSDT #Injective #CryptoSignal #TradingViewIdeas
#TechnicalAnalysis #FuturesTrading #AltcoinSet

NJ/USDT — Major Decision Zone: Massive Reversal or a Breakdown?INJ is currently at a critical moment within its broader market structure. The price has returned to the historical demand zone at 6.1–4.9, an area that previously triggered a large rally. The market’s reaction here will dictate whether INJ is preparing for a major bullish reversal, or entering a continuation of the bearish trend toward lower levels.
The current formation resembles a medium-term Falling Wedge, a pattern typically known for signaling a potential reversal if a breakout occurs. However, selling pressure still dominates, with a persistent sequence of lower highs kept in check by the descending upper trendline.
One of the most interesting elements on this chart is the long wick sweeping below support, indicating liquidity grabbing — many stop losses were triggered before the price was pulled back up. This is often an early sign that the market may be preparing to move in the opposite direction, but only if bullish confirmation follows.
Without a breakout, the structure remains firmly under bearish control.
In short:
➡️ INJ is standing at its biggest decision point for the coming weeks.
---
Bullish Scenario — “High-Potential Reversal from the Golden Zone”
Bullish Triggers
A strong bounce from 6.1–4.9 with a solid 4D bullish candle.
A clear breakout above the wedge’s upper trendline.
Increasing buy volume accompanying the breakout.
Bullish divergence appearing on momentum indicators (RSI/MACD).
Bullish Targets (Tiered & Based on the Chart)
1. 9.3 USDT → first resistance and early bullish validation.
2. 15 USDT → medium-term resistance to test trend strength.
3. 32 USDT → major target if a mid-term uptrend forms.
4. 51.5 USDT → long-term major supply for a super-bullish scenario.
Bullish Narrative
If INJ successfully breaks out of this wedge, the structure will strongly resemble a classic reversal pattern, often marking the beginning of a significant impulsive move.
---
Bearish Scenario — “Support Break Leads to Trend Continuation”
Bearish Triggers
A 4D candle closing below 4.9, breaking the demand zone.
No strong buying reaction on the retest of the broken support.
Increasing sell volume during the breakdown.
Bearish Targets (Tiered)
1. 3.0 USDT → psychological level & previous structural zone.
2. 1.12 USDT → extreme downside target if the long-term structure collapses.
Bearish Narrative
If the 6.1–4.9 zone fails to hold, the bearish momentum that has been building since early 2024 is likely to continue, and the wedge structure turns into a medium-term bearish channel.
---
Pattern Explanation
The chart currently forms a Falling Wedge (traditionally bullish).
But until a breakout occurs, the pattern remains controlled by sellers.
The 6.1–4.9 yellow zone acts as the key demand block — the buyers’ last major line of defense.
The long lower wick indicates a liquidity sweep, often preceding a trend shift.
The descending upper trendline has rejected every attempt at recovery since 2024 — a breakout here is the most crucial signal for a bullish move.
---
#INJ #Injective #INJUSDT #CryptoAnalysis #PriceAction #CryptoChart
#SupportAndResistance #FallingWedge #CryptoBreakout
#AltcoinAnalysis #TechnicalAnalysis #MarketStructure

INJ 1h Counter-Trend Long Setup (Risk Warning)CRYPTOCAP:INJ 1H – No Bullish Breakout Yet
INJ is still trading inside the descending channel, which means a confirmed bullish breakout has NOT happened yet.
Any long entry taken here would be counter-trend, lower probability, and comes with a weaker R:R until price breaks and holds above the channel resistance + key Fib levels.
For a safer bullish setup:
Wait for a clean breakout above the channel
Retest + confirmation
Reclaim of 0.382 / 0.5 Fib
Until then, trend remains bearish, and longs are considered high-risk.
#INJ #YodaXCalls #CryptoAnalysis #RiskManagement #INJUSDT
INJ Bullish Swing Setup: Higher Low Formation at Key SupportInjective (INJ) has made a strong impulsive move up, showing significant bullish strength in recent sessions. Price is now pulling back and appears to be forming a higher low, a classic swing continuation pattern in trending markets. This correction offers a potential long opportunity for traders anticipating the next leg higher.
📍 Entry Zone: $6.50 – $7.00
🎯 Take Profits:
• TP1: $8.25 – $9.00
• TP2: $10.20 – $12.00
• TP3: $14.00 – $16.00
🛡️ Stop Loss: Just below $6.40
INJ - INJECTIVE 3 Hours Chart Opinions?🧠 Keep it on watch. Momentum shifting.
⚠️ Disclosures :
This analysis is for informational purposes only and is not financial advice. It does not constitute a recommendation to buy, sell, or trade any securities, cryptocurrencies, or stocks. Trading involves significant risk, and you should consult with a qualified financial advisor before making any investment decisions. Past performance is not indicative of future results.

INJ USDT SHORT SIGNAL---
📢 Signal Alert
🔹 Pair: INJ / USDT
📉 Trade Type: Short
💰 Entry Zone: 8.014 – 7.88
🎯 Take-Profit Targets (Partial Management):
▫️ TP1 = 7.493
▫️ TP2 = 7.184
▫️ TP3 = 6.834
🛑 Stop-Loss: 8.225
📊 Timeframe: 1H
⚖️ Risk/Reward Ratio: 2.22
📌 Suggested Leverage: 5x – 10x
⚠️ Capital management is mandatory.
💬 Please review the chart before entering the trade.
---
🧠 Technical Analysis Summary:
Injective (INJ) shows bearish momentum after rejection from the 8.20–8.25 resistance zone.
The market structure is shifting to lower highs, confirming short-term weakness.
Price is trading below EMA20 and EMA50, indicating potential continuation to lower support levels around 7.18 – 6.83.
RSI remains under 50, supporting bearish continuation.
---
⚙️ Trade Management Tip:
Once TP1 is hit, move SL to Entry for a risk-free setup.
Trail the stop as the price approaches TP2–TP3 for maximum profit protection.
---
⚠️ Disclaimer:
This analysis is for educational purposes only and not financial advice.
Always DYOR (Do Your Own Research) and apply proper risk management before trading.
---

INJ USDT LONG SIGNALOf course. Here is the complete INJ/USDT trading signal in English, formatted for clarity and ready for use on platforms like TradingView.
---
📊 INJ/USDT Trading Signal
Trade Structure:
· Pair: INJ/USDT
· Direction: LONG
· Timeframe: 15-min (M15)
· Risk/Reward: 3.35
---
🎯 Key Levels
Parameter Value
Entry Zone 7.135 - 7.347
Target 1 (TP1) 7.542
Target 2 (TP2) 7.784
Target 3 (TP3) 8.064
Target 4 (TP4) 8.450
Stop Loss (SL) 7.000
---
📈 Technical Analysis & Chart Logic
Price Action & Structure:
· Price is testing a key support zone and showing potential for a reversal.
· The formation of a Higher Low on the 15-minute chart suggests a potential shift in short-term momentum.
· A break above the dynamic resistance (e.g., EMA 20) could confirm the bullish impulse.
Indicator Confluences:
· RSI: Is hovering around the 40-50 level, indicating the potential for an upward move if it breaks above 50.
· MACD: The histogram is showing a reduction in bearish momentum, hinting at a possible bullish crossover.
· Volume: An increase in buying volume around the support zone would validate the strength of the bounce.
Key Chart Levels:
· Major Resistance: 7.550 - 7.600
· Major Support: 7.100 - 7.000
---
⚙️ Trade Execution Plan
Entry Conditions:
1. Price must reach and react bullishly within the Entry Zone (7.135 - 7.347).
2. Look for a bullish confirmation candle (e.g., Bullish Engulfing, Hammer).
3. Wait for RSI to cross above the 50 level for additional confirmation.
Position Management:
· Take 25% profit at TP1 and move your Stop Loss to Breakeven.
· Trail your stop loss for the remaining position as price progresses towards TP2 and TP3.
· Close the final 25% of the position at TP4.
---
⚠️ Invalidation Criteria
· A decisive 15-minute candle close below the 7.000 Stop Loss level.
· The formation of a new Lower Low on a higher timeframe.
· A strong break and close below the 6.900 support level.
---
🔍 Pro-Trader Notes
· Maximum Risk: Do not risk more than 2% of your total capital on this trade.
· Leverage: The suggested leverage is 5x to 10x. Use cautiously.
· Patience: It is often safer to wait for a successful retest of the entry zone after an initial bounce.
---
Disclaimer: This signal is for educational purposes only and does not constitute financial advice. Trade at your own risk.

INJUSDT Forming Falling WedgeINJUSDT is forming a clear falling wedge pattern, a classic bullish reversal signal that often indicates an upcoming breakout in crypto trading pairs like this one. The price has been consolidating within a narrowing range after recent dips to the multi-year support zone around $6-$7, suggesting that selling pressure is weakening while buyers are beginning to regain control near key levels like $7.5-$9. With good volume confirming accumulation at these lower levels amid rising network transactions and developer activity, the setup hints at a potential bullish breakout soon, especially as Injective's DeFi innovations and cross-chain interoperability draw fresh momentum. The projected move could lead to an impressive gain of 90% to 100%+ once the price breaks above the wedge resistance, targeting zones up to $15-$16 and beyond in this altcoin price action.
This falling wedge pattern is typically seen at the end of downtrends or corrective phases, and it represents a potential shift in market sentiment from bearish to bullish for INJUSDT. Traders closely watching this crypto pair are noting the strengthening momentum as it nears a breakout zone around $9-$10, with technical indicators like RSI showing oversold bounces and fib retracement levels holding firm on the 4H and daily charts. The good trading volume adds confidence to this pattern, showing that market participants are positioning early in anticipation of a reversal, particularly with recent bounces from ascending supports and over 1.5 billion transactions signaling ecosystem growth.
Investors’ growing interest in INJUSDT reflects rising confidence in the project’s long-term fundamentals, including its layer-one blockchain for DeFi, prediction markets, and staking rewards, alongside current technical strength in this falling wedge setup. As of November 2025, trading activity spikes and institutional attention underscore real demand, making this a high-conviction opportunity for those hunting bullish reversal patterns in altcoins. If the breakout confirms with sustained volume, this could mark the start of a fresh bullish leg, with projections eyeing $14-$15 for substantial medium-term gains as buying momentum accelerates in the broader crypto recovery.
✅ Show your support by hitting the like button and ✅ Leaving a comment below! (What is You opinion about this Coin) Your feedback and engagement keep me inspired to share more insightful market analysis with you!

INJ USDT LONG SIGNAL---
📢 Signal Alert
🔹 Pair: INJ / USDT
📈 Trade Type: Long
💰 Entry Zone: 7.691 – 7.900
🎯 Take-Profit Targets:
TP1 = 8.467
TP2 = 8.829
TP3 = 9.320
TP4 = 9.940
🛑 Stop-Loss: 7.530
📊 Timeframe: 1H
⚖️ Risk/Reward Ratio: 4.11
📌 Suggested Leverage: 3x – 5x
⚠️ Capital management is mandatory.
Please review the chart carefully before entering the trade.
---
🧠 Technical Analysis Summary:
INJ is forming a bullish reversal pattern near the 7.65–7.70 demand zone, supported by increasing volume and a breakout from descending resistance.
Momentum indicators confirm a potential trend reversal to the upside.
🔸 Key Observations:
RSI is recovering from the oversold area toward 50+, signaling growing buyer pressure.
Price action shows a higher low structure, indicating trend shift.
EMA20 crossing above EMA50 on lower timeframes strengthens the bullish outlook.
TP1 is set near short-term resistance; higher targets align with Fibonacci extensions and previous swing highs.
---
⚙️ Trade Management Tip:
Once TP1 is reached, move Stop-Loss to Entry and secure partial profit.
Let remaining positions run toward TP4 for extended gains.
---
⚠️ Disclaimer:
This content is for educational purposes only and does not constitute financial advice.
Always Do Your Own Research (DYOR) and use proper risk management.
---

INJUSDTIt seems that we will not see altseason at least this year.
In best case +100%-150% for alts
and 4k for ETH (this summer)
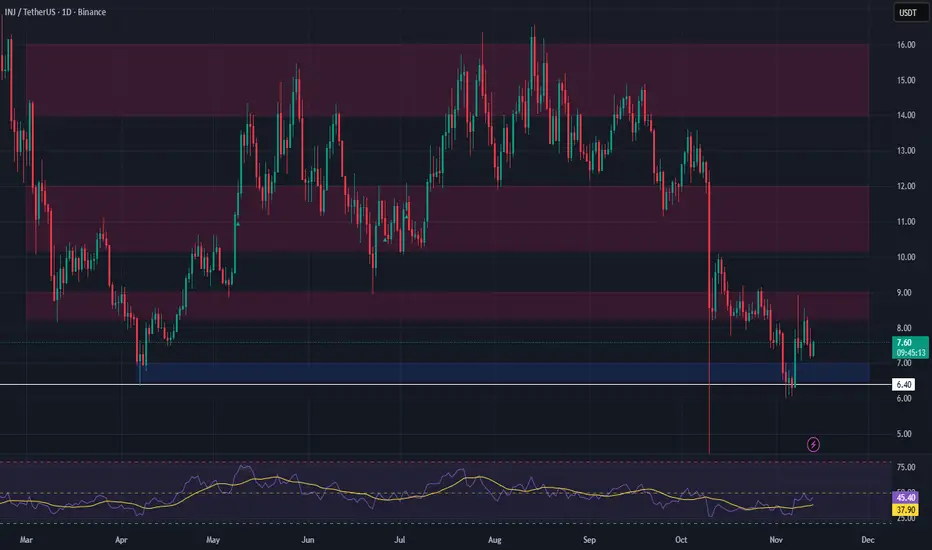
INJthe chart shows that INJ after a strong rally in 2023, reached a peak around 52USDT, followed by a prolonged period of decline. Currently the price is araund 7,6 USDTmeaning it has rezreated ny mor then 85% from its peak - confirming a long-term bearish trend(downtrend)

INJUSDT 2D#INJ is currently trading within a descending channel on the 2-day timeframe. It’s positioned near the midline of the channel and the support zone, where a potential bounce is expected. If that happens, the short-term targets are:
🎯 $8.66
🎯 $10.10
In case of a breakout above the channel resistance, the potential upside targets are:
🎯 $11.98
🎯 $13.50
🎯 $15.01
🎯 $17.17
🎯 $19.92
⚠️ Always remember to use a tight stop-loss and maintain proper risk management.

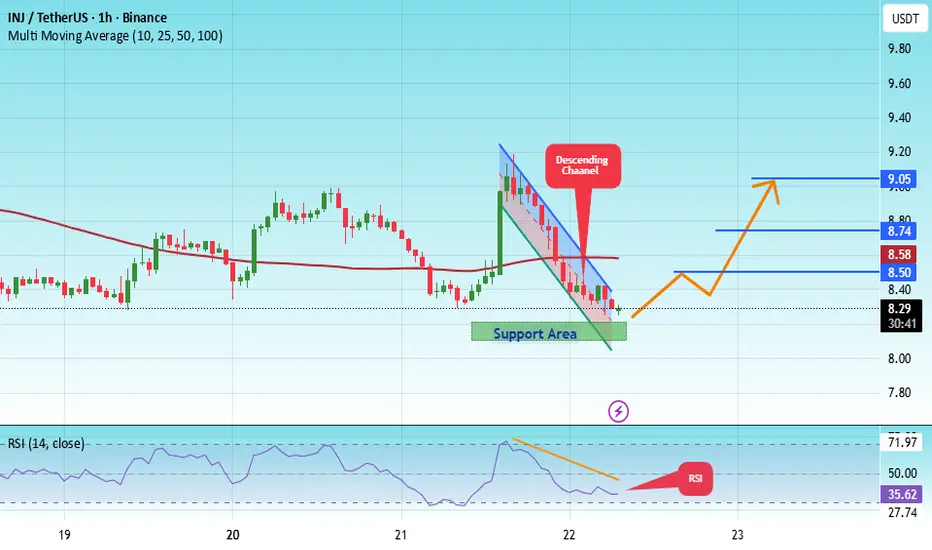
#INJ/USDT : Looking For Break of Structure | Bullish#INJ
The price is moving within a descending channel on the 1-hour frame, adhering well to it, and is heading for a strong breakout and retest.
We have a bearish trend on the RSI indicator that is about to be broken and retested, which supports the upward breakout.
There is a major support area in green at 8.15, representing a strong support point.
We are heading for consolidation above the 100 Moving Average.
Entry price: 8.30
First target: 8.50
Second target: 8.74
Third target: 9.05
Don't forget a simple matter: capital management.
When you reach the first target, save some money and then change your stop-loss order to an entry order.
For inquiries, please leave a comment.
Thank you.
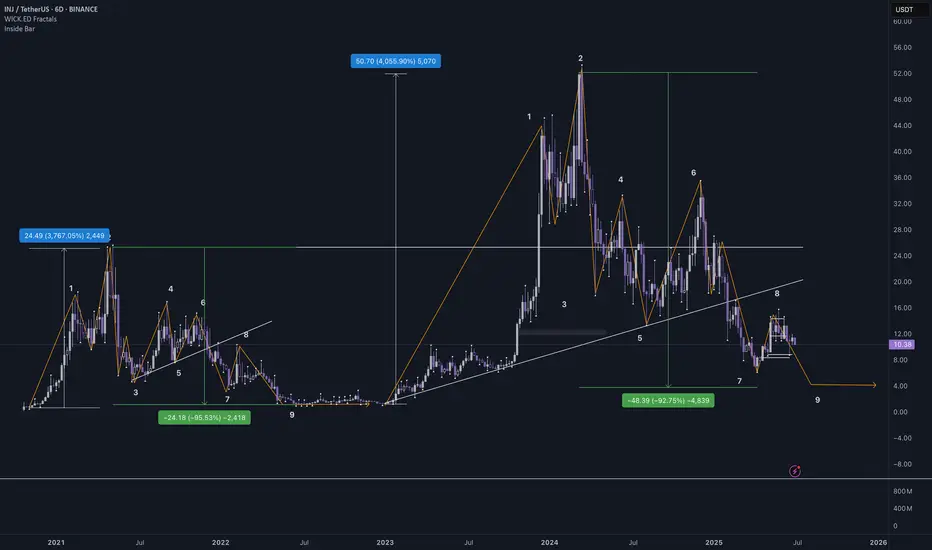
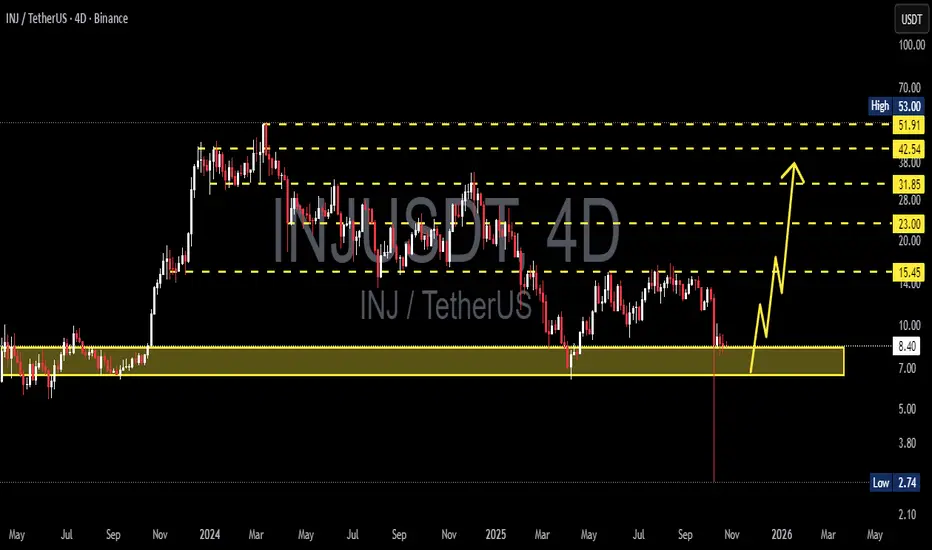
INJ/USDT — The Make-or-Break Zone: Will Injective Defend?INJ is standing at its most crucial turning point since 2023, once again testing the legendary support zone between $6.5–$8.3 — the same area that previously sparked one of its most explosive rallies all the way up to $53.
This yellow block on the chart isn’t just an ordinary support; it represents the last stronghold of the bulls — the place where the market once flipped from distribution to euphoria. Now, that fortress is being tested again under relentless bearish pressure since mid-2024.
---
📉 Technical Structure:
Primary Trend: Still in a medium-term downtrend (series of lower highs and lower lows).
Key Support Zone (Demand Area): $6.5 – $8.3
Major Resistances: $15.45 → $23.00 → $31.85 → $42.54 → $51.91
Historical Low: $2.74
A long downside wick observed earlier signals extreme liquidity events — likely the result of large-scale stop-hunting or a capitulation flush. Yet, the quick candle recovery indicates that buyers are still defending below this area.
---
📈 Bullish Scenario:
If price manages to hold above the yellow zone and prints a bullish engulfing candle on the 4D timeframe with rising volume, a strong rebound could emerge.
The first upside target would be $15.45, and if momentum builds alongside a forming higher-low structure, the market could extend toward the $23.00–$31.85 range to confirm a medium-term trend reversal.
A clean breakout and close above $23.00 would confirm a major trend reversal, potentially reopening the path to retest the higher supply zones between $42–$51.
---
📉 Bearish Scenario:
However, if INJ fails to hold above $6.5 and confirms a 4D candle close below the yellow support zone, the market could enter another distribution phase.
Downside targets would then be $3.80, followed by the historical low at $2.74, which may act as the final liquidity magnet.
A confirmed breakdown below this support would reinforce seller dominance and likely extend the ongoing downtrend into deeper price territory.
---
📊 Summary:
The yellow zone on this chart is INJ’s “make-or-break” fortress.
If it holds, the market could witness the beginning of a new accumulation phase before a potential breakout. But if this wall collapses, the chart could rewrite its story toward deeper single-digit levels.
Either way, this zone represents the highest confluence of risk and opportunity — the decisive battleground that will shape INJ’s next major trend.
---
🧭 Trading Notes:
Conservative traders: Wait for a confirmed 4D close above the yellow zone before entering long positions.
Aggressive traders: Consider scaling into positions within the zone with a stop loss below $6.5.
Short-sellers: Watch for rejections around $15.45 — a failed breakout there could offer swing short opportunities back toward the $8 region.
Risk management remains key — never let emotion override structure.
---
#INJ #Injective #INJUSDT #CryptoAnalysis #TechnicalAnalysis #PriceAction #SupportZone #SwingTrade #CryptoMarket #MarketStructure #TrendAnalysis #BullishVsBearish
INJUSDT LONG1. Vector 1, 1.1, 1.2 travelling to vector 2 is showing buyers strength
2. Vector 2 is the level where sellers is sitting and push the price down
and breaks at minor structure (1.1-S) and continues to go dow and break the major low 1.
and create lower low which vector 3.
3. Vector 3 - Big candle bullish bar/Fractal Bar is also our lower low
travelling to vector 4 creating HH and HL (3.1 & 3.2 minor structure)
4. 3.2 minor breaks at 2.6 solid minor structure and vector 4
test the level of 3.2 solid minor structure and it create fractal bar.
My interpretation at the price action, this is the time where buyers are back
showing that they have momentum to bring the price going up.
I enter the market exactly at the fractal bar and hide my stop loss
at 3.2 solid minor structure and place my take profit at vector 2 inward frequency line.

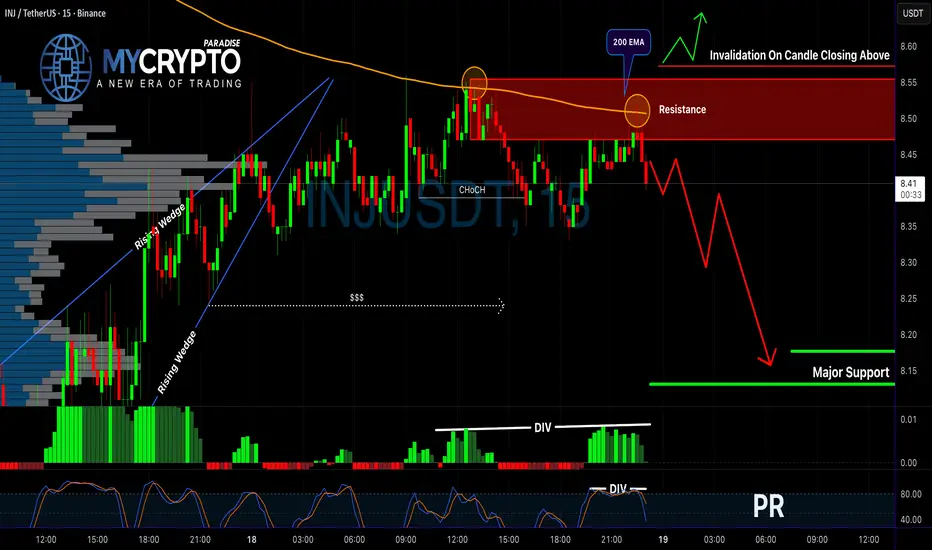
INJUSDT Just Flashed a Bearish Reversal SignalYello, Paradisers! Did you catch how INJUSDT reacted at the resistance zone? If not, you might be looking at the early signs of a deeper drop. Here's what you need to know before it's too late.
💎INJUSDT is currently flashing a clear bearish outlook as price reacts strongly from a major resistance zone. This area is further reinforced by the 200 EMA, adding technical confluence to the rejection. Most importantly, we've now seen a bearish CHoCH (Change of Character), which often marks a momentum shift from bullish to bearish. On top of that, both MACD and Stochastic RSI are showing bearish divergence—this alignment of multiple indicators significantly increases the probability of downside continuation.
💎Aggressive traders may look to enter short positions directly from current levels, aiming to capitalize on early momentum. However, for more conservative and risk-aware traders, a safer approach would be to wait for a minor pullback into the resistance area, followed by confirmation from bearish candlestick formations. This method not only improves the risk-to-reward ratio but also increases the overall probability of success by waiting for clearer market signals.
💎That said, we always account for invalidation. If the price manages to break and close decisively above the resistance zone, it would invalidate the current bearish structure. In such a scenario, standing aside and waiting for a new price structure to form would be the smarter move, rather than trying to force a trade against the new trend.
💎This is where patience and discipline truly set you apart from the herd. If you want to be consistently profitable, you must learn to wait for the highest probability opportunities—just like we do. Avoid rushing, and don’t let emotions lead your decisions.
🎖Strive for consistency, not quick profits. Treat the market as a professional business—not a gamble. That’s the only way to build long-term success in crypto. Be a PRO.
MyCryptoParadise
iFeel the success🌴
INJ/USDT – Breakout in Progress, Targets in Sight
Date: July 28, 2025
INJ/USDT is displaying a strong bullish structure after breaking through a major resistance zone, supported by increasing volume and positive momentum. The market appears to be entering a new expansion phase.
🔍 Technical Overview:
Current Price: $15.95
EMA Overview:
4EMA: $14.71
50EMA: $12.25
100EMA: $11.94
200EMA: $12.69
Price is currently above all major EMAs, confirming strong bullish momentum and trend alignment.
📊 Structure & Price Action:
Price successfully broke out of the $14.35–15.02 resistance zone, which previously acted as a rejection area.
A clear bullish continuation pattern can be seen, with rising trendlines and higher lows.
Price retested the breakout area and is now pushing higher – confirming demand at higher levels.
📉 Key Support Zones:
$15.02 (recent breakout level, now flipped to support)
$14.35
$12.92 (former consolidation resistance)
📈 Key Resistance & Target Zones:
$18.40: First significant upside target based on the measured move
$25–26 area: Major long-term resistance, highlighted as a high confluence target zone
📊 Indicators:
RSI: 68.57 – Bullish momentum, nearing overbought levels. Could lead to short-term consolidation or pullback, but the trend remains intact.
Volume: Gradually increasing volume with the breakout – a healthy sign of accumulation and breakout confirmation.
🎯 Bullish Outlook:
Trend: Strong uptrend with clean breakout structure
Short-term target: $18.40
Mid/Long-term target: $25–26
Dips toward $15.00–$14.30 may be attractive for bulls looking for continuation entries
📉 Invalidation:
A breakdown below $14.35 with high volume could suggest a failed breakout and bring price back toward the $12.90 zone
A move below the trendline would signal weakness, but until then, bulls remain in control
Good Trading!!
