Injective - Bullish This idea focuses on how volatility expansion behaves around major structural levels on INJ using the three day and weekly charts.
The first key reference point is the 2023 bottom on the left side of the chart. Price produced a cluster of exhaustion style candles, volume spiked, and volatility was
Key stats
Trading activity
Transactions 304
BuysSells
140164
Volume 17.19 KUSD
Buys volumeSells volume
9.59 K7.6 K
Traders 107
BuyersSellers
3968
About INJWBNB_1BDCEB.USD
Related DEX pairs

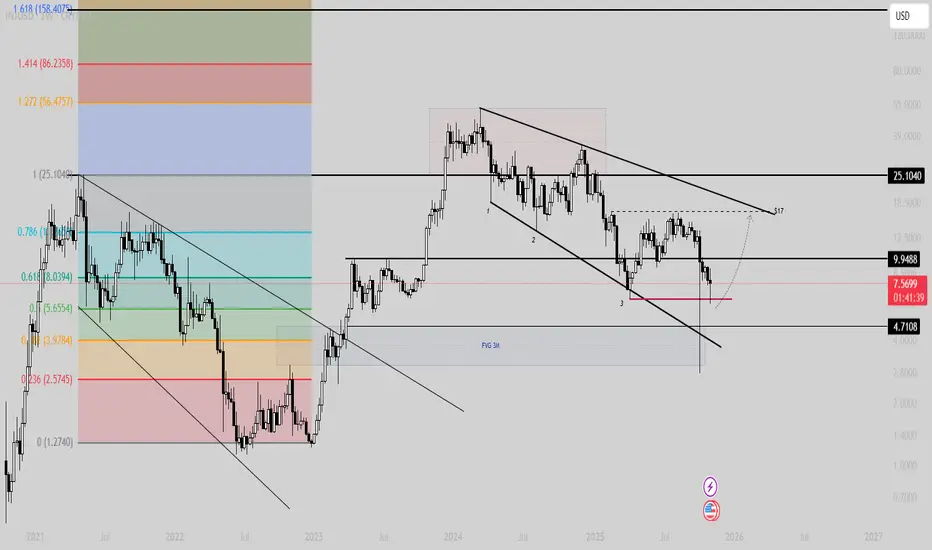
$INJ Risky but possible ScenarioRisky but possible Scenario based on 3-drive
Only if INJ doesn't lose the support
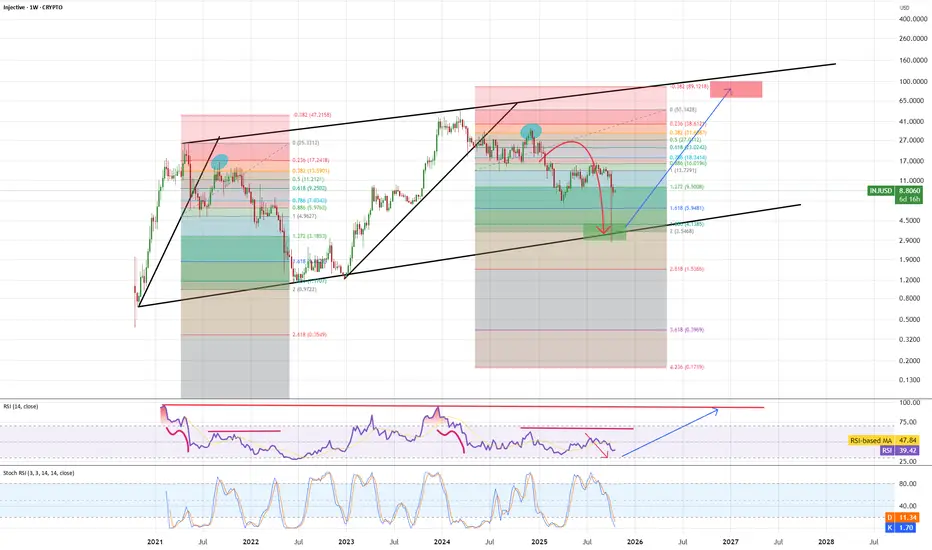
INJECTIVE - INJ - 1D -1W TF STRONG SUPPORT ZONE — HIGHLY UNLIKELY TO DROP BELOW THIS LEVEL
The maximum and minimum key levels are highlighted in purple and blue, respectively.
If the current falling wedge / descending triangle formation plays out, the expected target area is the red zone and due to potential slippage price c

INJ - buy zone reached time for reversalINJ made same correction as in 2022 and dumped to buy zone from where we got strong bounce up. We can pull back toward support line but bottom is in imo and we are ready for new impulse toward new ATH - likely target is arround 80-100$ range where we have diagonal resistance line.
$INJ \ Injective Similar to the previous channel structure, will initiate a potential structural breakout parabolic run toward the upper band of the second descending channel.

INJUSD Rising Wedge going for a new High.Injective (INJUSD) has been trading within a Rising Wedge pattern since the March 02 High. Right now it broke above its 1D MA50 (blue trend-line) again, following a September 01 Higher Low on the pattern's bottom.
This is technically the start of its new Bullish Leg and given the fact that both pre

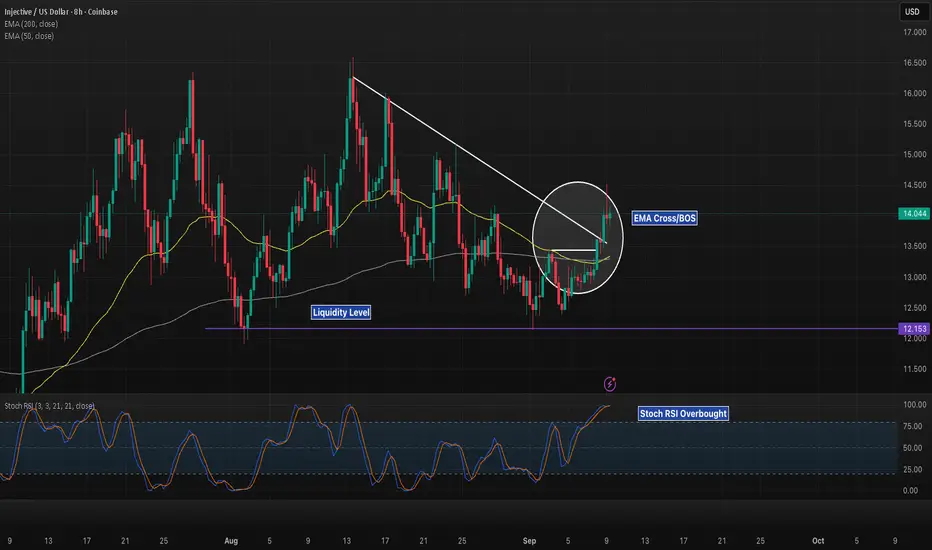
INJ 8H – EMA Cross & Break of Structure ConfirmedInjective has broken its descending trendline while confirming an EMA cross with the 50 EMA now above the 200 EMA. Price is holding above both EMAs ($13.29–13.33), marking a potential trend reversal structure.
Upside potential:
Next resistance zones sit at $15.00–15.50, with further continuation o
INJINJ
Elliott Wave count shows that a five-wave impulse structure (i–v) has been completed to the upside. Wave i and iii developed strongly, with wave iii being the extended leg, and wave v marking the final push higher. After this completion, the market is now likely entering a corrective phase, for

INJUSDT Descending Broadening WedgeINJUSDT is showing signs of a potential bullish breakout after rebounding from the lower boundary of a descending broadening wedge classic reversal pattern.
The price bounced from strong support around the $7.5–$9 zone, which aligns with historical buying interest. After bouncing from this key dema

INJ/USD Bullish Heist: Crack the Vault & Grab the Loot!Ultimate INJ/USD Heist Plan: Snag Profits with the Thief Trading Strategy! 🚀💰
🌍 Greetings, Wealth Raiders! Ciao, Hello, Bonjour, Hola! 🌟
Fellow profit hunters, get ready to crack the INJ/USD "Injective vs U.S Dollar" Forex vault with our slick Thief Trading Strategy! 🤑💸 This plan blends razor-shar

See all ideas
Summarizing what the indicators are suggesting.
Oscillators
Neutral
SellBuy
Strong sellStrong buy
Strong sellSellNeutralBuyStrong buy
Oscillators
Neutral
SellBuy
Strong sellStrong buy
Strong sellSellNeutralBuyStrong buy
Summary
Neutral
SellBuy
Strong sellStrong buy
Strong sellSellNeutralBuyStrong buy
Summary
Neutral
SellBuy
Strong sellStrong buy
Strong sellSellNeutralBuyStrong buy
Summary
Neutral
SellBuy
Strong sellStrong buy
Strong sellSellNeutralBuyStrong buy
Moving Averages
Neutral
SellBuy
Strong sellStrong buy
Strong sellSellNeutralBuyStrong buy
Moving Averages
Neutral
SellBuy
Strong sellStrong buy
Strong sellSellNeutralBuyStrong buy
Curated watchlists where INJWBNB_1BDCEB.USD is featured.

Decentralized Exchange Tokens: Risky business?
22 No. of Symbols

Derivatives Tokens: De-Fi does it again
16 No. of Symbols

Smart contracts: Make the smart decision
36 No. of Symbols
See all sparks