IOTABTC trade ideas


Bullish on IOTA/BTCI am extremely bullish on BINANCE:IOTABTC long term.
One of the Top strongest project out there that has not really had a mini pump, Team is working hard.
Click Like and Follow me
Daily Bullish Signal $IOTA #IOTA #IOTABTC (14 April)RED ARROW indicates the EXPECTED Time and Targets
Level Stoploss point up to maximize profit and reduce risk
I'm working all the time, even in Bearish Market
======================
My path doesn't seem like anyone. I'm like a MONK, always studying to find the direction that prices will follow. I will feel very comfortable if the price goes exactly in the direction I drew. I will always try and practice until PERFECTION is MY OWN

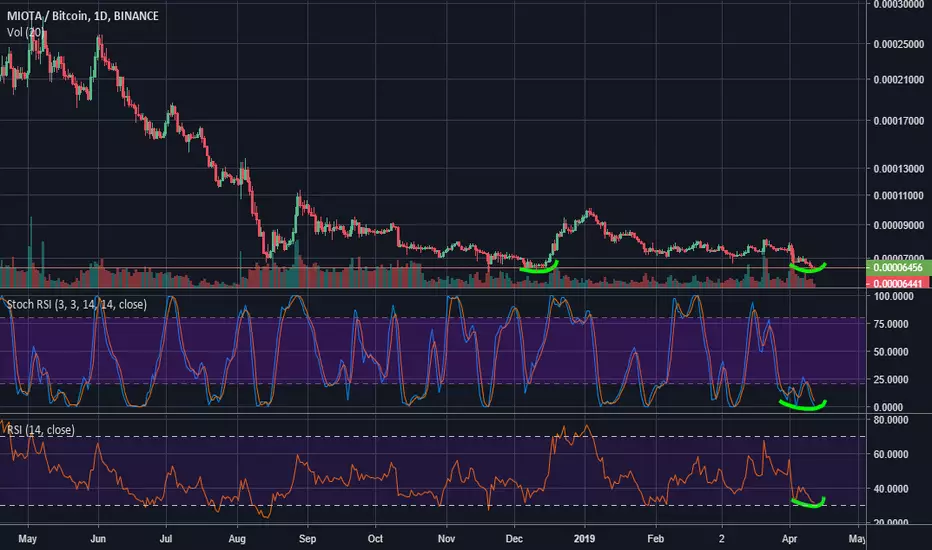
IOTA Ready for (some) LEGS up! [50+%]Hi,
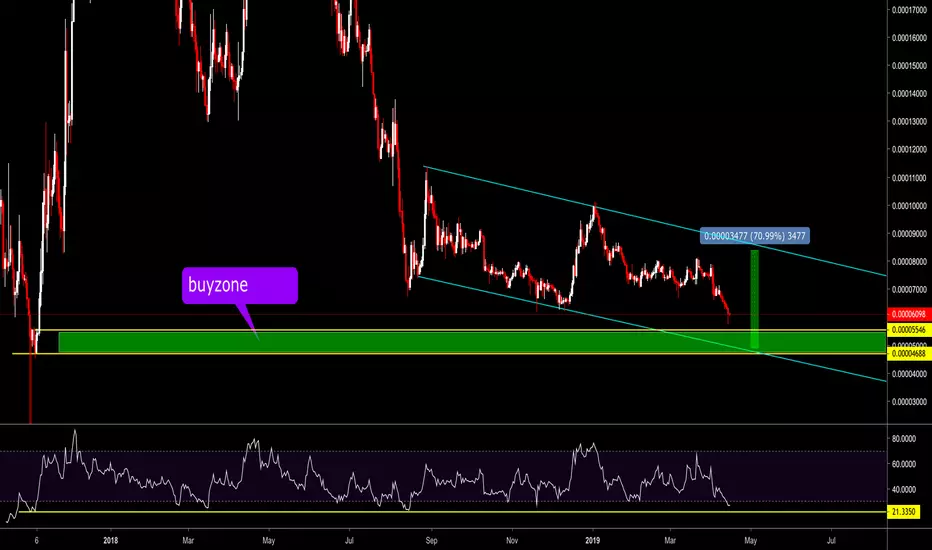
I have a small analyis of MIOTA because it looks like she is hitting my buy box.
Watch this coin! I think there is a possibility of 50% gains!
-RSI and stoch are ready
My entry: 0.00006480
My Stoploss : Underneath the box.
Goodluck!
I will update this post many times till closing.
Please do your own research!


IOTA-BTC Long Trade PlanCommodity : MIOTA
Trade Type : LONG
Trading Against : BITCOIN
Entries : Double-UP Entries throughout the Buy Zone
Profit Taking : 25% at each TP point.
Profit Locking : Move SL to break even once TP1 is hit, to TP1 once TP2 hits, to TP2 once TP3 hits and so on
Duration - 2-4 weeks
Investment in trade : 10% of the total Trading Balance.
Prospective Profit : 12% to 43%
Prospective Loss : 6%
RRR : SL to TP1 is 1.8, SL to TP2 is 3.3 , SL to TP3 is 4.5 and SL to TP4 is 6.4
Buy Zone/TPs/SL price points are marked in the chart as follows
Greens - Profit Targets (TPs)
Blue - Buy Zone (Entries)
Red - Stop Loss (SL)

IOTA Time For A Rebound!If we compare the current IOTA/BTC chart to the Wyckoff accumulation scheme we can see a clear similairity. IOTA has also been one of the first coins to "moon" during the 2017 bull run and is close to its lows right now. To make this idea work we will need to see a higher volume that supports the up move. We first have to break the red resistance line around 7600 levels and after that we have to break a long term downtrend line dating back to late 2017 which is going to act as a huge resistance.
Wyckoff Scheme:
imgur.com

Potential near 30% climb for iota/btcBroadening right angled descending pattern with a potential to break to the upside or downside equally. However, with the appearance of bullish divergence and a bounce off of solid support, we could see an average of 28% climb--the green box.


IOTA INVESTMENT IDEAIOTA BTC INVESTMENT IDEA
LONG AS BELOW :
7200 6850
TARGETS
9000
10000
10800
12900
STOP BELOW 6800 IF DAILY CANDLE CLOSED BELOW IT AND MAKE IT MANUAL TO AVOID STOP LOSS HUNTS

Keep an eye on IOTA Watching IOTA and will buy on retest of support. Looking to capture a 5% move to the upside.


IOTA/BTC - massive pump incomingIOTA/BTC weekly looks set to make a massive pump.
Target: 0.00012800
Blue triangle indicates the current range.
Green box is buy.
Red box is sell.
Blue line indicates major resistance.
Yellow line indicates t/p.
This is a log chart.

40% Profit Potential , 3.5:1 RR Multiple confirmed IHS patterns as well as specific retracement bounces.
Bought - 7520
Target - 10496
Stop Loss - 6664

#IOTA support found after previous breakoutafter breaking out from a descending triangle, #IOTA has found support from its prior resistance
Target 1: 7687
Target 2: 8020

IOT/BTC Long-termAnalysis
-Specified black area is supportive zone
-Price is on bullish long-term trend line
Suggestive Position
- Entry=Trigger(according to trading strategy)
- Stop-loss=0.000057-0.000061
- Take Profit 1 =0.000096-0.00010
- Take Profit 2 =0.00012-0.00013
- Reward/Risk= 2


IOTA: Alternate EW count looking more accurateThis is an alternate count to my previous idea - linked below.
Extted this that because: W3 of 3 started out strong and if my idea was correct, it would have picked up strength. It reversed hard very early after modest gains, and failed to make a HH of W1. Stoch is crossed bearish, RSI turned down, and MACD turned down. I felt best to cut this trade as it appears to be heading down and invalid.
This alternate wave count looks more accurate after this recent price action.
I will look for an entry at the end of B to catch wave C.

IOTA Bullish ideaIota has been consolidating for two months in a sideways range. It recently saw HH for first time in 3 mo! Price just solidly tested new support zone, which had confluence with .618 retracement and .5 extension. believe this is w3 of 3 and will extend to 2.68, which has strong confluence with the recent top. Stoch is turning up, RSI is strong at 60 and turning up, MACD is flat on a dropping histogram. (All on H4)
Please let me know what you think!
Genuinely trying to study and learn Elliott Wave. :)
