IOTABTC trade ideas

IOTA / Bitcoin long setup H4 RR=2.7IOTA / Bitcoin long setup H4 RR=2.7
We have a RSI Divergence showing a weakening bearish trend , price also formed a bullish shark pattern at previous support level ; I am expecting to see a little upward movement . For a buy at actual price 0.000071330 BTC , TP at 0.000075132 BTC and SL at 0.00007 you get a RR ratio of 2.7 .

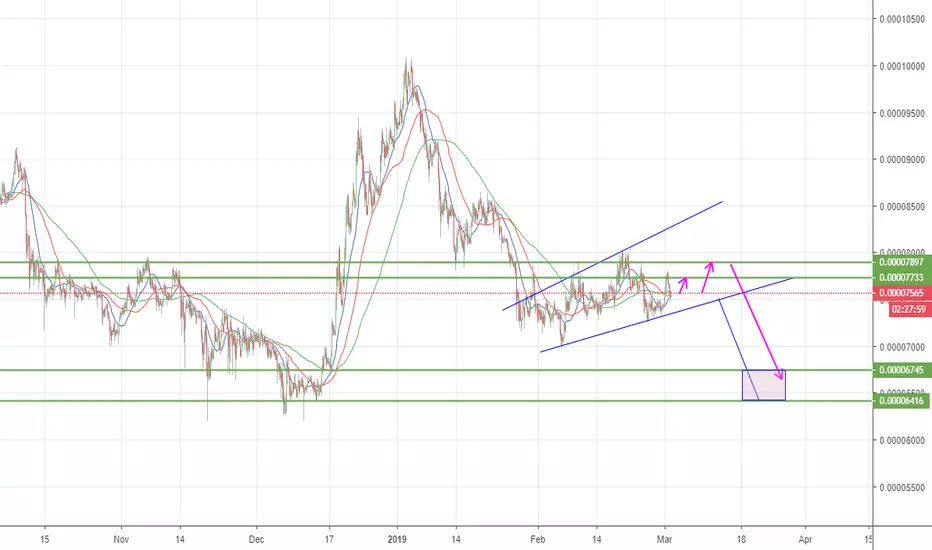
IOTBTC LongLots of rejection on support
pinbar, hammer and inside bar price action
looks like we got a local bottom and will test higher - first tp is at 0,0000934 - sl below local lows at approx. 0,0000687


IOTABTCSee chart. Idea. This is my viewpoint and my opinion. I am not giving advice but only sharing what I see.

IOTA bull line, you look this baby?IOTA can break the resistance line maintained for over a year and make a powerful pump. It reminds me of the old days of bull. Just waiting ;)

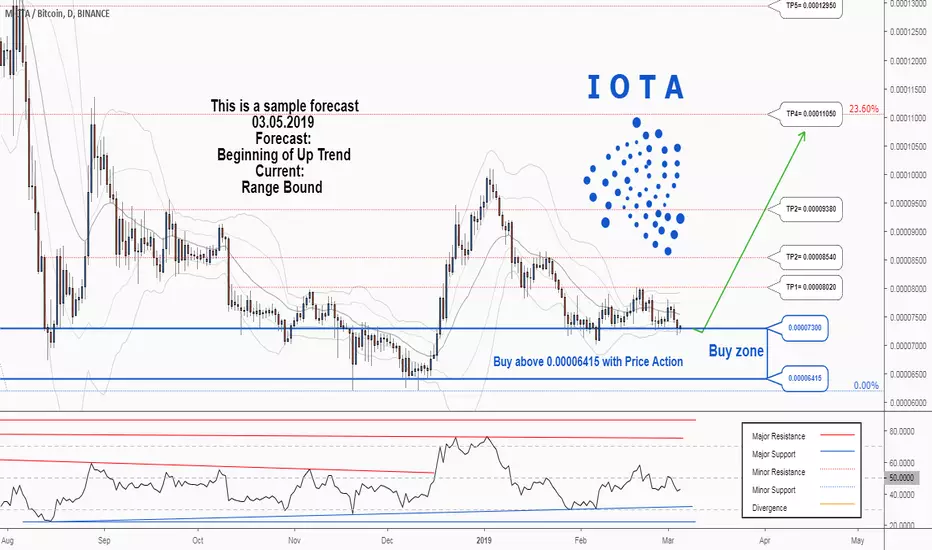
A trading opportunity to buy in IOTABTCTechnical analysis:
. IOTA/BITCOIN is in a range bound and the beginning of uptrend is expected.
. The price is below the 21-Day WEMA which acts as a dynamic resistance.
. The RSI is at 43.
Trading suggestion:
. There is a possibility of temporary retracement to suggested support zone (0.00007300 to 0.00006415). if so, traders can set orders based on Price Action and expect to reach short-term targets.
Beginning of entry zone (0.00007300)
Ending of entry zone (0.00006415)
Entry signal:
Signal to enter the market occurs when the price comes to " Buy zone " then forms one of the reversal patterns, whether " Bullish Engulfing ", " Hammer " or " Valley " in other words,
NO entry signal when the price comes to the zone BUT after any of the reversal patterns is formed in the zone.
To learn more about " Entry signal " and the special version of our " Price Action " strategy FOLLOW our lessons:
Take Profits:
TP1= @ 0.00008020
TP2= @ 0.00008540
TP3= @ 0.00009380
TP4= @ 0.00011050
TP5= @ 0.00012950
TP6= @ 0.00014060
TP7= @ 0.00016480
TP8= @ 0.00018910
TP9= @ 0.00026760
TP10= @ 0.00031200
TP11= Free
IOTAUSD is forming a symmetrical triangle!!!!!!Hi Guys . IOTAUSD is getting ready to break the Descending TRIANGLE . Wait for the breakout and decide the trend . Hope y'll find this useful . G'day Guys

IOTA-BTC Long Trade PlanCommodity : MIOTA
Trade Type : LONG
Trading Against : BITCOIN
Entries : Double-UP Entries throughout the Buy Zone
Profit Taking : 25% at each TP point
Profit Locking : Move SL to break even once TP1 is hit, to TP1 once TP2 hits, to TP2 once TP3 hits and so on
Duration - 1 Week
Investment in trade : 10% of the total Trading Balance.
Prospective Profit : 6% to 28%
Prospective Loss : 8%
RRR : SL to TP1 is 0.79, SL to TP2 is 1.72, SL to TP3 is 2.62 and SL to TP4 is 3.39
Buy Zone/TPs/SL price points are marked in the chart as follows
Greens - Profit Targets (TPs)
Blue - Buy Zone (Entries)
Red - Stop Loss (SL)

IOTA BTC 100% UPSIDE GET READY TO LOAD UP SOONDETAILS - ENTRY AND TARGET - SEE CHART. GOOD LUCK AND LET'S MAKE SOME MONEY! RYDERS.

Daily Bullish Signal $IOTA #IOTA (27 Feb 2019)RED ARROW indicates the EXPECTED Time and Targets
Level Stoploss point up to maximize profit and reduce risk
I'm working all the time, even in Bearish Market
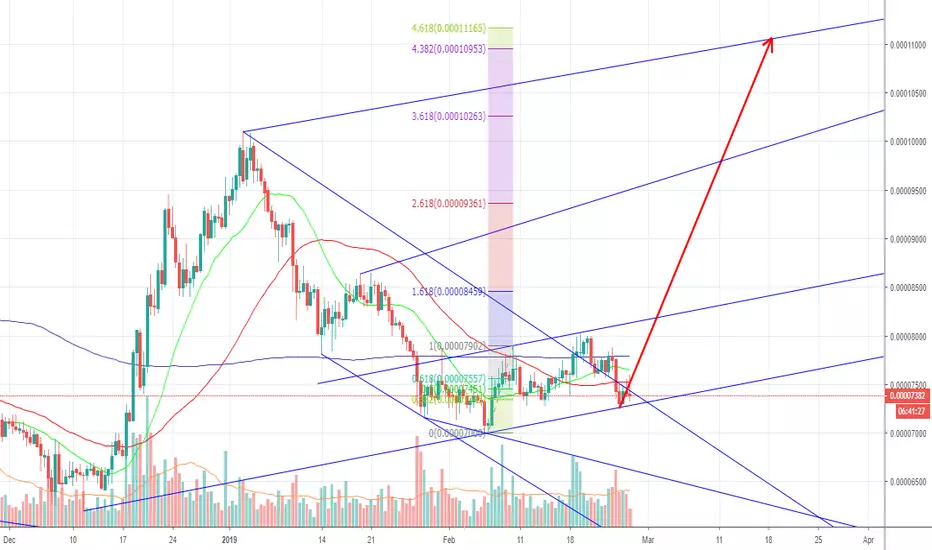


IOTA - Butterfly harmonic play.We have had a bounce on a good 78 retracement level similar to BTC. If IOTA can break 8k I'd be watching a play out of this butterfly harmonic.


IOTANow IOTA moving in accumulation zone this is good zone for buy before IOTA fly. According to my observations, I noticed that the iota team has market makers who know and have experience how to make a rocket for the price of iota. that's why my recommendation is to add this coin to portfolio for the medium term. Swing trading

A trading opportunity to buy in IOTABTCTechnical analysis:
. MIOTA/BITCOIN is in a range bound and the beginning of uptrend is expected.
.The price is above the 21-Day WEMA which acts as a dynamic support.
. The RSI is at 55.
Trading suggestion:
. There is a possibility of temporary retracement to suggested support zone (0.00007500 to 0.00006415). if so, traders can set orders based on Price Action and expect to reach short-term targets.
Beginning of entry zone (0.00007500)
Ending of entry zone (0.00006415)
Entry signal:
Signal to enter the market occurs when the price comes to "Buy zone" then forms one of the reversal patterns, whether "Bullish Engulfing" , "Hammer" or "Valley" in other words,
NO entry signal when the price comes to the zone BUT after any of the reversal patterns is formed in the zone.
To learn more about "Entry signal" and the special version of our "Price Action" strategy FOLLOW our lessons:
Take Profits:
TP1= @ 0.00008540
TP2= @ 0.00009380
TP3= @ 0.00011050
TP4= @ 0.00012950
TP5= @ 0.00014060
TP6= @ 0.00016480
TP7= @ 0.00018910
TP8= @ 0.00026760
TP9= @ 0.00031200
TP10= Free

IOTA/BTC Do not miss the opportunityThis is a good opportunity for you to create more than 10% of profits
Stoploss: 7450
Target: 8953

$IOTA Setting up nicely. Could run well here...This looks like a high probability trade. A lot of key ideas are in confluence across multiple time frames. But I definitely will be adding a stop loss.
Daily - We see a massive wedge formation playing out. and a Strong level of Support/Resistance. If we can get a daily close above, this could bounce off of support and continue upwards.
12Hr - We've had a lot of key signals play out
- Bullish TK Cross
- Bullish Kumo Twist
- Chikou Span above price
- Breaking out and closing above the cloud ( Waiting on this confirmation - close of candle )
3Hr - This short term time frame is the most bullish of the 3
- Bullish TK Cross, above the cloud
- Cloud is already green
- Chikou Span above Price
- Finding support on the Tenkan and continuing to bounce

IOTA ($IOTA) - up to 460% PPT! Long term trade.$IOTA is showing bullish divergence on daily chart.
Price reached buy zone and had been moving there for a while.
$IOTA is one of the top project in crypto space with great idea and community support.
Green - buy. Red - sell.
I do not recommend using this chart for margin trading.
It's not a financial advice.
Trade carefully and good luck!
