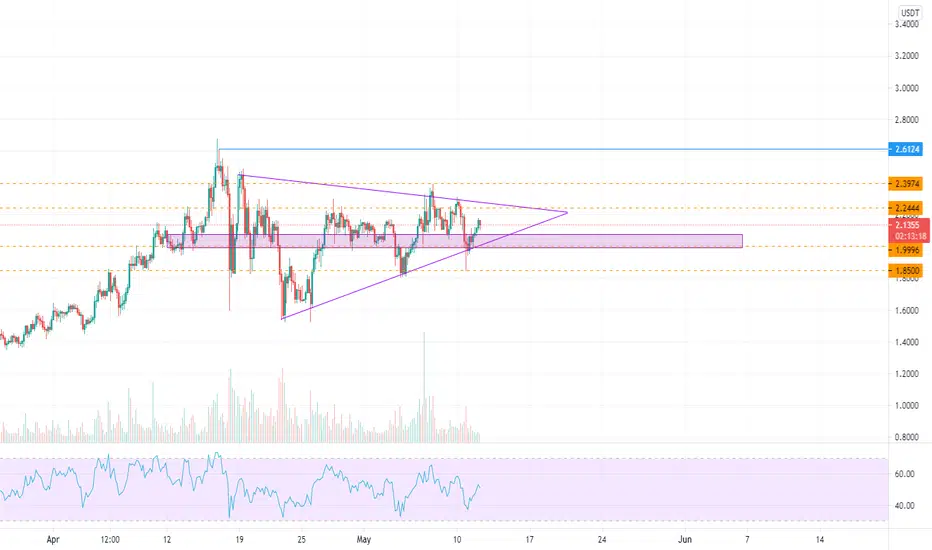
Is IOTA going for new ATH ???Hello everyone ! Historically, in 2017 bull run, IOTA's All Time High achieved and it is 5.69 . Now, IOTA movements belong to a symmetrical triangle with blue lines. Resistance levels are given with fibonacci and support levels are the trend lines. Orange one comes from January and I am attaching the bigger picture.If alts are rising then this can be the bottom for IOTA. Make sure to control your risks and not be greedy while trading. Any of these are financial advice. Have a good one!
IOTAUSDT trade ideas

My Iota idea.A fairly simple idea about IOTA .
For me, this is still a highly growth-charged coin and I do not believe that after 1000 days of trading, it showed ATH only 25 percent higher than the previous one.
The growth will definitely be parabolic, but it is difficult to judge the timings due to the unpredictability of BTC.
I've drawn her height in chunks of her own graph, just because it looks neat.)
This is only 1 of the possible options for her movement, which seems to me the most attractive and real.
as the price moves, I will update the idea.
Of course, not recommendation, evaluate your risks, do not forget about stop loss and of course about take profit)


IOTA/USDT Binance (Trends/Levels)Looking at the trend and finding key support levels. I'm always bullish on IOTA. I'm thinking it surges for its next move to a key level at approx. 2.40 . DYOR . Not financial advice. If you have any thoughts please comment.

IOTA LONG
Follow My TradingView Profile To Get Alert
--------------------------------------------------------------
IOTA
1. TP1 2.8$
2. EXIT 3.16$
--------------------------------------------------------------
Always Take Your Own Risk and Don't Get To FOMO.
Please Always Take Your Profit If you Didnt' bought in bearish season .

IOTA/USDT Binance (1hr) Updated IOTA smashing through key levels. Looking to break the 2.00 level and continue on to its next key level. Looking real good and bouncing. See you on the moon. Follow me for more chart TA ideas. Remember to DYOR. Not financial advice.
See you next time !

IOTA/USDT Binance (2hrs) Observing levels on 2hrs frame. Looking very bullish ! My first of many charts. Follow me through my process ! Thank You


IOTAWednesday, 12 May 2021
16:16 PM (WIB)
IOTA is getting near to the support lines. I will purchase IOTA soon the price reach the support lines, with triple stop loss for long term investment.
Best regards,
RyodaBrainless
"Live to Ride and Ride to Live"

IotaUsdt_DEntry: 1.65 - 1.8
Resistance : 2.5
Target : 4
Time analysis shows it 'll reach 4 $ about 15 June.
No financial advice.

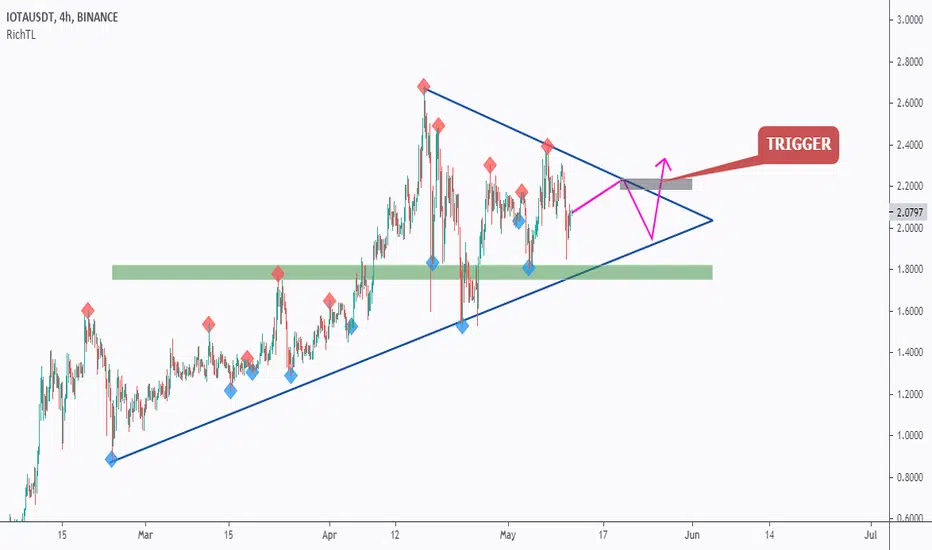
IOTA - Trend-Following Setup!Hello everyone, if you like the idea, do not forget to support with a like and follow.
I found IOTA chart interesting! ( H4 timeframe )
IOTA is overall bullish trading above the lower blue trendline.
However, now it is stuck inside a range in the shape of a symmetrical triangle. And every new candle is making the range even narrower.
Well as per the textbook, a symmetrical triangle is a bilateral pattern, which means it can be broken on either side.
I am looking to add IOTA to my portfolio, but before we buy, we want the buyers to prove that they are taking over.
As per my trading plan, I will be waiting for a new swing to form around the upper blue trendline, (projection in purple) to consider it valid then enter on its break upward. (gray zone)
And of course, as price approaches the lower blue trendline and green zone, we will also be looking for buy setups on lower timeframes. (short-term)
Good luck!
All Strategies Are Good; If Managed Properly!
~Rich

IOTATuesday, 11 May 2021
15:05 PM (WIB)
IOTA has completed all structure in downtrend mode. It has fallen to 1. Fibonacci and rose to 0.236. Now the price at 0.786 and it seem will move higher from now.
Best regards,
RyodaBrainless
"Live to Ride and Ride to Live"

IOTA/USDT Long PositionLaddering some buys downwards towards the bottom of this rising triangle that we have forming.
We've been trying to force our way through that pretty solid resistance.
If we get a breakout it should be a pretty massive breakout.
Iota still has very far to go in terms of a bullish run, so potentially could be a big trade.
There is an AMA with the IOTA devs today so hopefully some more good news will be coming.
Trade safe friends.

#IOTAUSDT #IOTAUSDT BINANCE -SPOT
UPDATE
10-may-2021
1W
👉Entry: 1.7 - 2.2
🚀Targets: 2.5 - 2.9 - 4.1 - 5.9 - 10 - 12 - ++++
⚡️use 5% max of your deposit
🚦STOP: 1.4
🚦STOP: Close Weekly candle below 1.1


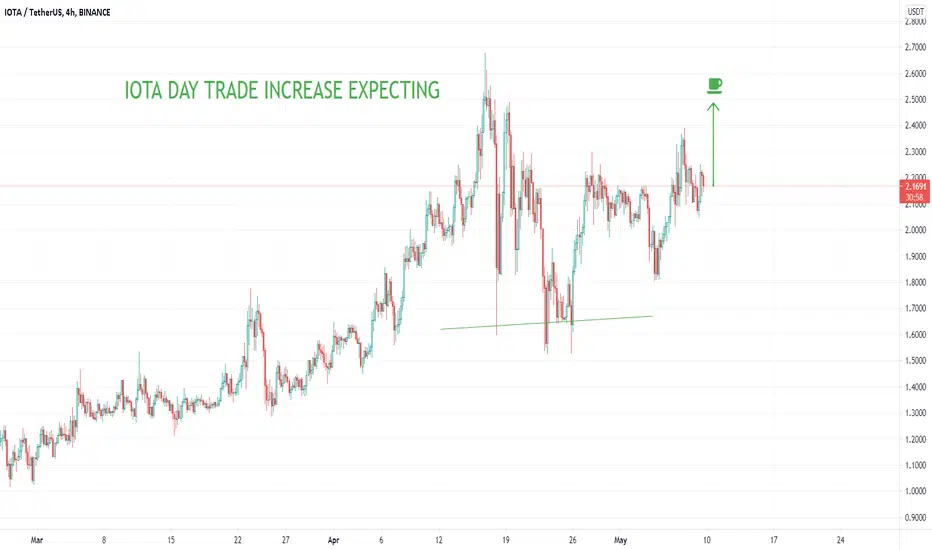
IOTA NEXT DAY TRADE INCREASE COIN / DAY TRADE INCREASE TRENDHello trading friends,
Iota looks to have a next increase trend depending on day trade °if bitcoin becomes stable, IOTA can be one of the best coins that can increase depending on-trend show.
Soon more about it.


IOTAUSDTHello to you all. Mars Signals team wishes you high profits at all times.
If we cross the resistance line, we will enter into a deal for the above purposes
But if green support is lost, which is unlikely, we can predict a decline
Warning: This is just a suggestion to you and we do not guarantee profits.
Wish you luck!
