IOTX Is Still Bullish (12H)The important trigger line has been broken, and the price has recently formed the main bullish CH (Change of Character).
If the demand zone holds, the price may move toward the flip line.
A daily candle closing below the invalidation level would invalidate this analysis.
Do not enter the position

Is it going to happen? IOTX/USDT Potential upword movment ?While IOTX is currently exhibiting bearish indicators, such as trading below significant moving averages and a bearish MACD crossover, the RSI suggests it is not yet in oversold territory. The increased volume during price dips may indicate accumulating interest at lower levels, potentially providin

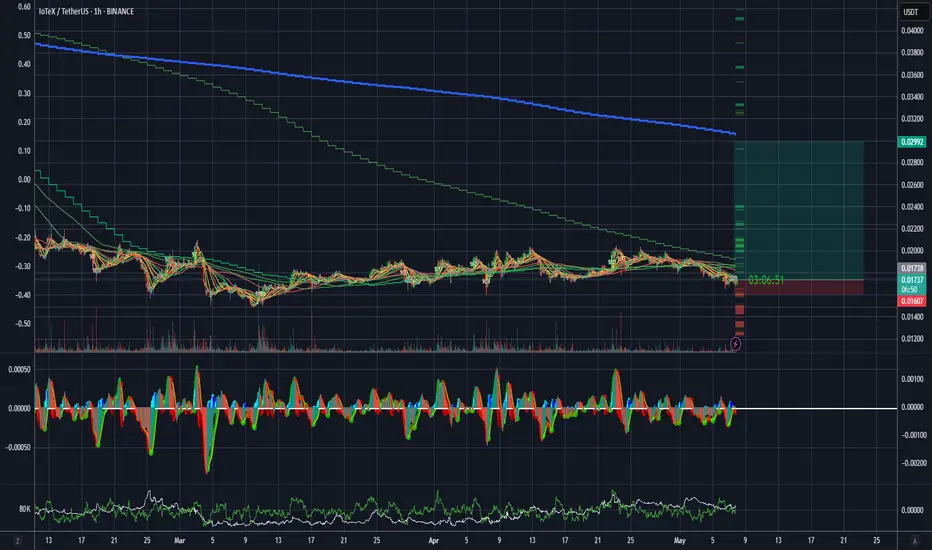
Trading opportunity for IOTXUSDTBased on technical factors there is a Buy position in :
📊 IOTXUSDT
🔵 Buy Now
🪫Stop loss 0.01475
🔋Target 0.02800
📏 R/R 3,3
💸RISK : 1%
We hope it is profitable for you ❤️
Please support our activity with your likes👍 and comments📝

IOTXUSDT 1D#IOTX has broken above the descending channel and the MA50 on the daily chart. In case of a successful retest, the targets are:
🎯 $0.02143
🎯 $0.02511
🎯 $0.02808
🎯 $0.03105
Use a tight stop-loss.

#IOTX/USDT#IOTX
The price is moving within a descending channel on the 1-hour frame, adhering well to it, and is on its way to breaking it strongly upwards and retesting it.
We are seeing a bounce from the lower boundary of the descending channel, this support at 0.01877.
We have a downtrend on the RSI indi

IOTXUSDT 4HOUR📊 Technical Breakdown
📈 Pattern: Falling Wedge (Bullish Reversal)
The price broke out of a falling wedge, a bullish reversal pattern.
Wedge breakout occurred with a slight increase in volume and RSI confirmation, indicating momentum shifting towards bulls.
💵 Entry Level
Marked near 0.01838 USDT, r

IOTXUSDT | Key Resistance Zone Identified – Trade SmartIOTXUSDT has reached a critical resistance zone marked by the red box. This is the first major level where sellers could step in, making it an important area to monitor. Blindly entering positions here is a rookie mistake—as always, we need confirmations.
🔴 Short Setup Considerations:
✔️ LTF Market

Scalping Set up $IOXT$IOXT will exploud after breakout that snr and also asc triangle
just wait until he break that asc triangle!
Goodluck , Dyor!

Iotex/usdt 1DHello, after finishing the downward trend, the iotex currency is expected to end its downward trend in 3-4 weeks and start a new upward trend.

See all ideas
Summarizing what the indicators are suggesting.
Oscillators
Neutral
SellBuy
Strong sellStrong buy
Strong sellSellNeutralBuyStrong buy
Oscillators
Neutral
SellBuy
Strong sellStrong buy
Strong sellSellNeutralBuyStrong buy
Summary
Neutral
SellBuy
Strong sellStrong buy
Strong sellSellNeutralBuyStrong buy
Summary
Neutral
SellBuy
Strong sellStrong buy
Strong sellSellNeutralBuyStrong buy
Summary
Neutral
SellBuy
Strong sellStrong buy
Strong sellSellNeutralBuyStrong buy
Moving Averages
Neutral
SellBuy
Strong sellStrong buy
Strong sellSellNeutralBuyStrong buy
Moving Averages
Neutral
SellBuy
Strong sellStrong buy
Strong sellSellNeutralBuyStrong buy
Displays a symbol's price movements over previous years to identify recurring trends.