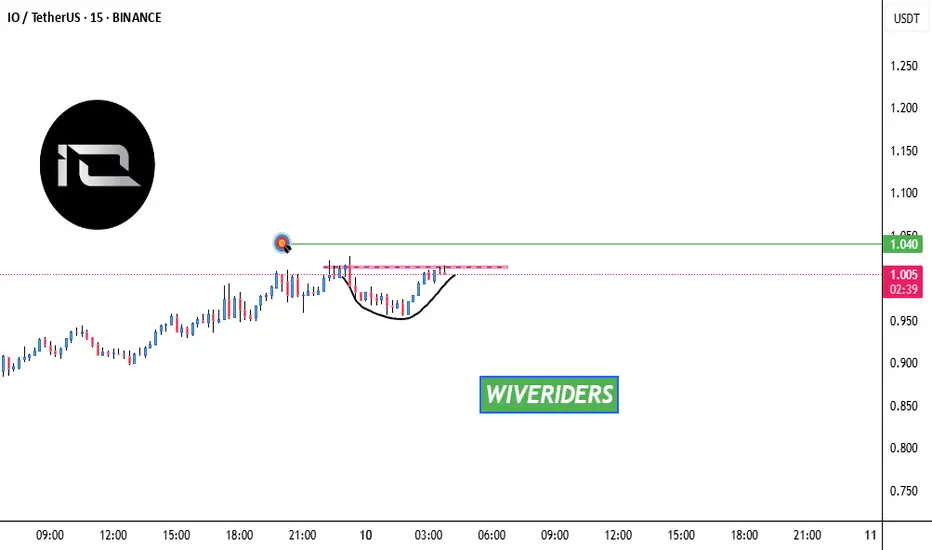
$IO Bullish Structure Intact – Watching for $1.20+SEED_ALEXDRAYM_SHORTINTEREST2:IO broke the neckline and converted it into a support
This clean inverse setup came together beautifully. Price is currently sitting above $0.98 and poised to start the next up leg.
If we do get a healthy pullback to the neckline, that's the area to monitor for stron

Bullish Cup with Handle🚀 SEED_ALEXDRAYM_SHORTINTEREST2:IO Forming Bullish Cup with Handle – Breakout Potential! 📈
SEED_ALEXDRAYM_SHORTINTEREST2:IO is forming a potential bullish cup with handle pattern! 🧠 If the price breaks the red resistance, the first target could be the green line level! 🔥
Let’s catch this brea
IO To MoonBullish Div on the Weekly TF broke the previous 1D high with huge Volume
WIth a mcap of around 139M targets for alt season would be 8$ minimun

IOUSDT 1D Analysis IO ~ 1D Analysis
#IO Buy after successfully breaking this resistance line with a short term target of at least 15%+ from here.

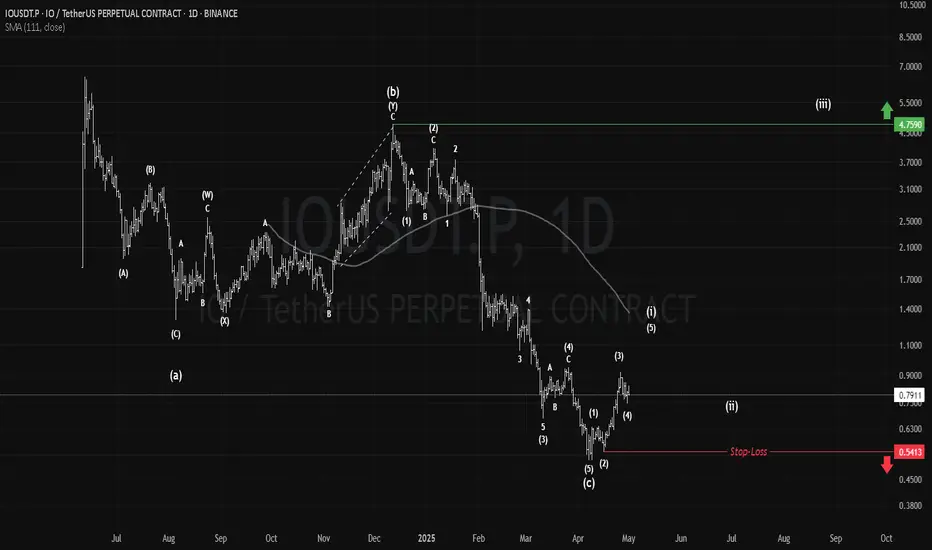
IO: The AI Comeback?#IO is a new AI token that was launched back in Jun 2024. Recently bounced from the ATL with a bullish PA so far, it shows an optimistic view for this token and for the AI sector in general.
As long as it holds above $0.54 (the stop-loss), a major motive wave shall start to target the ATH.
#IOnet
IO TARGETS SUMMER (FALL) 2025Hello ! There ! Firstly
Thanks for following me!
Secondly - If you need help and you are new here - with targets or something else
Fell free to leave a comment - willing to read and reply
io.net - like many many other coins - especially AI sector is experiencing a nice run up
As we can see on

IO/USDT Weekly Trend Analysis and Reversal OpportunitiesThis analysis offers a detailed review of the IO/USDT weekly chart with a focus on identifying potential reversal zones that may provide attractive trading opportunities. The current market trend is bearish; however, two notable price levels—approximately 0.366 and 0.163—have been identified as pote

#IO/USDT#IO
The price is moving within a descending channel on the 1-hour frame, adhering well to it, and is heading for a strong breakout and retest.
We are seeing a rebound from the lower boundary of the descending channel, which is support at 0.6800.
We have a downtrend on the RSI indicator that is abo

IO /USDT Long Sl -23.4%IO/USDT Long Setup
Reason:
Break of Internal Structure.
Strong Bullish Momentum.
Resting on Major Support.
Swept all possible Liquidity.
All technical indicators suggesting Strong bullish Wave.
Best Regards,
The Panda
BINANCE:IOUSDT
KUCOIN:IOUSDT
MEXC:IOUSDT
BLOFIN:IOUS

ioFor buying, I let the green lines come to check and if they break, the blue lines
But the short time has a small resistance in the red area that needs to be checked

See all ideas
Summarizing what the indicators are suggesting.
Oscillators
Neutral
SellBuy
Strong sellStrong buy
Strong sellSellNeutralBuyStrong buy
Oscillators
Neutral
SellBuy
Strong sellStrong buy
Strong sellSellNeutralBuyStrong buy
Summary
Neutral
SellBuy
Strong sellStrong buy
Strong sellSellNeutralBuyStrong buy
Summary
Neutral
SellBuy
Strong sellStrong buy
Strong sellSellNeutralBuyStrong buy
Summary
Neutral
SellBuy
Strong sellStrong buy
Strong sellSellNeutralBuyStrong buy
Moving Averages
Neutral
SellBuy
Strong sellStrong buy
Strong sellSellNeutralBuyStrong buy
Moving Averages
Neutral
SellBuy
Strong sellStrong buy
Strong sellSellNeutralBuyStrong buy
Displays a symbol's price movements over previous years to identify recurring trends.