JOE Looks Bullish (1D)A 3D divergence is visible on the chart, indicating that sellers have exited their short positions.
A key trigger line has been broken, and the price has reclaimed critical levels.
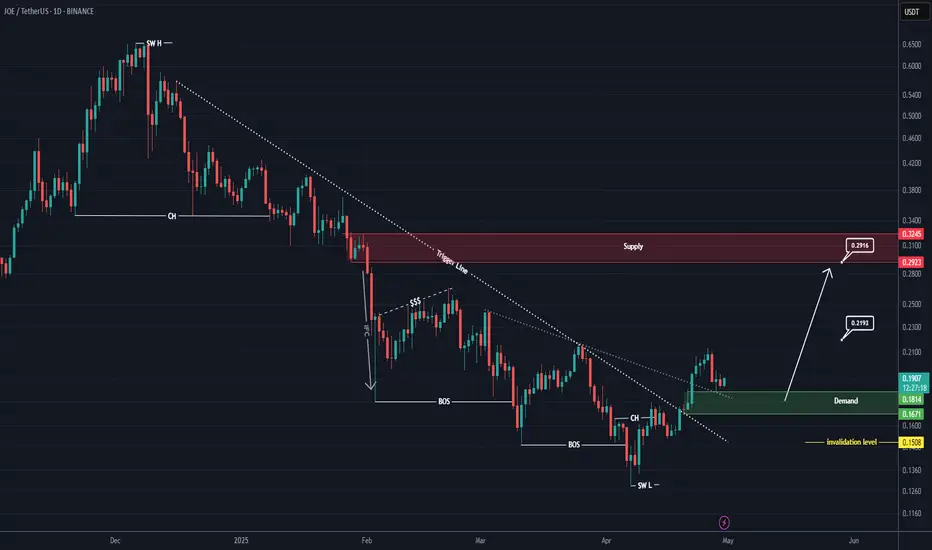
We have identified two entry points where we plan to open buy/long positions.
A daily candle closing below the inval

JOE Looks Bullish (1D)Two important trigger lines have been broken, and a bullish CH (Change of Character) is also visible on the chart. A key support zone has formed, which is expected to hold.
The correction that occurred has been sufficient in terms of both time and price, and the break of the trigger line indicates
JOEUSDT 5DJOE ~ 5D Analysis
#JOE Buy gradually from here with a short -term target of at least 20%+. This is the lowest support for now.

JOE ( SPOT)BINANCE:JOEUSDT
JOE / USDT
1D time frame
analysis tools
____________
SMC
FVG
Trend lines
Fibonacci
Support & resistance
MACD Cross
EMA Cross
______________________________________________________________
Golden Advices.
********************
* Please calculate your losses before any entry.
* Do

#JOE/USDT#JOE
The price is moving in a descending channel on the 1-hour frame and is expected to continue upwards
We have a trend to stabilize above the moving average 100 again
We have a descending trend on the RSI indicator that supports the rise by breaking it upwards
We have a support area at the low

JOEUSDT 1WJOE ~ 1W Analysis
#JOE So far it still continues to maintain this support block. Buy from here if you still have a Conviction on this coin.

Can #JOE Bulls Continue this Bullish Momentum? Key Levels Yello Paradisers! Is #JOE about to break out of this falling wedge, or will the bears take full control? Here's why the next move could be massive for #JOEUSDT:
💎#JOEUSD has been trading within a falling wedge formation, consistently rejecting from its descending resistance. This pattern is typical

Alikze »» JOE | Ascending channel - 1W🔍 Technical analysis: Ascending channel - 1W
📣 BINANCE:JOEUSDT It is moving in an ascending channel on the weekly time frame.
🟢 Given the positive reactions and demand in the bottom area of the ascending channel, the upward movement can continue its growth to the supply area and, if support

#JOE (SPOT) entry ( 0.3000 - 0.3900) T.(1.9400) SL(0.2809)BINANCE:JOEUSDT
#JOE / USDT
Entry ( 0.3000 - 0.3900)
SL 1D close below 0.2809
T1 0.7420
T2 0.9500
T3 1.3000
T4 1.9400
This trade is updating for last trade due to Bull run situation now ........ check it below
______________________________________________________________
Golden Advice

Liquidity Zone Detector for Crypto Tradersa powerful indicator that identifies key liquidity zones where prices are likely to reverse or experience volatility. Perfect for crypto and memecoin traders, it highlights buy (B) and sell (S) zones, enabling smarter entries and exits. Customizable and optimized for volatile markets, this tool is y

See all ideas
Summarizing what the indicators are suggesting.
Oscillators
Neutral
SellBuy
Strong sellStrong buy
Strong sellSellNeutralBuyStrong buy
Oscillators
Neutral
SellBuy
Strong sellStrong buy
Strong sellSellNeutralBuyStrong buy
Summary
Neutral
SellBuy
Strong sellStrong buy
Strong sellSellNeutralBuyStrong buy
Summary
Neutral
SellBuy
Strong sellStrong buy
Strong sellSellNeutralBuyStrong buy
Summary
Neutral
SellBuy
Strong sellStrong buy
Strong sellSellNeutralBuyStrong buy
Moving Averages
Neutral
SellBuy
Strong sellStrong buy
Strong sellSellNeutralBuyStrong buy
Moving Averages
Neutral
SellBuy
Strong sellStrong buy
Strong sellSellNeutralBuyStrong buy
Displays a symbol's price movements over previous years to identify recurring trends.