FSR - FIRSTRANDFirstrand has formed a head & shoulder formation on the daily chart. It made a false break out of the head & shoulder as well as the bullish downward channel. It is currently testing the ema 50, and i am waiting for a turn around candle to enter trade. First target is 6900, 2nd target 7600.
Should price go below 6342, this would negate this trade.
FSR trade ideas

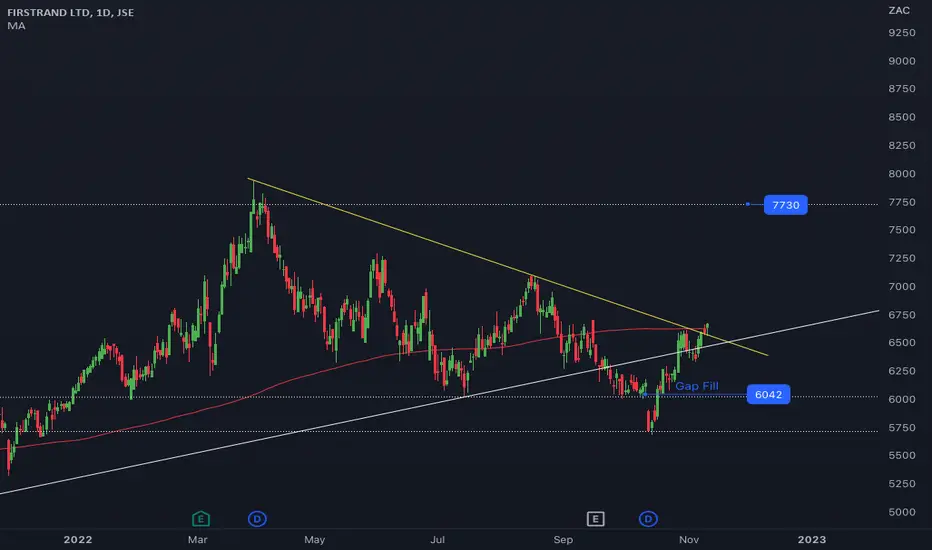
Firstrand breaks downtrend FSR has broken its downtrend and a strong close today can possibly ensure it has also reclaimed its 200DMA. If so, first target is 71.00 with a longer term target of 77.
Engulfing - FSRWe are looking for a small downward move on JSE:FSR based off of the formation of a bearish engulfing candle on Friday. The short has been triggered and the target is at the R62 level.

Market Neutral Idea: Buy FSR, Sell SBKAs per my research note published on Sunday evening, I believe that this market neutral (pair) trade remains applicable at this stage.
The pair considers a Long FSR position against a Short SBK position. A successful pair trade can be realized 1 of 3 ways: (1) The long position rises while the short position falls. (2) The long position rises faster than the short position rises. (3) The short position falls faster than the long position falls.
Entry: Current levels (0.3767) or better
Stop: 0.3610
Target: 0.3950
Also note the attached short/sell idea on SBK remains valid.


Look for buys from bottomHi,
Firstrand ltd is a great company technically. A correction is coming soon as guys start taking their profits. Look for buys once you start seeing the correction.
Good luck guys
Bullish Harami - FSRA Bullish Harami has formed on JSE:FSR which is a bottom reversal signal. It has triggered our long position and we have a target at around the 64.40 level. There is however, a gap that needs to be closed at around the 61 level. Be aware of this, as it may close the gap and come down instead of continuing upward.

Triangle In FormationThe stock is in what seems to be a triangle, we have leg "d" and "e" to complete before we can take any action. A triangle is a Corrective pattern of which a prior trend continues after it's done forming. At the time when interest rates are rising rampantly, banks are one of those who will benefit.

AG Capital -Storm trading Morning Call 13 May 2022We give a quick recap of markets overnight and the previous day and insights into the day ahead with a few trade ideas on the day. Ideas are strictly NOT INVESTMENT ADVICE.

AG Capital -Storm trading Morning Call 21 April 2022We give a quick recap of markets overnight and the previous day and insights into the day ahead with a few trade ideas on the day. Ideas are strictly NOT INVESTMENT ADVICE.

AG Capital -Storm trading Morning Call 13 April 2022We give a quick recap of markets overnight and the previous day and insights into the day ahead with a few trade ideas on the day. Ideas are strictly NOT INVESTMENT ADVICE.

AG Capital -Storm trading Morning Call 29 March 2022We give a quick recap of markets overnight and the previous day and insights into the day ahead with a few trade ideas on the day. Ideas are strictly NOT INVESTMENT ADVICE.

AG Capital -Storm trading Morning Call 9 March We give a quick recap of markets overnight and the previous day and insights into the day ahead with a few trade ideas on the day. Ideas are strictly NOT INVESTMENT ADVICE.

Bearish Harami signaling a down move on FSRA Bearish Harami pattern formed on Friday on JSE:FSR . With today's move so far, we have been entered into a short position.

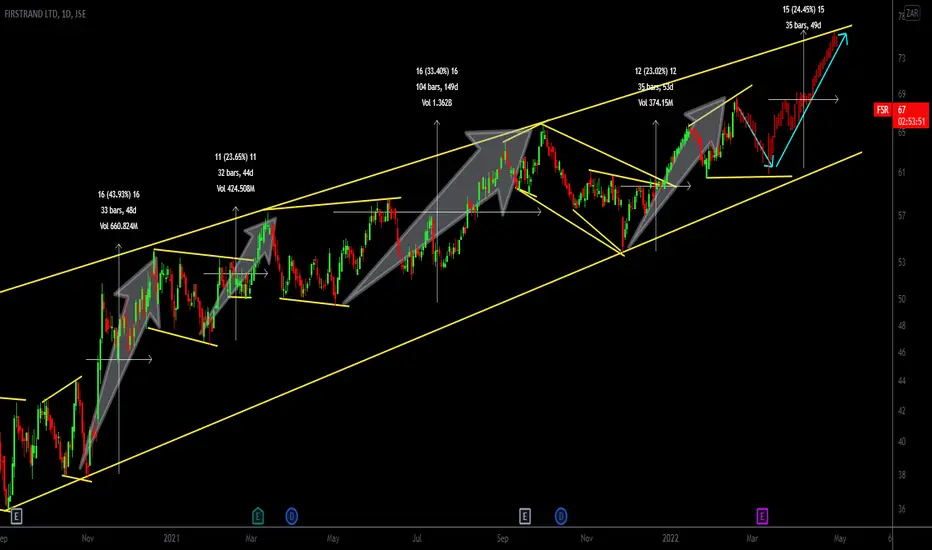
FIRST RAND first Rand bull case still at play since we are on the rate cycle banks are moving higher

Firstrand breakoutNice breakout on JSE:FSR . Potential resistance near R71. From my view, the juice isn't worth the squeeze, there are better setups in other bank stocks, unless you trade in a smaller time frame.

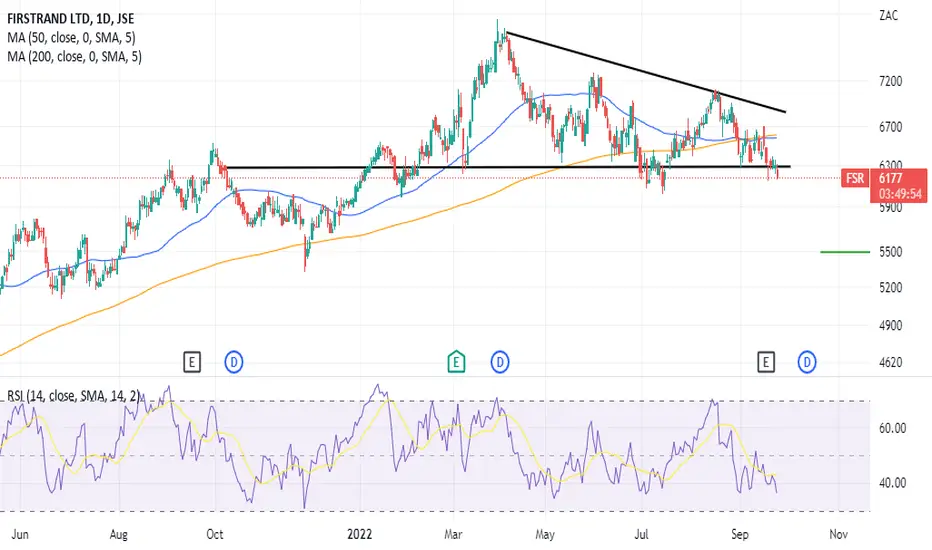
@VIllageTraderZA Head and ShouldersWe have a nice head and shoulders pattern. Backed by rising interest rate. Rising interest rates are significant wind at the back. Just a matter of waiting for the breakout

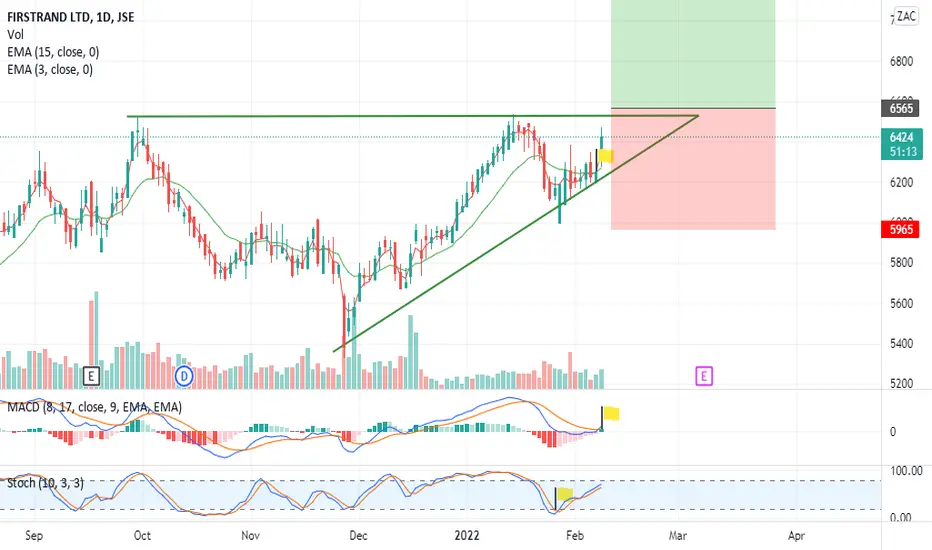
FSR - Ascending Triangle with upwards momentumJSE:FSR is showing good signs of upward momentum whilst trading in an ascending triangle. If it breaks through the top resistance of the triangle, I will enter long.
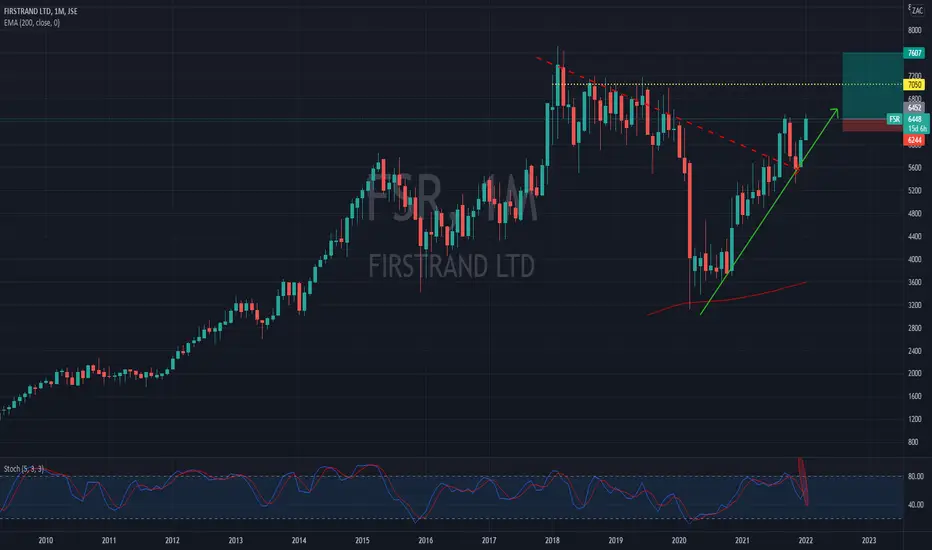
A LT idea on JSE:FSRPrice here on the monthly chart testing the trendline and bouncing higher. Price at a new 52Week high and if we zoom into the weekly chart we see 5300 an SR level and 7000 the next SR level to watch for price action. Also note the stock is overbought on the daily chart. A decent spot for a long pos here. As always manage your risk
Major Domestic Shares: Relative Performance vs Top 40 IndexOne of several charts/insights published to our client platform this morning.
Major Domestic Shares: Relative Performance vs Top 40 Index With 50-day Moving Average (Blue Sloping Line)
MTN, NPN, FSR, SOL, AGL, CFR.
For more insights/real-time ideas, get in touch today.

FSR Potential Short coming soonJSE:FSR broke through a support trend line late November which it has since tested again and it seems to have become a resistance level. If it continues downwards and the MACD crosses downwards as well, I think we could see a short move down towards the 5200 price area. I will wait for confirmation before entering.

@VillageTraderZA - Double bottom. Nice double bottom for 2RR waiting for a break above the 50 day EMA
