Kaspa bullish VibesChart Analysis
This is a daily (1D) candlestick chart for KAS/USDT on the Gate.io exchange, created by "GoonBoyCrypto" as of December 4, 2025.
It covers historical price action from July 2025 onward, with projections extending into early 2026 (up to March). The price scale ranges roughly from 0.05

Kaspa (KAS): If Buyers Don't Secure This Zone We Are DoomedKAS pulled back into the last support zone we marked, and this is the spot where buyers need to take back dominance. The reaction isn’t strong yet, but the zone is holding, so the long idea still makes sense as long as price stays above it.
For continuation, we need to see buyers reclaim that small

$KASPA BULLISH MEXC:KASUSDT just tapped into the first order block (0.05430 – 0.05105) and reacted with a bullish push, signaling a potential reversal after the confirmed bullish CHoCH on the daily timeframe. If this reaction holds, price could aim for the upside targets at 0.06373 and 0.08971 as marked on the ch

KASPASince the 26th of September, CSE:KAS has not only printed a clear buy signal but has shown remarkable strength. Major resistance will broken, momentum is intact, and all roads are now open toward the $0.08 target.

Kaspa road to yearly openI think MEXC:KASUSDT can bounce at least in middle term to yearly open 2025 + the same level its a first big liquidity pool!
On left side you can see pure 3 drives pattern! So congrats everyone who out in 2024 Because when on weekly tf after 11000% gains any asset form this pattern its so rare ca

KASUSDT Breakdown Confirmed?Yello Paradisers, have you already positioned yourself on KASUSDT’s bearish move, or are you about to get trapped by a false bounce? The market just gave us a major clue, and ignoring it could cost you.
💎KASUSDT has officially broken below a critical supportive trendline, which was previously holdi
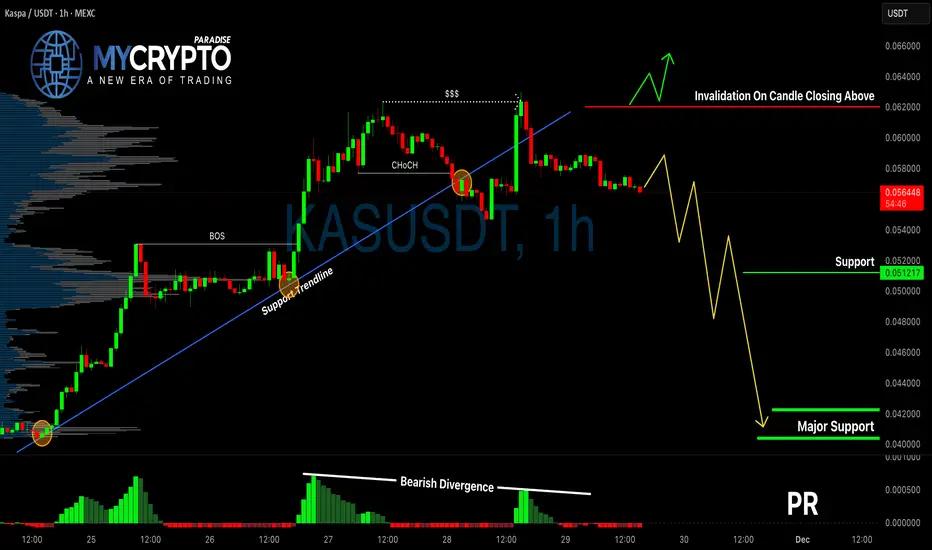
KAS / USDT (1D Timeframe)Pattern: Bearish Downtrend Retracement Into Major Supply Zone + Downside Continuation Setup
The chart shows Kaspa (KAS) pulling back into a high-probability supply zone after a strong downtrend.
Despite a sharp relief rally, market structure remains bearish with repeated Breaks of Structure (BOS)

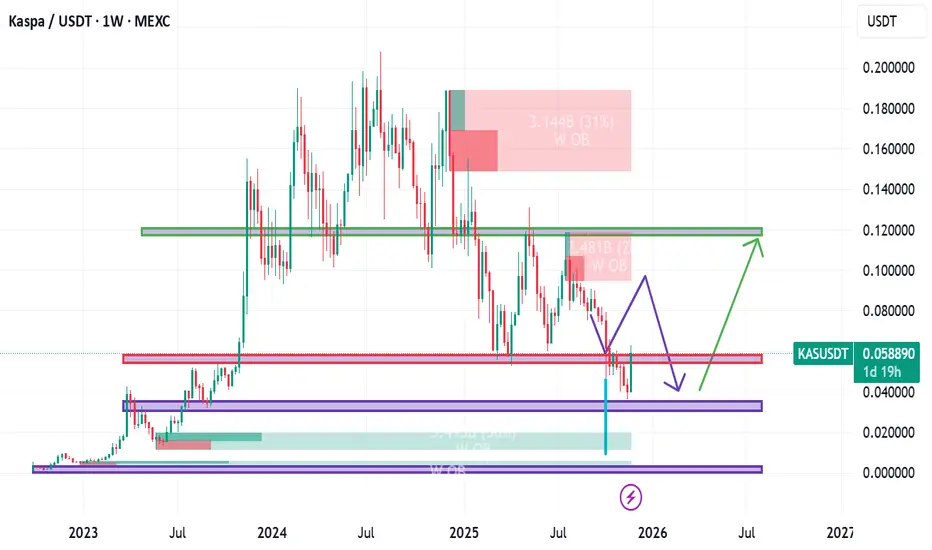
#KASPA - $KAS 2026 Long Term Forecasting.Here’s a detailed analysis of the chart for Kaspa (KAS/USDT) and its potential outlook for 2026:
1. Current Price & Trend
Current Price: Around $0.0586.
Recent Movement: The price has dropped sharply (around -22%) and is near a strong support zone.
Timeframe: Weekly chart (1W), so each candle repr
Breaking: Kaspa ($KAS) Surge 20% Today Kaspa ( CSE:KAS ) Surge 17% today amidst Network upgrade boosts.
Kaspa Breaks Through Momentum Wall as Network Confidence Builds
CSE:KAS has pushed up nearly 20% in the last 24 hours, reclaiming the $0.06 zone with surprising strength after several days of tight consolidation. The move seems

KAS Update
🚨📊 KAS Update
KAS is approaching an important resistance zone 🔴,
but sellers are not in control this time.
Price is moving upward with strength,
and this next red zone will be the key level to watch.
KAS must break out above this resistance
to show a clean continuation toward higher targets.
U

See all ideas
Summarizing what the indicators are suggesting.
Oscillators
Neutral
SellBuy
Strong sellStrong buy
Strong sellSellNeutralBuyStrong buy
Oscillators
Neutral
SellBuy
Strong sellStrong buy
Strong sellSellNeutralBuyStrong buy
Summary
Neutral
SellBuy
Strong sellStrong buy
Strong sellSellNeutralBuyStrong buy
Summary
Neutral
SellBuy
Strong sellStrong buy
Strong sellSellNeutralBuyStrong buy
Summary
Neutral
SellBuy
Strong sellStrong buy
Strong sellSellNeutralBuyStrong buy
Moving Averages
Neutral
SellBuy
Strong sellStrong buy
Strong sellSellNeutralBuyStrong buy
Moving Averages
Neutral
SellBuy
Strong sellStrong buy
Strong sellSellNeutralBuyStrong buy
Displays a symbol's price movements over previous years to identify recurring trends.