Short term Kaspa Price actionSo far if this adam & eve pattern at the .786 plays out fully, we have a volume gap to .149-.15. Breaking out of the neckline of the inverted head n shoulders
KASUSDT.P trade ideas
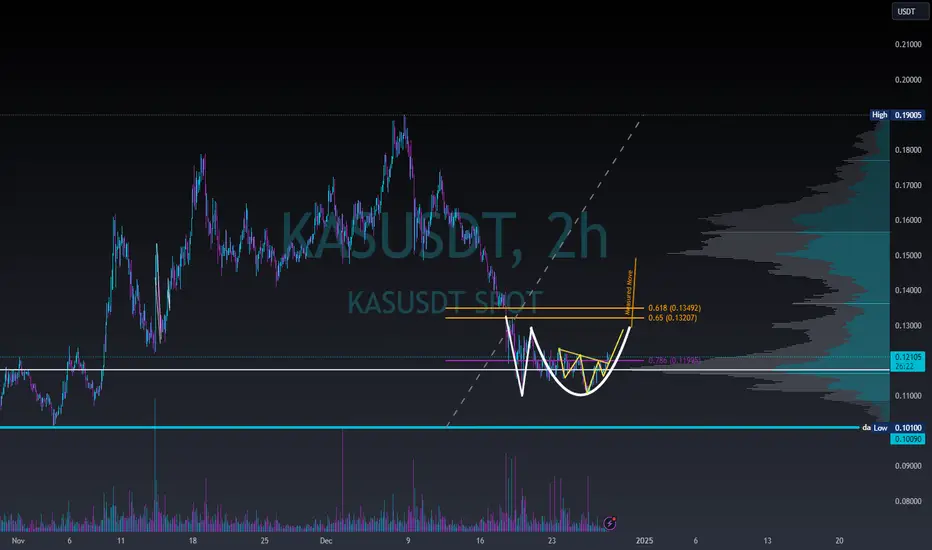
Kaspa in big sideways range or Head and shoulders?Yes we had that big head n shoulders on kaspa to include a bear flag. But that bear flag looking invalidated. I see more bullish tones than bearish tones now. We have price bouncing off monthly support, we are currently reclaiming .786 on a higher low (macro). Are are above point of control and finding support off the Value Area Low. That big head n shoulders on kaspa getting everyone to sell their bags. While the believers buying it up. That's my take. If you think I am "wrong", you are in the wrong business. its not about being right or wrong, its about being positioned for all scenarios. I am ready for .05 at the big .786/ high volume node also

KasusdtBullish on kaspa digital gold
build on trust with code
bull run expected $10
long accumulation period over
lets start engine to super cycle no stop untyill $10
strong support zone at the yearly low
bull and flag pattern

Kaspa / USDT LongWill be watching the next few 4h Candles for confirmation, however noticing 4h bullish div on RSI, so with increased volume could be a reversal, otherwise a great chance to grab KAS at 10c!
Summary of Kaspa Signal Analysis:
1. Current Price and Monthly Chart
- Kaspa is trading at $0.124.
- Monthly chart shows consolidation with selling pressure, but 4-hour chart hints at bullish potential.
2. Head and Shoulders Pattern
- Potential head and shoulders pattern might push the price to test $0.10 support.
- This level is viewed as a possible bottom.
3. Weekly Chart Reversal Signs
- Last week's engulfing candlestick suggests a possible trend reversal.
- RSI and MACD indicate bearish momentum with a chance of further price drops.
4. Oversold Signals and Support
- Oversold RSI conditions near support could lead to a price rebound.
- Bearish MACD momentum appears to be slowing.
5. Daily Chart: Long-Legged Candlestick
- Indicates market indecision and potential weakening of bearish momentum.
- Requires strong green candlesticks for bullish confirmation.
6. 4-Hour Chart Bullish Divergence
- Price making lower lows while RSI makes higher highs points to bullish divergence.
- Engulfing candlestick suggests reversal, but additional confirmation is needed.
7. Critical Upcoming Sessions
- Next 2-3 sessions will reveal if a breakout or continuation of the downtrend occurs.
- Watch for strong green candlesticks or prolonged small candlestick bodies.
8. Resistance Levels
- Immediate resistance at $0.129, with the next level at $0.13.
- Possible outcomes: breakout, consolidation, or continuation of the downtrend.
9. Final Insight
- The next few 4h candlesticks are vital for confirming the bullish divergence and price direction.
Disclaimer: Not Financial Advice
This post is for informational and educational purposes only and should not be construed as financial or investment advice. Cryptocurrency investments are highly volatile and involve significant risk. Always conduct your own research (DYOR) and consult with a licensed financial advisor before making any investment decisions. The author of this post accepts no liability for any financial losses or decisions made based on the information provided. Trade responsibly!

KASPA - Poised for an Upward Trajectory (TA+TRADE PLAN)Technical Analysis of KASPA (KAS/USDT)
Falling Wedge Pattern:
The chart indicates a classic falling wedge pattern, a bullish reversal formation. The price is approaching the breakout point where resistance has converged with support, as marked on the chart.
The breakout above the resistance line suggests a potential upward trend.
Volume Analysis:
A spike in trading volume near the breakout area confirms increased interest and possible momentum shift.
Momentum Indicators:
VWMCipher B Divergences: Displays bullish divergence, supporting a potential price increase.
RSI (Relative Strength Index): At ~27, indicating oversold conditions. This signals a potential upward price movement as the asset appears undervalued.
Arty Money Flow Index (MFI): At ~24, indicating an oversold condition with possible accumulation.
Stochastic Oscillator: Oversold levels at 32.5, crossing upwards, indicating a buy signal.
Potential Targets:
Short-Term Target: $0.14 (breakout confirmation).
Mid-Term Target: $0.18 (previous resistance level).
Long-Term Target: $0.22–$0.24 (major resistance zone from earlier trends).
Risk Level:
Support at ~$0.12. A breakdown below this level invalidates the bullish thesis, making this a critical stop-loss level.
Trading Plan
Entry Points:
Initial Buy Zone: Enter near the breakout point (~$0.128-$0.132) to capitalize on bullish momentum.
Confirmation Entry: Add to the position once price closes above $0.14 with strong volume.
Stop Loss:
Place a stop-loss slightly below $0.12 (e.g., $0.118) to limit downside risk if the breakout fails.
Profit-Taking Strategy:
First Take-Profit (TP1): At $0.14 (~10% gain) to secure initial profits.
Second Take-Profit (TP2): At $0.18 (approximately 40% gain from entry).
Final Target (TP3): $0.22-$0.24 for long-term holders seeking maximum gains.
Position Sizing:
Allocate 2–5% of your portfolio, depending on your risk tolerance. Keep capital reserved for potential averaging down if needed.
Trailing Stop:
Implement a trailing stop once the price exceeds $0.18 to lock in profits while allowing room for further upward movement.
Risk Management:
Maintain a Risk-Reward Ratio of at least 1:3. Adjust trade size to manage risk effectively.
Monitoring:
Regularly check volume trends, RSI levels, and significant market news affecting KASPA.
Be cautious of overall cryptocurrency market sentiment, as broader trends often impact altcoins.
This falling wedge setup, combined with oversold indicators and volume confirmation, suggests KASPA is primed for a bullish breakout. Stick to the trading plan and employ disciplined risk management to maximize returns while minimizing potential losses.

Technical Analysis for KAS/USDT + TRADING PLANTechnical Analysis for KAS/USDT
Chart Pattern:
The Head and Shoulders 2X pattern (highlighted in orange) is forming, which suggests a potential reversal. This is a bearish pattern when it completes.
The neckline for the Head and Shoulders pattern aligns around the long support 1 (green line). A decisive breakdown from this support could confirm the bearish trend.
Key Support and Resistance Levels:
Resistance Line (Red): This upward resistance acts as a price ceiling, aligning with the upper boundary of the channel. Current resistance is near $0.25-$0.30.
Long Support 1 and 2 (Green):
First support aligns at approximately $0.12-$0.14 (immediate support).
Second, stronger support lies near $0.09-$0.10 if breakdown occurs.
Intermediate Support (Blue): The long-term trendline below the neckline provides another zone of support.
Trend Outlook:
Short-Term (Bearish to Neutral): Price is consolidating near $0.14. The dotted path shows potential upward movement, but breaking the neckline could lead to a downside push.
Medium-Term (Bullish Potential): If the price holds support and breaks above $0.17-$0.20, Kaspa could return to an upward trajectory within the channel.
Long-Term (Bullish Channel): The broader channel remains intact, and price action could resume its uptrend toward resistance near $0.30.
Indicators Analysis:
Volume: Volume is relatively low, indicating low buying pressure. A breakout requires higher volume.
RSI (Relative Strength Index):
Current RSI: Near 54. This is neutral territory.
Observation: RSI must remain above 50 to support an upward trend.
Money Flow Index (MFI):
The MFI shows a slight upward trend at 32, which suggests weak buying interest.
Stochastic Oscillator:
Stochastic is near 12, indicating a potential oversold condition, which may lead to a short-term bounce.
Trading Plan
Short-Term Strategy (1-2 weeks):
Buy Zone: If Kaspa retests support at $0.12-$0.14, consider accumulating small positions.
Stop-Loss: Place a stop-loss below $0.12 to protect against breakdown.
Target 1: $0.17 (short-term resistance).
Target 2: $0.20 (key breakout level).
Medium-Term Strategy (1-3 months):
Breakout Trade: Enter long positions if price closes above $0.17-$0.20 with strong volume confirmation.
Stop-Loss: Adjust stop-loss to $0.14 after breakout.
Target: $0.25 (resistance near the top of the upward channel).
Long-Term Strategy (3-12 months):
Channel Trend: Continue holding positions if the price respects the long-term support levels and upward channel trendline.
Target: $0.30-$0.35 (upper resistance).
Risk Management:
Position Sizing: Limit exposure to 2-5% of total portfolio on each trade.
Trailing Stop: Use a trailing stop once price hits $0.17-$0.20 to lock in profits.
Kaspa remains in a critical phase with potential for both upward breakout or breakdown. Watch the $0.14 neckline and volume closely. Traders can capitalize on support bounces or confirm long positions above $0.17-$0.20 for better risk/reward setups.

Technical Analysis of KASPA (KAS/USDT) + TRADE PLANPrice Action and Trend Structure:
Uptrend Formation: The chart shows an uptrend leading into the formation of a descending triangle pattern. The price has seen a significant rise, but the recent price action shows consolidation within a triangular range, indicating a potential for either continuation or reversal.
Descending Triangle: The descending triangle is characterized by lower highs and a horizontal support level. This pattern typically signals a bearish breakout if the support level is broken. However, if the price holds the support and breaks above the resistance, a bullish move could be expected.
Current Price Levels:
Support Level: Around 0.1559 (a crucial level to watch for potential breakdown).
Resistance Level: Around 0.1645 (near the upper trendline of the triangle).
Target Zone: If the price breaks above resistance, the next target could be in the range of 0.19 to 0.22, where higher resistance is likely.
Volume Analysis:
Volume Trend: There is a noticeable increase in volume during the down move, suggesting market participants are hesitant, but not necessarily driving a strong sell-off.
The relatively lower volume during price consolidation could imply that the market is waiting for a breakout, either bullish or bearish.
Momentum Indicators:
RSI (Relative Strength Index): The RSI currently sits at 41.32, which is in the neutral zone. This indicates neither overbought nor oversold conditions, suggesting that the price could break in either direction, depending on the next catalyst.
VMC Cipher B Divergence: The divergence shows a potential weakening in the bearish momentum, which could be a signal that the downtrend might be losing strength. However, the market is still within a consolidation phase, so confirmation from price action is needed.
Stochastic Oscillator: The stochastic indicator is at 29.13, which suggests the asset is nearing an oversold condition, with potential for a rebound or reversal if the price breaks upwards.
Other Indicators:
Art Money Flow: At 40.63, the flow is in the neutral range, with no strong buying or selling pressure. This indicates that the market is in a waiting phase, with traders potentially looking for confirmation of a breakout.
Trading Plan for KASPA (KAS/USDT)
Bullish Scenario (Breakout Above Resistance):
Entry Point: If KASPA breaks above the resistance at 0.1645, look to enter a long position.
Target Price: Aim for a price target around 0.19 to 0.22, where higher resistance exists.
Stop Loss: Set a stop loss around 0.15, just below the key support level to minimize risk in case of a breakdown.
Risk-Reward Ratio: This strategy would offer a favorable risk-reward ratio, especially if the price targets are reached.
Bearish Scenario (Breakdown Below Support):
Entry Point: If the price breaks below the support at 0.1559, consider entering a short position.
Target Price: The target for this move could be 0.14, with the potential for further downside depending on market conditions.
Stop Loss: Place a stop loss just above the broken support (around 0.16) to limit losses in case of a false breakdown.
Risk-Reward Ratio: This strategy also provides a favorable risk-reward if the breakdown sustains.
Trade Confirmation:
Volume Confirmation: Ensure that any breakout or breakdown is accompanied by a significant volume increase, confirming the validity of the move.
Momentum Indicators: Use the RSI, Stochastic, and Money Flow indicators to monitor if the momentum supports the direction of the breakout. For bullish trades, look for an RSI above 50 and the Stochastic moving out of oversold territory.
Long-Term Outlook:
Should the price break the upper resistance and rally above 0.22, the next resistance zone could extend to 0.25 or higher, indicating potential for a longer-term bullish trend.
Conversely, if the breakdown below 0.15 results in sustained selling pressure, watch for deeper corrections or consolidation at lower levels.
Summary:
Watch for a breakout above 0.1645 for potential bullish momentum targeting 0.19-0.22.
Watch for a breakdown below 0.1559 for a bearish move targeting 0.14.
Ensure trade confirmation with volume analysis and momentum indicators.
By following this plan, you can effectively manage risk while taking advantage of KASPA's price action.

KASPA price scenario dec 16 2024KASPA price scenario dec 16 2024
Kas has still some work to do to break out up the channel in my opinion

Kaspa looking good Currently, kaspa looking good. local bottom signals with some nice bullish divergences at the .786. Market structure looks mighty fine currently. we will see.

Ridiculous capitulation, nice 3 drives, hi vol and RSI OS alert Ridiculous capitulation, nice 3 drives, hi vol and RSI OS alert
nice 3 drives, hi vol and RSI OS alert,
HiLoCh indicator on 30m TF
1. 3 drives down from the break
2. High vol and b Vol profile on the candle.
3. - had a double event, unusual but should have been safe if waited for the close above the main body of the profile.
got the alerts, waited for the close above the profile, trade with good positon sizing and stop losses.

Kaspa potential cup and handle pattern Kaspa looks like its setting up to make the handle on this pattern soon
lets see how it plays out

KAS with a nice little flag hereKAS with a nice little flag here, i've scaled out quite a bit so might try to get back in here at the top of this 4H OB and high vol candle

A clear rectangle A good setup of a rectangle breakout prepping itself. Waiting for a good long candle close for confirmation. A rejection gets it below with same target.

Kaspa Consolidation ManifestationKaspa consolidation. If Kas goes sideways for 217ish days and does a 2x, then this next move lets pump it to 333% ! www.tradingview.com

KAS is going to pump hardHello Cryptosuppliers,
KAS is making a lot of new improvements on Testnet-11. 10 blocks per second.
They're building and more than a year in the same price range.
The only way is up.
Let's get some profits.

Kaspa's Firestorm Wall📉 Current Price: $0.16 USD
🎯 Medium-Term Target: $0.23
🛡️ Key Support: $0.14 (0.618 Fibonacci golden ratio starting from the Nov 5th election-day pump)
🔥 The Firestorm Wall
KASPA faces a formidable challenge at its "Firestorm Wall" of resistance, spanning $0.17–$0.19. Over the last 185 days, KASPA has entered the bottom of the wall ($0.17) more than 10 times.
However, it has only breached the top ($0.19) 3 times. For KASPA to reach its medium-term target of $0.23, it must decisively break through $0.19. Once this happens, the rally could accelerate. 🚀
📊 Recent Developments:
Volume Uptick:
Momentum has increased after bouncing off both the $0.10 support and the bottom of the diagonal trendline.
Money Flow Index (MFI):
Current Status: Neutral (neither overbought nor oversold).
At the $0.10 support, the MFI showed overbought conditions, indicating a bullish recovery.
Golden Cross:
On November 11th, the 50-day MA crossed above the 200-day MA – a strong bullish signal on the daily chart.
📐 Technical Insights:
Yellow Dashed Lines: Fibonacci retracement levels, key zones for price interaction.
Breaking above $0.19 will clear the Firestorm Wall and likely propel KASPA toward $0.23 quickly.
KASPA is ready to launch. 🚀 All eyes on the $0.19 resistance!

KAS Weekly - $3.5 Long Term These are my targets based on long-term trend line and Fib ratio. Whoever says KAS can't do a 20x from here is kidding themselves

KAS/ USDT SEE LOTS OF BULLISH TONES/ beginner trading adviceMy idea for kaspa theres an obvious falling wedge & cup handle off an S/R zone if you zoom out. Bullish divergences at key fibonnaci .618 about .128 i took the position. got a nice retest off the falling wedge breakout with an inverted h/s and finally changing character locally in the market structure when we hit .153!! My measured move of the falling wedge takes us to the ATH at .208. This doesn't mean that is where we are going. I prioritize positions over predictions while understanding and accepting my risk. I'm long from .10 catching a few knives..with those bloody hands, i took a long from .128 at the golden pocket..would i long now? No. not the breakouts. Would i buy on spot ? Sure. Dont 3get about resistance at .177 ish..Dont 3get to teach others what you know. We all started somewhere and we all learned from someone. Traders think that traders have to be right. The more you think that, the more narrow minded you become. An idea is an idea. Do you think you know the millions of ideas there are? If you do, i'd like to join your community instead! #kaspa #lifers #333 www.tradingview.com

Kaspa coin potential breakout and retest hi guys. this is my next trade on Kaspa coin. potential breakout and retest. I'm expecting a pump from here. i have a tight stoploss just incase this fails.

Kaspa / KAS ( 70X in 9 month )The price of Kaspa (KAS) is $0.011 today with a 24hour trading volume of 5 million dollar. This represents a 30% price increase in the last 24 hours and a 7000% price increase in the past 9 month..wait what?! that's exactly why you should be in crypto and find the next crypto gems.
Kaspa is a proof-of-work cryptocurrency which implements the GHOSTDAG protocol. Unlike traditional blockchains, GHOSTDAG does not orphan blocks created in parallel, rather allows them to coexist and orders them in consensus. Whereby our blockchain is actually a blockDAG; you can see GHOSTDAG in action in a real time blockDAG visualizer). This generalization of Nakamoto consensus allows for secure operation while maintaining very high block rates (currently one block per second, aiming for 10/sec, dreaming of 100/sec) and minuscule confirmation times dominated by internet latency (cf. chapter 6 of the the paper for some initial benchmarks). The Kaspa implementation includes a lot of cool features and subprotocols including Reachability to query the DAG's topology, Block data pruning (with near-future plans for block header pruning), SPV proofs, and later subnetwork support which will make future implementation of layer 2 solutions much easier.
as you see we can have a healthy correction and back to 0.010. if you made a good gain make sure taking some profit too

Kaspa weekly god candle formingThe chart illustrates a potential "god candle" scenario on the weekly timeframe for Kaspa, suggesting a strong bullish momentum. This formation is likely supported by the breakout from a falling wedge pattern, which is typically a bullish reversal pattern.
Key observations:
Falling Wedge Breakout: The breakout from the wedge aligns with increased volume, a confirmation of bullish sentiment.
Target Achievement: It seems that the initial price target post-breakout has already been reached.
Trend Continuation: The steep blue trendline indicates strong upward momentum, hinting at a continuation if current support levels hold.
10 BPS, Binance, Smart Contracts patience is key

Ticker: KAS - Elliot Wave Prediction We are currently in a retracement elliot wave (C) inside the main retracement elliot wave (2). I feel that after we have completed this wave we will enter into the begining of elliot wave (3) where we will experince extremely bullish price action.

KAS/USDT Trade Ideaascending channel is broken out
and after touching previous LH,
price is pullback till 50%,
buy small portion at current price,
further can be accomulate at buy1, buy2,
and buy3. stoploss and final target
are shown in the chart.
Target-1: 0.1886
Target-2: 0.2465
Target-3: 0.3039
