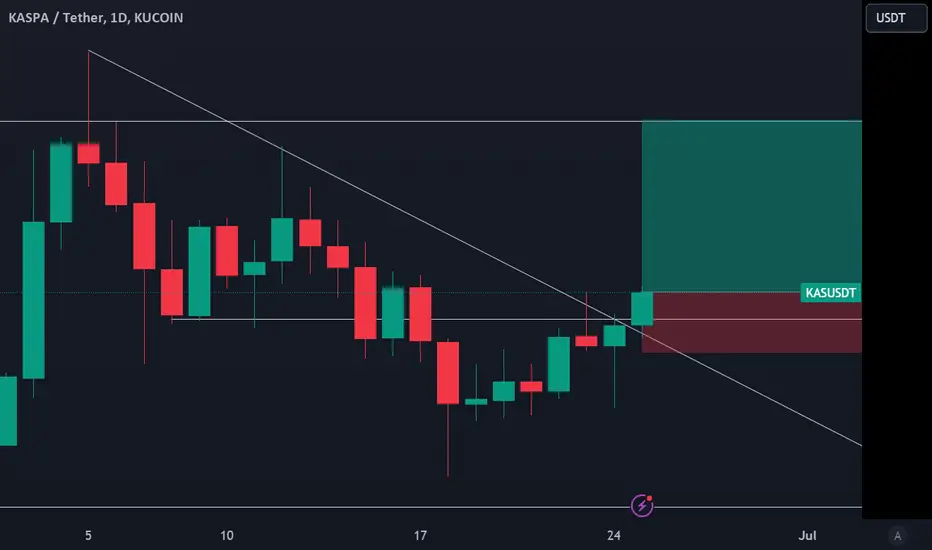
KASPA showing strength and continuing to consolidate to upsideKASPA showing strength and continuing to consolidate to upside
KASUSDT.P trade ideas

buy again at 0.1680I think Kaspa need a little turn down and then go up again...
0.18 is strong rersistance
.... think 0.1680 ( or lower ) would be nice enter

OMG Look A Butterfly...Low Risk High Reward setup here...I've had to spell it out in so many ways I guess...but anyway thar she blows I think.

Doing It Bigly...The time has come for the music to stop for kaspa - Expecting this to enter a long corrective phase...damp it.

KAS Looking Bearish in short termKAS Making double top and bearish divergence in 1hrs, should sell to get short term profit

KASPAdyor - nfa, see previous posts and good luck!
-continuation pattern, loose targets into .25/.30 with pattern target into .55 cents

#KAS/USDT breaks the Diagonal Trendline in 1-Hour TF!#KAS/USDT breaks the Diagonal Trendline in 1-Hour TF!
CRYPTOCAP:KAS looking bullish here. Wait for PWH $0.01619 to successfully retest to long it. #KASUSDT's local resistance level is PWH $0.19175, and the local support level is PMH $0.1443.

KAS: Approaching ResistanceTrade setup : Remain in an Uptrend. It pulled back briefly but made a Higher Low (sign of Uptrend) and broke back above $0.15 key level. Momentum has inflected bullish (MACD Histogram bars are rising). Price is now approaching our near-term target $0.194 for a +25% gain. Now we look for the right entry opportunity in Uptrend. We wait for price to either 1) break above $0.20 to signal continuation of uptrend, or 2) pull back near $0.15 support for another swing trade entry in Uptrend with +25% upside potential back to $0.194.
Pattern : Price is Approaching Resistance , which is a level where it could pause or reverse its recent advance, at least temporarily. Resistance is often a level where price got rejected in the past, or potentially prior Support level that was broken. (concept known as polarity). Once price breaks above resistance, it can advance higher to the next resistance level. Learn to trade key levels in Lesson 7.
Trend : Short-term trend is Strong Up, Medium-term trend is Up and Long-term trend is Strong Up.
Momentum : Price is neither overbought nor oversold currently, based on RSI-14 levels (RSI > 30 and RSI < 70).
Support and Resistance : Nearest Support Zone is $0.15, then $0.13. Nearest Resistance Zone is $0.194, then $0.24.

KAS PriceTraded in the upward trajectory, Kaspa token price persisted in forming the higher high swings and molded the eyes to breach its ATH mark of $0.1826.

Bullish Pattern forming on KasIf the Weekly candle Closes above the last one, this would look excellent for kaspa and its investors.

Kaspa ($KAS) on the Verge of a Breakout? Key Levels to Watch!Kaspa Chart Anaylsis:
The price action shows a potential for an upmove once it breaks out of the resistance level.
Volume is increasing which indicates interest.
Disclaimer: The information provided here is for educational purposes only and does not constitute a buy or sell recommendation. I am not a financial advisor and I reserve the right to be incorrect. Do not make trading decisions based on information from the internet. Always consult your financial advisor or conduct your own research before making any investment decisions.

long KASKaspa broke through the descending trendline and the resistance level. The bullish movement to $0.1842 is expected to happen.
KASKAS on the HTF seems it is doing a similar pattern with the November consolidation below ATH before explosive expansion.
More of a HTF guide than actual trading based on it but helps with spot bags conviction

Kaspa inverted head and shoulder bullish pattern $KASLooking at the KAS chart on the 4 hr tf, there's a potential for an inverse head and shoulders pattern, which usually signals a bullish reversal
Disclaimer: The information provided here is for educational purposes only and does not constitute a buy or sell recommendation. I am not a financial advisor and I reserve the right to be incorrect. Do not make trading decisions based on information from the internet. Always consult your financial advisor or conduct your own research before making any investment decisions.


KAS 8HRI see a very nice short here on KAS. Looking too clear vector zone on the way down into the golden pocket fib, you should lose yearly vwap on the way to the downside

Bullish Pennant Structure seen in KASPA - $KAS The hourly chart shows a bullish pennant structure which is a bullish pattern.
Disclaimer: The information provided here is for educational purposes only and does not constitute a buy or sell recommendation. I am not a financial advisor and I reserve the right to be incorrect. Do not make trading decisions based on information from the internet. Always consult your financial advisor or conduct your own research before making any investment decisions.

Kaspa ThesisThis is not a price prediction its just my thesis for Kaspa, 2 Escenarios: one Bullish and favorable for Investors and another Bearish and not Favorable (Fishy Behavior).
Im Bullish so Far.

KASPA forming distribution , local top???As much as I love kaspa it looks like we are in for a retracement down 50% or more from current levels. id be interested in picking this up under 7 cents.

Technical Analysis of KAS/USDT (4-Hour Chart) #kaspa $kas #usdtTechnical Analysis of KAS/USDT (4-Hour Chart) by Blaž Fabjan
The chart displays a falling wedge pattern, which is typically a bullish formation, indicating a high probability of an upward breakout.
Indicators:
VMC Cipher B Divergences: This indicator shows bullish divergences at multiple points, supporting the possibility of an upward breakout.
RSI (14): Currently at 39.82, indicating the market is somewhat oversold and we may expect price growth.
Stochastic Oscillator (14, 1, 3): Values are 34.88 and 36.88, indicating an oversold condition, often a buy signal.
Recommended Entry Points for Trading:
Intra-Day Trading:
Entry: $0.145 (at the current price or upon a slight dip)
Target Price: $0.155 (first resistance level)
Stop Loss: $0.140 (to protect against significant losses)
Swing Trading:
Entry: $0.145 (at the current price or upon a slight dip)
Target Price: $0.165 - $0.170 (potential breakout from the falling wedge)
Stop Loss: $0.135 (to protect against significant losses)
Recommended Exit Points for Trading:
Intra-Day Trading:
Exit Price: $0.155
Alternative Exit Price: $0.150 (if the market shows signs of weakness)
Swing Trading:
First Target Price: $0.165
Second Target Price: $0.170
Exit Price on Reversal: $0.135 (to protect against significant losses)
Summary:
Based on the technical analysis and applied indicators, the current trend for KAS/USDT is positive, with potential for an upward breakout from the falling wedge. Recommended entry points are at the current price of $0.145 with target prices of $0.155 for intra-day trading and $0.165 - $0.170 for swing trading. Closely monitor the market and use stop loss to protect against unexpected downturns.

Crypto + 3 Step Rocket Booster Strategy - Recap VideoThis is the recap video of the rocket booster strategy now this video i break down to you
how important it is to master technical analysis
and why this strategy is called the rocket booster
--
Also, check out the references below to learn more
--
Disclaimer; Trading is risky please learn risk management strategies because you will lose money

The 3 Step Rocket Booster Strategy In Crypto TradingNow when you look at this chart you can see that the price is at a resistance level
after a double top - this double top is what gives the look to the price chart like a rocket.
Now am going to show you the rocket booster strategy on this chart and it is as follows:
Step 1- The price is above the 50 MA
Step 2- The 50 MA Is Crossed above the 200 MA
Step 3- The price has gapped above the MA's
This is the rocket booster strategy now you need to learn more about market psychology
but this is not what this article is about this article is about
introducing you to technical indicators in order to give you the ability
to analyse trends.
Remember to rocket boost this content to learn more.
Disclaimer: Trading is risky you will lose money wether you like it or not, please learn risk management.

Kaspa Power Law - Ascending TriangleMEXC:KASUSDT is forming an Ascending Triangle on the Daily timeframe.
MA 50 and MA 100 have crossed.
There probably is a nice SELL Order Block on 0.150996 which is resistance.
This could go several ways:
Scenario : A). (Very bullish)
1. We'll retest the Order Block on 0.111402 before a breakout to the Upside.
2. Price will retest both moving averages to give us a clearer picture.
3. If the moving averages reject the price, expect the confirmation of a bullish cross.
4. Wait for a clean signal: IF OB at 0.112341 rejects price and the MA Cross stays positive = the ascending triangle will rip to the upside.
Potential +600%
Scenario: B).
1. If OB at 0.112341 doesn't reverse the downtrend, the Ascending Triangle is breaking to the downside.
2. If the price breaks downwards, expect to retest the OB at 0.094076
Scenario: C). (might be unrealistic but its still crypto, always expect capitulation before bulls)
1. OB at 0.094076 will not be filled, causing further liquidations and downtrends toward the OB at 0.053304 placing it on a whopping -60%
Let me know what you think, I'm personally very bullish on Kaspa and would love to see it ripping. KRC20, new exchange listings on exhanges. I usually expect negative price action before positive one because that's kinda my luck. I'd love to hear your opinion, I can learn more that way.
Thanks for reading! NFA
