Kaspa bullish VibesChart Analysis
This is a daily (1D) candlestick chart for KAS/USDT on the Gate.io exchange, created by "GoonBoyCrypto" as of December 4, 2025.
It covers historical price action from July 2025 onward, with projections extending into early 2026 (up to March). The price scale ranges roughly from 0.0500 to 0.1500 USDT, indicating Kaspa's value has been trading in a low range during this period.
The chart incorporates elements of Smart Money Concepts (SMC), Fibonacci levels, and an Elliott Wave count, along with buy/sell signals and areas of interest.
Here's a breakdown: Key Price Action and Patterns Uptrend Phase (July–August 2025): The chart starts with a bullish move, marked by a green "Buy" signal near a low of ~0.08 USDT. Price rallies to a high of approximately ~0.14 USDT, forming a green-shaded bullish area. This is followed by a pullback to a "HL" (Higher Low), suggesting temporary support.
Downtrend Phase (August–December 2025): After peaking, a red "Sell" signal appears at the top, labelled "LH" (likely Lower High). The trend shifts bearish with a "ChCh" (Change of Character) and "BoS" (Break of Structure), indicating a reversal from bullish to bearish structure. Price declines steadily, with pink-shaded bearish areas and a sharp red downward arrow highlighting a major drop (possibly in November), bottoming out near ~0.04 USDT. A large red candle emphasises this capitulation.
Potential Reversal (December 2025 Onward): At the low, there's another green "Buy" signal and an orange-circled "Area of Interest" (possibly an order block or fair value gap for accumulation). The price forms a bottoming pattern, like a consolidation triangle or wedge, before breaking out upward.
Elliott Wave Projection: The numbered labels (1) through (5) suggest an impulsive bullish wave count starting from the December low:(1): Initial up to ~0.0618 USDT.
(2): Retrace down to ~0.0382 USDT.
(3): Extension up to ~0.0786 USDT.
(4): Pullback to ~0.0236 USDT (this seems aggressive and may indicate a deep correction or a labelling error; it could be a Fib 0.236 retracement level).
(5): Projected upward leg, pointing toward higher levels (potentially ~0.10 USDT or beyond, based on the line's trajectory into 2026).
These levels (0.236, 0.382, 0.618, 0.786) are classic Fibonacci retracement/extension points, likely drawn from the major high-to-low move, guiding the wave targets.
Indicators used feature the "All in One " indicator suite, including RSI, Stochastic (Stoch), MACD, ADX, Veup, and others. Signals are mixed: Bearish Signals: Stoch RSI (Bearish Crossover), MACD (Bearish Crossover), ADX (Bearish Range), Veup STC (Down Trend), DX (Down Trend, Market Dump).
Bullish Signals: SMA 10 (Bullish), SMA 20 (Bullish), SMA 30 (Bullish Others), some RSI variants (e.g., RSI 40 at 36.83, potentially oversold).
Neutral/Other: RSI 14 at 50.3 (neutral), overall suggesting waning bearish momentum but not yet fully bullish. This aligns with a potential reversal if support holds.
The chart creates an optimistic approach, projecting a bullish breakout from the current low, with the wave (5) extending into February–March 2026. However, the mixed indicators highlight risks if the downtrend resumes.
My Prediction Based on the chart's technical setup, Kaspa appears to be at a critical inflexion point after a prolonged downtrend, with signs of exhaustion and a potential bullish reversal. The Elliott Wave count and buy signal at the "Area of Interest" suggest accumulation around 0.04–0.05 USDT, setting up for an impulse higher. If price holds above the recent low (0.0236–0.0382 USDT) and breaks above wave (3) resistance (~0.0786 USDT), it could confirm the uptrend.
Short-Term (Next 1–3 Months, into Q1 2026): Bullish, targeting ~0.06–0.10 USDT (Fib extensions and wave (5) projection). This matches recent sentiment for near-term gains.
Medium-Term (2026): If the reversal holds, potential for 0.20–0.50 USDT, driven by tech upgrades (e.g., ZK, DagKnight, vProgs) and listings.
This aligns with broader predictions of 0.50–0.80 USDT.
Long-Term (2027–2028): Highly bullish if adoption grows (e.g., dApps, RWA integration, high TPS/hashrate). Targets could reach 1–5 USDT or higher, based on power-law growth models and comparisons to other L1s like SOL, BNB & ETH.
Risks include a breakdown below ~0.04 USDT, which could lead to further downside (e.g., 0.02 USDT), especially if Bitcoin weakens or network metrics (e.g., hashrate at 630 PH/s) falter.
Crypto is volatile—this is not financial advice; consider market conditions and DYOR.
I am not an advisor just a Kas Maxi sharing my personal views for fun
Trade ideas

Kaspa road to yearly openI think MEXC:KASUSDT can bounce at least in middle term to yearly open 2025 + the same level its a first big liquidity pool!
On left side you can see pure 3 drives pattern! So congrats everyone who out in 2024 Because when on weekly tf after 11000% gains any asset form this pattern its so rare can move higher! Usually its a bearish sign!
We already sweep sell side liquidity and close first main M fvg! But like usual we have a most possible 2 scenarios!
- Negative we can drop to next m fvg and only after that bounce to yearly open
- Positive hold the line now close W fvg and after small retest going to yearly 2025 open next year!

$KASPA BULLISH MEXC:KASUSDT just tapped into the first order block (0.05430 – 0.05105) and reacted with a bullish push, signaling a potential reversal after the confirmed bullish CHoCH on the daily timeframe. If this reaction holds, price could aim for the upside targets at 0.06373 and 0.08971 as marked on the chart.
This first order block is crucial—holding above it keeps the bullish structure intact. A break below 0.05105 could open the path to the deeper order blocks at 0.04401 – 0.04074 and 0.03860 – 0.03588. Always manage your risk with the stop-loss at 0.04971 in volatile conditions.
For deeper insights and more chart breakdowns, don’t forget to like and comment.

KASPASince the 26th of September, CSE:KAS has not only printed a clear buy signal but has shown remarkable strength. Major resistance will broken, momentum is intact, and all roads are now open toward the $0.08 target.

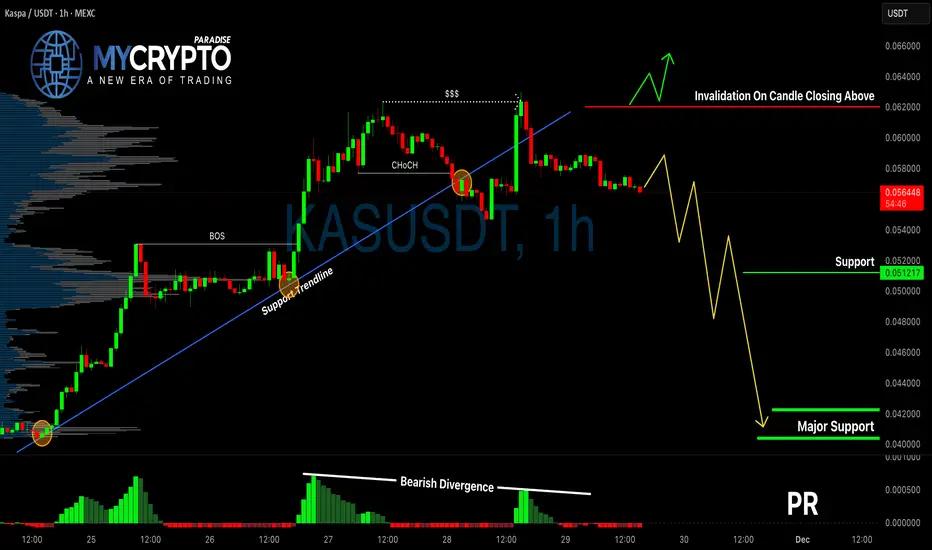
KASUSDT Breakdown Confirmed?Yello Paradisers, have you already positioned yourself on KASUSDT’s bearish move, or are you about to get trapped by a false bounce? The market just gave us a major clue, and ignoring it could cost you.
💎KASUSDT has officially broken below a critical supportive trendline, which was previously holding the structure intact. This breakdown wasn’t random—it came with a clean bearish CHoCH (Change of Character), and the MACD histogram is flashing a clear bearish divergence. These combined signals significantly increase the probability that this is not just a minor pullback, but the beginning of a more aggressive downside move.
💎From the current market level, there is already a straightforward 1:1 risk-reward opportunity on the table. However, if price pulls back toward the previous support (now resistance), that would offer a much better entry zone with improved risk-reward. But don’t jump in blindly—what we want to see at that level is a bearish candlestick confirmation. Without it, you're only guessing. With it, you’re trading with probability on your side.
💎On the flip side, if KASUSDT breaks out and closes decisively above the invalidation level, that would fully invalidate the current bearish thesis. In that case, it’s smarter to stay on the sidelines and wait for a new high-probability setup to form. This market doesn’t reward impulsive decisions—it rewards patience, discipline, and precision.
🎖Strive for consistency, not quick profits. Treat the market as a businessman, not as a gambler.
MyCryptoParadise
iFeel the success🌴
Breaking: Kaspa ($KAS) Surge 20% Today Kaspa ( CSE:KAS ) Surge 17% today amidst Network upgrade boosts.
Kaspa Breaks Through Momentum Wall as Network Confidence Builds
CSE:KAS has pushed up nearly 20% in the last 24 hours, reclaiming the $0.06 zone with surprising strength after several days of tight consolidation. The move seems driven more by conviction: rising liquidity, steady miner participation, and the continued narrative around #Kaspa 's blockDAG throughput advantage are giving it a fundamentally supported lift.
The $0.13 axis is the resistant point CSE:KAS needs to break to cement a move to the $.0.50 pivot. However, failure to break that region will resort to consolidation to the base of the support point.
What Is KASPA (KAS)?
Kaspa is a fast, scalable Layer-1 cryptocurrency built on proof-of-work (PoW) and powered by the GHOSTDAG protocol — a novel consensus mechanism that extends Nakamoto’s original design. Unlike traditional blockchains that discard competing blocks, GHOSTDAG allows parallel blocks to coexist and orders them within a Directed Acyclic Graph (blockDAG), enabling high throughput while preserving decentralization and security. Kaspa currently processes 10 blocks per second, with a long-term goal of scaling to 100 blocks per second, offering confirmation times limited only by internet latency.
Kaspa Price Data
The Kaspa price today is $0.059932 USD with a 24-hour trading volume of $122,411,751 USD. Kaspa is up 15.10% in the last 24 hours. The current CoinMarketCap ranking is #47, with a market cap of $1,615,781,305 USD. It has a circulating supply of 26,960,329,287 KAS coins and a max. supply of 28,704,026,601 KAS coins.

KAS / USDT (1D Timeframe)Pattern: Bearish Downtrend Retracement Into Major Supply Zone + Downside Continuation Setup
The chart shows Kaspa (KAS) pulling back into a high-probability supply zone after a strong downtrend.
Despite a sharp relief rally, market structure remains bearish with repeated Breaks of Structure (BOS).
Price is now reacting inside a major supply block, which historically generated aggressive sell-side displacement.
Key Observations:
🔹 Strong Downtrend:
KAS has been consistently forming lower highs and lower lows, confirming a clean and well-respected bearish trend.
🔹 Multiple BOS Confirming Bearish Structure:
Each upward correction has been followed by another BOS to the downside, showing seller dominance throughout the trend.
🔹 Major Supply Zone ($0.05474–$0.05226):
Price is currently tapping a well-defined supply zone — the origin of a previous strong sell-off. This area is likely to attract fresh sell orders from smart money.
🔹 Sharp Retracement Rally:
The green impulse shows a fast corrective move, but this is typical in downtrends before the next leg down begins.
🔹 Projected Bearish Path:
The dotted arrows indicate the expected downside continuation, with price possibly forming lower-high structures before breaking down further.
🔹 Target Levels Identified:
Two clear downside targets are marked based on previous reaction points and liquidity sweeps.
Potential Move:
If KAS rejects from the supply zone ($0.05474–$0.05226):
🎯 Target One: $0.04605
(The first liquidity pocket and prior reaction zone)
🎯 Target Two: $0.03667
(The deeper continuation level aligning with the overall trend projection)
A daily close above $0.05480 would weaken the bearish continuation thesis and signal that buyers may be attempting a structural shift.
Summary:
Kaspa is firmly trending downward, and the recent pump into the daily supply zone provides an ideal rejection area for continuation.
Market structure, BOS levels, and historical sell-off zones all support the bearish narrative.
If sellers defend this supply area, KAS could resume the downtrend toward $0.046 and potentially $0.036.
Only a strong breakout above the supply zone would invalidate this bearish setup and hint at a possible reversal.

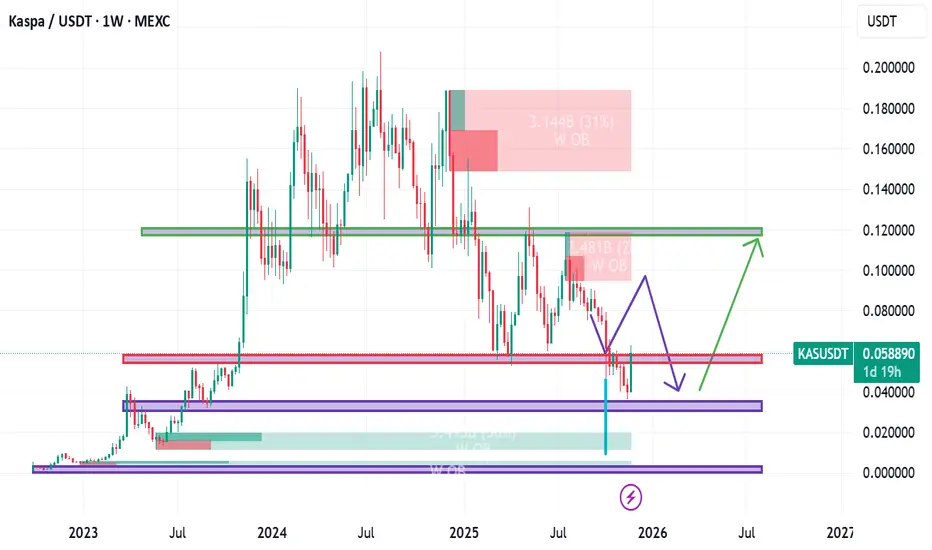
#KASPA - $KAS 2026 Long Term Forecasting.Here’s a detailed analysis of the chart for Kaspa (KAS/USDT) and its potential outlook for 2026:
1. Current Price & Trend
Current Price: Around $0.0586.
Recent Movement: The price has dropped sharply (around -22%) and is near a strong support zone.
Timeframe: Weekly chart (1W), so each candle represents one week.
2. Key Support & Resistance Zones
Support Zones:
$0.040 – $0.045 (purple zone): Strong historical support; price bounced here before.
$0.010 – $0.025 (lower purple zone): Major long-term support if the first zone fails.
Resistance Zones:
$0.10 – $0.12 (green zone): Significant resistance; price struggled to break this level previously.
$0.18 – $0.20 (upper level): Previous high and major supply zone.
3. Projected Scenarios for 2026
Bullish Scenario (Green Arrow):
Price holds above $0.04 and breaks $0.10 resistance.
Target: $0.12 – $0.18 by mid-to-late 2026.
Requires strong market sentiment and volume.
Bearish Scenario (Purple Arrow):
Price fails to hold $0.04 support and drops toward $0.02.
Could happen if overall crypto market weakens or Kaspa loses momentum.
4. Indicators & Patterns
Order Blocks: Red zones indicate previous supply areas where sellers dominated.
Trend: Currently in a downtrend but near a critical support zone.
Volume: Not shown here, but likely declining during the drop.
✅ Updated Bullish Analysis for 2026
Current Situation:
Price is around $0.058, very close to the strong support zone at $0.04–$0.05.
Historically, this zone acted as a major accumulation area, so the downside risk is limited unless the market collapses.
Why It’s Likely to Rebound:
Bottom Formation: Price has already retraced significantly from highs ($0.18), suggesting sellers are exhausted.
Positive News: Strong fundamentals and project updates will attract buyers.
Market Cycle: If Bitcoin enters a bull run in 2026, altcoins like Kaspa typically surge.
✅ Summary:
Key level to watch: $0.04 support.
If it holds → potential recovery toward $0.10–$0.12.
If it breaks → risk of drop to $0.02.
KAS Update
🚨📊 KAS Update
KAS is approaching an important resistance zone 🔴,
but sellers are not in control this time.
Price is moving upward with strength,
and this next red zone will be the key level to watch.
KAS must break out above this resistance
to show a clean continuation toward higher targets.
Until that breakout happens,
price may face some slowdown at the resistance area.

KASPA Update🚨📊 KASPA Update
KASPA buyers are testing the red resistance zone again 🔴
after getting rejected many times before.
This level has acted as a strong ceiling,
but now price is pushing into it with momentum,
so a possible breakout this time is on the table
if buyers continue to apply pressure.

KASPA: $0.05 | Looks like KADENA recent flash crash showed no stabilization fund
and float is not under the custody of Community Admin
as it was suppose to maintain sanity of core investors
this is looks like about to drop below recent lows
those whos bids were served are so LUCKY with current gains
those who missed it can be an opportunity again

Kaspa $KAS bullish 21 EMA breakout on the 4hrly chart.CRYPTO:KASUSD #Kaspa breaking out on the 4hrly above the dashed-white resistance line as well as the red 21 EMA.
Waiting for current candle close above the red 21 EMA for confirmation.
Continuing to DCA during the fear and uncertainty (US-Gov Shutdown, PRC +100% Tarifs, QE looming, etc.) to accumulate in anticipation of FUD eventually being resolved.
Managed to buy a lot more CRYPTO:KASUSD with CRYPTOCAP:BTC at ca. 3 cents and still DCAing atm. Got caught off guard by the +100% PRC tariff triggered mass liquidation induced dump. But only the price has changed, fundamentals kept on improving.
If 10 cents was a good buy. 3 cents and now 5 cents+ is a way better accumulation level, while the market remains fearful and bleeding red.
FusionGap Histogram has also flipped bullish on the 3hrly (an early signal to the 4hrly if price holds above 21 EMA).

KASPA can go much HIGHERAccording to the All time high at $0.19 there is a trendline for 5th wave and that could top out about $0.44 for KASPA

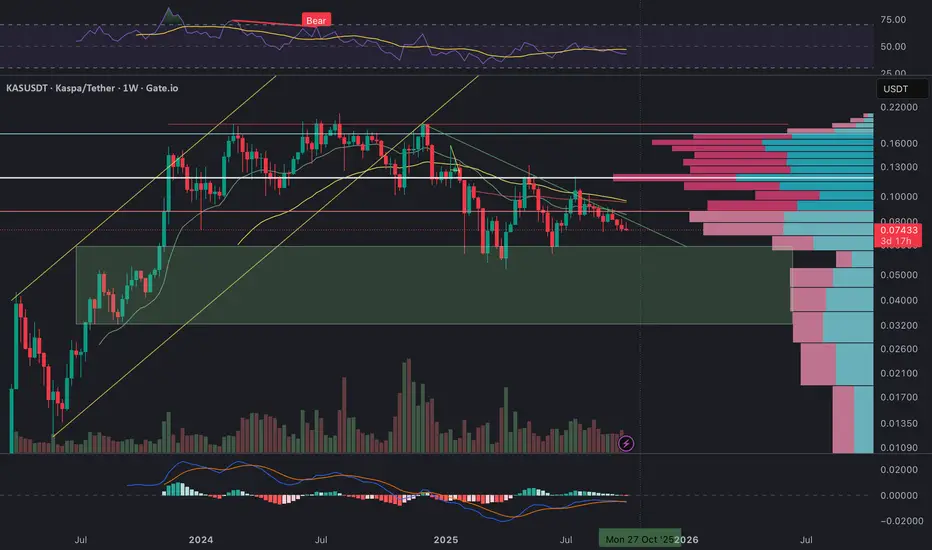
𐤊 $KAS KASPA Weekly Outlook: Testing the Final Line of DefenseKaspa has been consolidating for several months, drifting steadily lower within a well-defined descending channel after breaking down from the 2024 uptrend. Price is now hovering around a crucial support zone between 0.073 and 0.070 USDT, which also coincides with the lower boundary of the major demand region (highlighted in green).
From a structural point of view, KAS remains in a macro corrective phase. Momentum indicators are showing signs of exhaustion on the downside – the RSI is hovering near the 40 level and flattening out, while MACD has started to compress with a potential bullish crossover forming if buyers step in this week.
The Volume Profile clearly shows heavy supply between 0.10 – 0.12 USDT, marking this zone as the key resistance cluster that must be reclaimed to confirm any trend reversal. Until then, rallies into 0.081 – 0.085 are likely to face selling pressure.
Technically, this area around 0.074 USDT represents the “final line of defense” before a deeper retest toward 0.06 – 0.055 (the next historical demand pocket). However, if bulls manage to defend this support and push price back above the descending trendline and the 0.0815 zone, a medium-term reversal toward 0.095 – 0.10 could develop.
In short:
• Trend: Still bearish but approaching exhaustion
• Key Support: 0.073 – 0.070
• Immediate Resistance: 0.0815, then 0.090 – 0.095
• Macro Target (if breakout): 0.10 – 0.12
• Breakdown Target: 0.060 – 0.055
Volume and structure suggest we are near a make-or-break zone. A weekly close below 0.073 would confirm continuation of the downtrend, while a rebound above 0.081 could be the first real signal of accumulation before the next bullish leg.
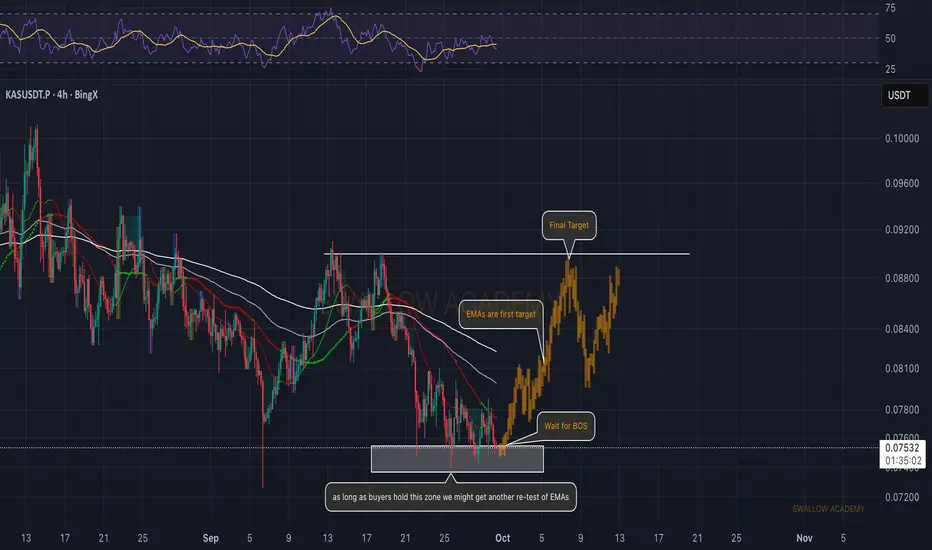
Kaspa (KAS): Expecting Bounce From Current Support ZoneKAS is holding its current support zone well, giving buyers a chance to defend structure. As long as this area doesn’t break, we could see another push into the EMAs, which stand as the first target. From there, a successful break of structure will be the key step for continuation toward higher levels, with the final target sitting at $0.092.
Swallow Academy
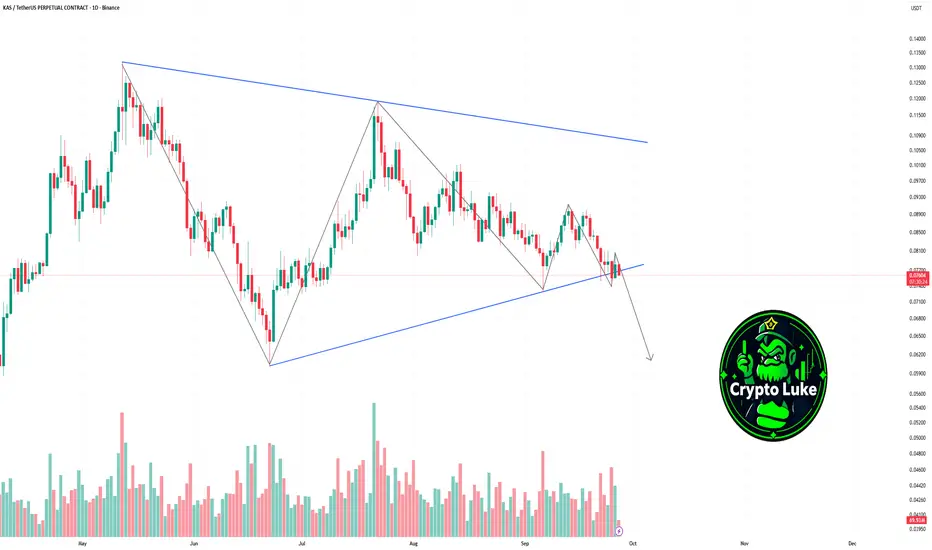
Kaspa is breaking down the triangle!Hi Traders, Kaspa is testing the ascending trendline and looks ready to break down. A confirmed close below this level could trigger further downside continuation.
Kas long to $0.08970 areaJust opened a long position on Kas. Aiming for $0.089571
sl: 0.086340
Time sensitive

Kaspa (KAS): Looking For Buy Entry After 200EMAKAS is holding the ascending support trendline while pressing against the EMAs. Buyers are building momentum and we are looking for a full-scale breakout from here. If confirmed, the next target sits around 0.16.
Swallow Academy

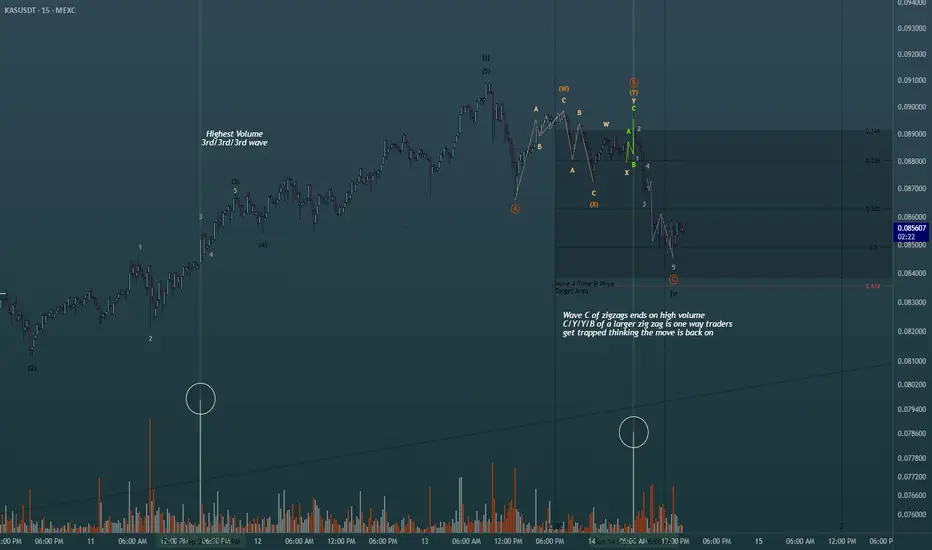
Using simple volume for added confluence in Elliott Wave Theory!Shown on the chart is 2 of the ways you can use the highest volume spikes on the chart to find out where you are in the wave count. Easiest way is to find the highest volume with the steepest slope of trend to label as your third wave. Same concept whether its bearish bars printing or bullish bars. The highest volume shown is actually part of the retracement, albeit in one of the actionary waves (moving with trend), alot of buying happened at the termination of the wave C of the zig zag shown in green. Perfect scenario to rake in buy orders from retail then dump on them to finish out the WXY pattern. This is just 2 of the many scenarios in which you can find help from the volume oscillator to give you a directional bias in Elliott Waves. Happy Trading
KAS Market Update📊 CSE:KAS Market Update
Two potential entry / re-entry zones:
👉 First around $0.083927 🟢
👉 Second deeper entry around $0.077555 🟢
⚡ Wait for confirmation — both levels could offer strong bounce setups 🚀
⚡ Trade smarter, not hope 🔑

KASUSDT.P LONGLet the price move toward our entry price.
I hoping the price will take the liquidity and than go up.
Lets wait and watch how price react at our levels.
Always take 50% profit at our 50% level and than bring the s.l to the entry price.
Keep supporting guys keep following me.

Kas Long & ShortLong based on strong support and accumulation zone
Short based on possible Bat Harmonic Pattern

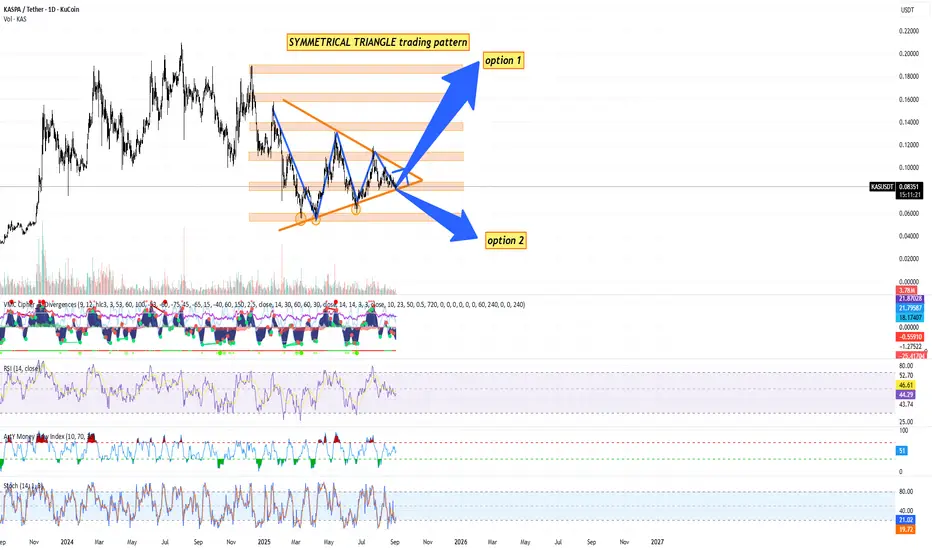
KASPA / USDT DAILY CHART KUCOIN - TA + TRADE PLANTechnical Analysis (Daily Timeframe) by Blaž Fabjan
Chart Pattern
The price is consolidating within a Symmetrical Triangle pattern.
This is a neutral continuation pattern – it signals that a major breakout (either upward or downward) is approaching as the apex is nearing.
Both higher lows and lower highs confirm the formation.
Key Support & Resistance Levels
Immediate support zone: $0.080 – $0.082
Strong support below: $0.070
Immediate resistance: $0.095 – $0.100
Major resistances above: $0.120, $0.140, $0.160, $0.200, $0.220
Indicators
Volume: Declining within the triangle – typical before a breakout.
RSI (14): ~46 → Neutral, no overbought/oversold signals.
Stochastic RSI: Oversold (~20), suggesting possible short-term upside bounce.
MFI (Money Flow Index): Neutral (~51), showing balanced inflows/outflows.
MACD/VM indicator: Bearish momentum has slowed, histogram flattening.
Scenarios
Option 1 (Bullish breakout): If KAS breaks above the $0.095–$0.100 zone with volume, next targets are $0.120 → $0.140 → $0.160 → $0.200+.
Option 2 (Bearish breakdown): If KAS loses $0.080, potential retest of $0.070 → $0.060 support levels.
Trading Plan for KAS/USDT
🔹 Short-Term Swing Trade (1–4 weeks)
Entry Zone (Buy):
Aggressive: $0.082 – $0.085 (current support area).
Conservative: On confirmed breakout above $0.095 with volume.
Stop Loss:
Below $0.078 (tight stop) OR below $0.070 (safe stop).
Take Profit Targets:
$0.100 (first resistance, partial TP)
$0.120 (main target)
$0.140 (strong resistance)
🔹 Medium-Term Position Trade (1–3 months)
Entry Strategy: Accumulate in the $0.080–$0.085 range.
Stop Loss: Below $0.070 (close daily candle confirmation).
Targets:
Base case: $0.160
Optimistic case: $0.200 – $0.220
🔹 Risk Management
Risk per trade: 1–2% of portfolio.
Position sizing according to stop-loss distance.
Avoid over-leveraging; triangle breakouts can produce false moves before direction confirms.
Kaspa is entering the decision zone – the symmetrical triangle is compressing, and a major breakout is imminent in coming weeks.
Momentum indicators show neutrality, giving equal probability for either breakout direction.
The safest approach is to wait for breakout confirmation (daily close above $0.095 or below $0.080 with volume).
If bullish, Kaspa could target +40–100% upside over the next quarter. If bearish, downside risk is -20–30%.
Recommendation:
For conservative traders → wait for breakout confirmation.
For aggressive traders → accumulate around support ($0.082–$0.085) with tight stop-loss below $0.078 and scale out profits at resistance levels.