KAVABTC trade ideas
KAVA/BTCKava testing the top of the ascending channel. In confluence with the bottom of the falling wedge. Message me for more deets.

KAVABTC - Long - Potential 17.69%KAVABTC - Long - Potential 17.69%
Entry - 32843
TP1- 37027
TP2 - 38701
SL- 30473
Please comment with thoughts and how you get on.
If you like the idea, then hit like on the idea & support with a follow.
Good luck out there!
KAVA/BTCAfter mega pumps, its time for healthy pullback. As it got rejected at the daily resistance, I look to buy at the next daily support ~28K sats. Keep buying the hyped Defi coins till the market structure broke.
Note: If you like the content and the setup, please give me a follow not to miss out on many altcoins charts to come.

KAVA about to PUMPmacd showing signs of reversal/uptrend continuation.
touched and tested resistance now turned support levels of the last impulse climb.

DeFi - KAVA is the GEM #3Hello, this is the 3rd coin I am about to enter soon. I just would like to see it closeing above the 21 moving average and above the red area that identifies the retracement area.
The reason I like this coin is simple. It is an lternative to Compound (we talked aboutit in the linked idea) and to many other similar projects because it is run on its own blockchan. The price skyrocketed and all just by providing BNB (binance coin) lending and borrowing to the users. When BTC and USDT borroiwing/lending will be announced as available (soon), it can be a real crack for Kava.
Let me know what you think about this project and if I am missing something!
Also, let me know if this format on DeFi is interesing for you

KAVA/BTC: BINANCE🛒 Pair: KAVA / BTC 🛒
⏰ 1399/06/05 ⏰
🕰 26/08/2020 🕰
Duration:
📈 SCALP - SHORT 📈
Ex: Binance
🛒 Buy: 0.000352 - 0.000360 🛒
👉Sell Targets👈
🎯TP1: 0.00038 🥉
🎯TP2: *DM ME*🥈
🎯TP3: *DM ME*🥇
🎯TP4: *DM ME*🏆
🎯TP5: *DM ME* 🚁
⛔️ SL : 0.0003325 ⛔️

Waiting close above 35886KAVABTC needs to close above 35886 on 8h chart to start new wave. Targets are 39161 and 40220 according to Istanbul indicator.
The above references an opinion and is for information purposes only. It is not intended to be investment advice.

KAVABTCI will wait till the price hit something around 0,000345 and than buy.(if you something wrong please correct me)


KAVABTC - Bearish patternKAVA is showing us a bearish pattern. Supports are drawn, which equals the flag pole in length.

KAVA.BTC (Y20.P3.E4).Cup and HandleHi All,
*** This is a component of the previous KAVA.BTC post > Link below ***
Hence supporting my thesis that this coin is in its early phases of doing a Parabolic run.
The chart tells its all.
Note, it did well with the btc dominance bounce and likely to keep doing so.
How to trade this?
2 options to consider:
a) You can wait for the 6 hrly candle to close before jumping in
b) Look for the retest of the support line
Its possible both will be covered in the 6 or 8 hrly window.
Please give me a tick or like for this post.
Enjoy!
Regards,
S.Sari
PREVIOUS POST

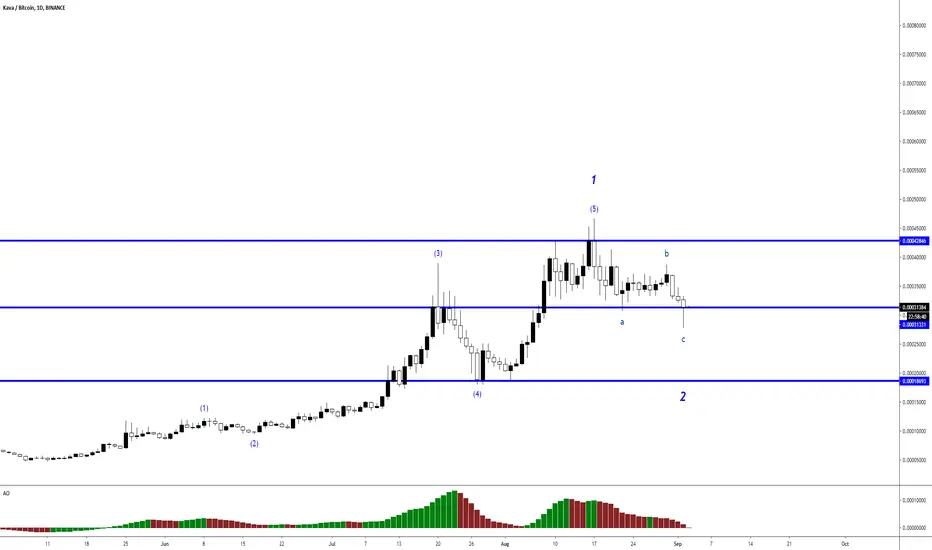
KAVA.btc At or Near a Top? Golden Fib at possible wave EndPointKAVA along with DeFi in general has exploded, as you know.
The growth rate fits a picture perfect " Golden Growth " rate.
We never know where top will be, but this is a good spot for it.
Golden Fib ratios are explained on the chart.
9.471 is one of the common wave EndPoints.
11.089 is next most common, 10.089 at times.
Elliot wave theory also fits the structure nicely.
Wave 3 fast and furious, wave 4 sharp and deep.
We now look to be in wave 5 and near completion.
Of course, this beast could just blow past everything.
But my strategy is to sell some/most at such points.
Then place limit buys at supports below to buy back.
.
"Book" detailing my Methodology with Numerous Examples:
Chapter 1: Introduction and numerous Examples
Chapter 2: Detailed views and Wave Analysis
Chapter 3: The Dreaded 9.618: Murderer of Moves
Chapter 4: Impulse Redux: Return to Birth place
Chapter 5: Golden Growth: Parabolic Expansions
Chapter 6: Give me a ping Vasili: one Ping only
.


KAVA.BTC (Y20.P3.E3).Gems in the making.No.3Hi All,
This post is part of a series of posts that I have started with parabolic curve signs and hence the title association Gems in the making.No.x
<<< Note: This title is associated with all parabolic curve charts or likely to be as per yesterdays post on LEND.BTC >>>
KAVA is part of the DeFi group and looking at the overall view so far, chart below, we can see how its progressed.
If you refer to my previous post on LEND.BTC, I touch on the points of Base1, Base2, Base3 and Base 4 to then extend beyond the Arc to complete the cycle.
LINK.BTC is doing this right now. Refer to link supplied below for further background information.
OBSERVATIONS:
========================
> It is early stages but what I have quickly learnt about parabolic curves is that they move away from the channel path aggressively, just like Kava btc pairing now;
> Current price action is below another FIB. extension target and is consolidating into what seems a ascending triangle;
> The daily Phoeix supports the thesis that it will go sideways for now with slight downward pressure; Green RSI crossing over Red RSI with gray pressure moving upwards, meaning sideways action.
> The Phoeix outlook on the 3 day and onwards is all upwards pressure;
> Daily chart, the 21, 34 and 50 EMA from the price action, demonstrating aggressive movements;
> Daily Macd looking for a bounce off the signal line;
THOUGHTS:
> If the current price breaks this level in the coming week, it will give us the arc we are looking for, hence confirming the parabolic curve;
> How to trade this > go long and go to the smaller time frames be it 4 or 8 hourly chart and enter as the chart below.
Otherwise wait for the breakout and retest of this resistance line (place order there), but you risk missing out.
Please dont forget give me a like or tick for this post as I would like to see my charts not only succeed but also get more exposure out there.
Regards
S.Sari
Macro overview:
Daily chart:
Note the 21, 34 and 50 EMA from the price action, demonstrating aggressive movements
Entry level, if you haven't bought yet

KAVABTC Cup and HandleExpecting KAVA to have a slight pull back, finish completing the cup and handle, while bitcoin shakes people out of alts, settling the RSI, then retaking trend.
I expect KAVA to set new highs in the next week or so.

KAVA bull pennant breakoutThe title says it all. Bullish pennant breakout. Currently in price discovery mode. Next potential resistance zone should be around 51800 sats, based on Fibonacci retracement alone. Stop-loss should be placed at 34200 sats.

Parabolic moves coming?We are in a ascending channel on kavabtc/mkrbtc ratio. if kava keeps on the pace it is right now, kava will grow in price around 80% against Makerdao in a matter of days.
Its taking less and less time for kava to make moves up. This means at least 7$ kava in a week or less.
Parabolic moves coming for kava even before coinbase listing?

KAVABTC – Adam and Eve 🦐According to Thomas Bulkowski's Encyclopedia Of Chart Patterns, the Adam and Eve formation is characterized by a sharp and deep first bottom on high volume (Adam). The stock bounces and develops a more gentle correction, printing a second bottom (Eve) on lower volatility. Eve's rounded bottom takes longer to develop than the Adam spike and it is characterized by lower volumes. Price action congests into a tight range and the stock then breaks to the upside. The top of Eve marks an excellent entry point when broken. The resistance is often located along the top of the center retracement pivot. Sometimes they occur at the end of parabolic rallies. The opposite is true when the Adam and Eve formation identifies a top. Risk must be managed very carefully. Sometimes you might conclude that a bottom has been reached, only to discover that it's a breakout to new lows. Further, stop-losses must be applied with discipline. Don't stick around too long; the failure of this pattern will gain downside momentum quickly. Entry is not easy from the psychological perspective, because sentiment will be negative during this type of market action and volatility will be high. The potential for short-term profits is high, because the reversal, when successful, is explosive.

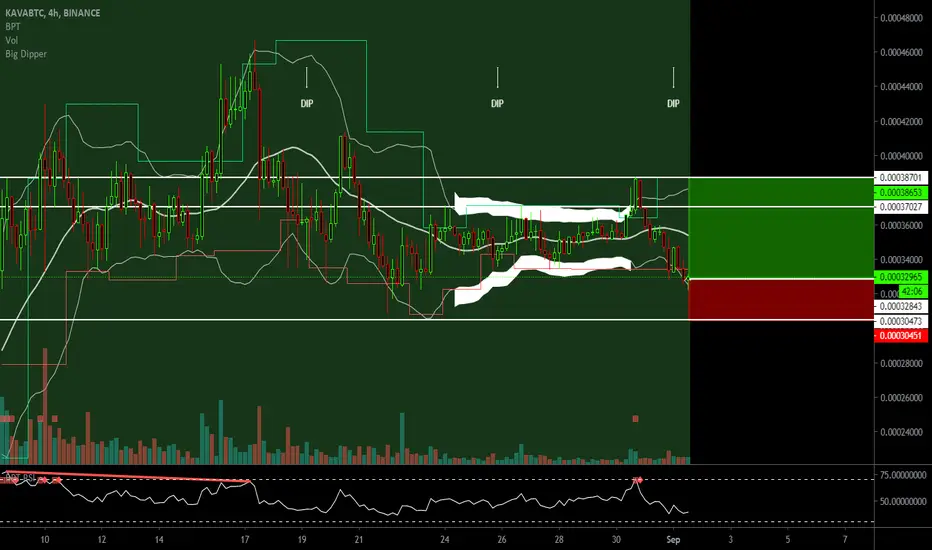
KAVA 4hr Chart Breakout - KAVABTC KAVAUSD KAVAUSDT KAVA ALT COINKAVA 4hr Chart Breakout - KAVABTC KAVAUSD KAVAUSDT KAVA ALT COIN

