KAVA ANALYSIS📊 #KAVA Analysis
✅There is a formation of Descending triangle pattern on daily chart 🧐
Pattern signals potential bullish movement incoming after a breakout.
👀Current Price: $0.4280
🚀 Target Price: $0.5380
⚡️What to do ?
👀Keep an eye on #KAVA price action and volume. We can trade according t

Kava potential Reversal and Target ProjectionKAVA is forming a potential bullish reversal after completing Wave 5 within a descending channel, reaching the External Demand Zone. A rally from current levels is anticipated, with initial support at the Immediate Resistance Level.
The setup targets a short-term move to 1.10, then mid-term at 2.2

KAVAUSDT UPDATEPattern: Falling Wedge Breakout
Current Price: $0.4567
Target Price: $0.74
Target % Gain: 60.53%
Technical Analysis: KAVA has broken out of a long-term falling wedge on the 1D chart, with strong bullish momentum and price closing above the trendline resistance. This breakout signals potential co

Trading opportunity for KAVAUSDTBased on technical factors there is a Sell position in :
📊 KAVAUSDT
🔴 Sell Now
🪫Stop loss 0.4315
🔋Target 0.3300
📏 R/R 2
💸RISK : 1%
We hope it is profitable for you ❤️
Please support our activity with your likes👍 and comments📝

KAVA / USDT - Turning TablesEvening friends,
I've been keeping an eye on Kava, and if the market doesn't shit the bed we might be looking into big gains coming up the next couple of weeks.
Always do your own research, but I do like this coin as it has got good fundamentals.
Trade thirsty!

KAVA uptrend 20261. Technical Overview:
The chart follows the Elliott Wave pattern. It appears that a large ABC corrective wave has completed, and a new 5-wave impulse cycle (1-2-3-4-5) is starting.
Price has likely bottomed around the $0.5 zone and is showing strong signs of reversal, breaking out from a long accu

#KAVAUSDT (red line )The chart is attractive and
will become more attractive when
it breaks the strong red resistance line and consolidates.
So for now we will wait for the break and watch.

KAVABINANCE:KAVAUSDT
KAVA / USDT
1D time frame ( wait for the price to come to buying zone)
analysis tools
____________
SMC
FVG
Trend lines
Fibonacci
Support & resistance
MACD Cross
EMA Cross
______________________________________________________________
Golden Advices.
********************
* Plea

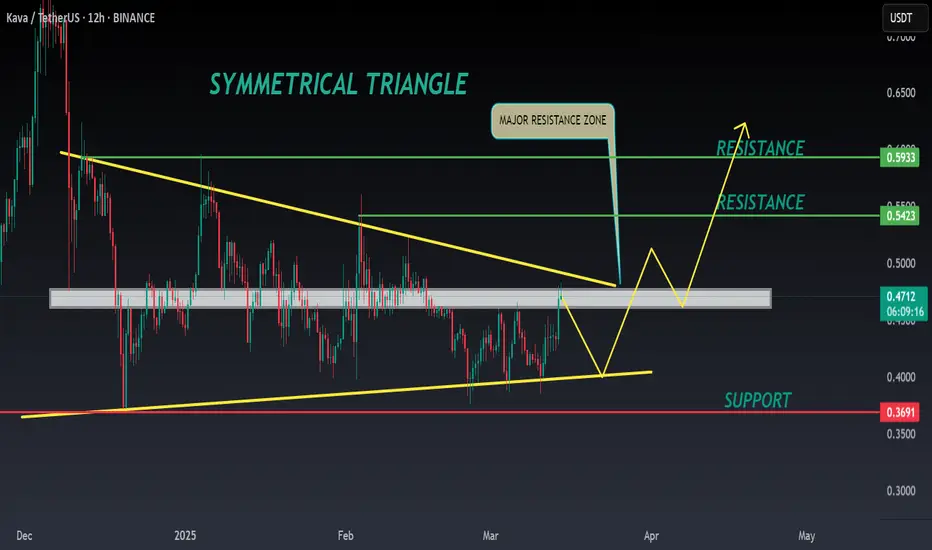
KAVA ANALYSIS🔮 #KAVA Analysis
💲💲 #KAVA is trading in a Symmetrical Triangle Pattern. If the price of #KAVA breaks and sustain the higher price then will see a pump. Also there is an instant strong support zone. We may see a retest towards the support zone first and then a reversal📈
⁉️ What to do?
- We have m
KAVAUSDT UPDATEKAVAUSDT is a cryptocurrency trading at $0.4711. Its target price is $0.7500, indicating a potential 70%+ gain. The pattern is a Bullish Falling Wedge, a reversal pattern signaling a trend change. This pattern suggests the downward trend may be ending. A breakout from the wedge could lead to a stron

See all ideas
Summarizing what the indicators are suggesting.
Oscillators
Neutral
SellBuy
Strong sellStrong buy
Strong sellSellNeutralBuyStrong buy
Oscillators
Neutral
SellBuy
Strong sellStrong buy
Strong sellSellNeutralBuyStrong buy
Summary
Neutral
SellBuy
Strong sellStrong buy
Strong sellSellNeutralBuyStrong buy
Summary
Neutral
SellBuy
Strong sellStrong buy
Strong sellSellNeutralBuyStrong buy
Summary
Neutral
SellBuy
Strong sellStrong buy
Strong sellSellNeutralBuyStrong buy
Moving Averages
Neutral
SellBuy
Strong sellStrong buy
Strong sellSellNeutralBuyStrong buy
Moving Averages
Neutral
SellBuy
Strong sellStrong buy
Strong sellSellNeutralBuyStrong buy
Displays a symbol's price movements over previous years to identify recurring trends.