Analyzing Short Opportunities in KAVAGreetings, Traders,
Today, I present an in-depth analysis of KAVA, a prominent asset within the decentralized finance (DeFi) platform. This platform offers loans to its users without intermediaries and has thus become a notable entity within the cryptocurrency market. Currently, KAVA's price stands at 1.089.
Technical Analysis
On closer inspection of KAVA's current state, numerous technical indicators suggest that it might be an appropriate time to consider short positions. Here is a detailed dissection of the relevant technical factors:
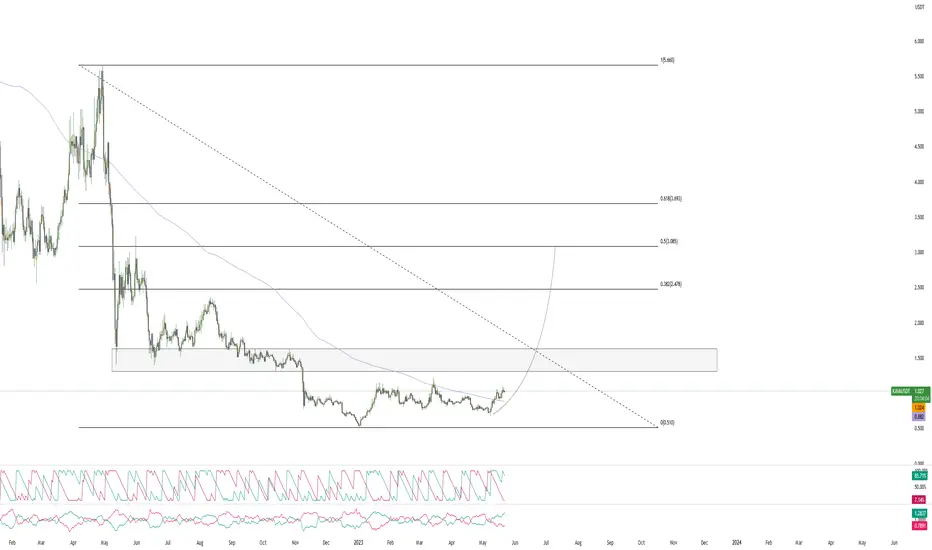
RSI & Stochastic Oscillators: The Relative Strength Index (RSI) currently stands at 69, nearing the traditional overbought threshold of 70. In parallel, the stochastic oscillator is high at 92. These are both significant signals of potentially overbought conditions, frequently leading to a market correction.
Bollinger Bands: The asset's current price is nearing the upper Bollinger Band, placed at 1.116. This closeness often signifies overvaluation and potential reversion to the mean, providing a price correction signal.
Volume Oscillator: The volume oscillator value is -4%, indicating a higher downward volume compared to the upward volume. This pattern can be perceived as a bearish sign in certain market conditions.
MACD: The Moving Average Convergence Divergence (MACD) value currently stands at 0.057. While it's not distinctly bearish, it necessitates close monitoring for a potential bearish crossover.
Fibonacci Levels: The Fibonacci retracement levels also merit attention. On the daily timeframe, the 0.5 level stands at 0.859 and the 1 level at 0.667. These levels could potentially act as support in the event of a price decline.
Key Resistance Levels
It's crucial to highlight KAVA's significant resistance levels. The asset has a local resistance level of 1.171 and a substantial resistance level of 1.347. These resistance points may act as a price ceiling and provide excellent opportunities for short positions. The convergence of the overbought indicators and these resistance levels present the potential for short positions with a favorable risk/reward ratio.
Conclusion
Considering these indicators, both the local resistance of 1.171 and the solid resistance of 1.347 seem to be probable regions for initiating short positions. However, it's important to note that trading requires meticulous planning and risk management. It is essential to conduct independent research and consider personal risk tolerance before entering any trades.
I will continue monitoring KAVA and provide updates on significant changes in its market behavior. Until then, let's maintain a diligent watch on this asset and observe how the market scenario unfolds.
Wishing you successful trading.
KAVAUSDT trade ideas

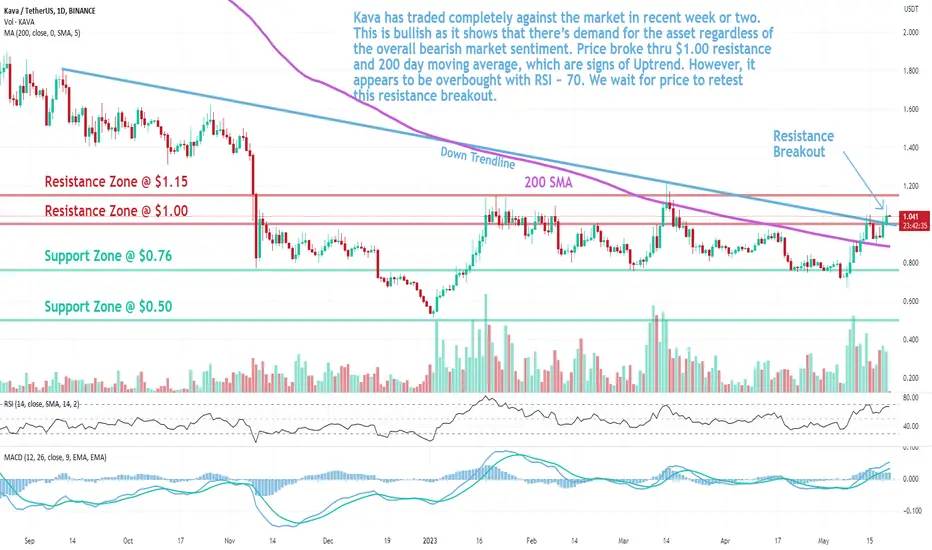
KAVA: Resistance BreakoutKava (KAVA) technical analysis:
Trade setup : Kava has traded completely against the market in recent week or two. This is bullish as it shows that there’s demand for the asset regardless of the overall bearish market sentiment. Price broke thru $1.00 resistance and 200 day moving average, which are signs of Uptrend. Upside potential to $1.15.
Trend : Uptrend on Short- and Medium-Term basis and Downtrend on Long-Term basis.
Momentum is Bullish (MACD Line is above MACD Signal Line and RSI is above 55).
Support and Resistance : Nearest Support Zone is $0.76, then $0.50. The nearest Resistance Zone is $1.00, which it broke, then $1.15, and $1.40.

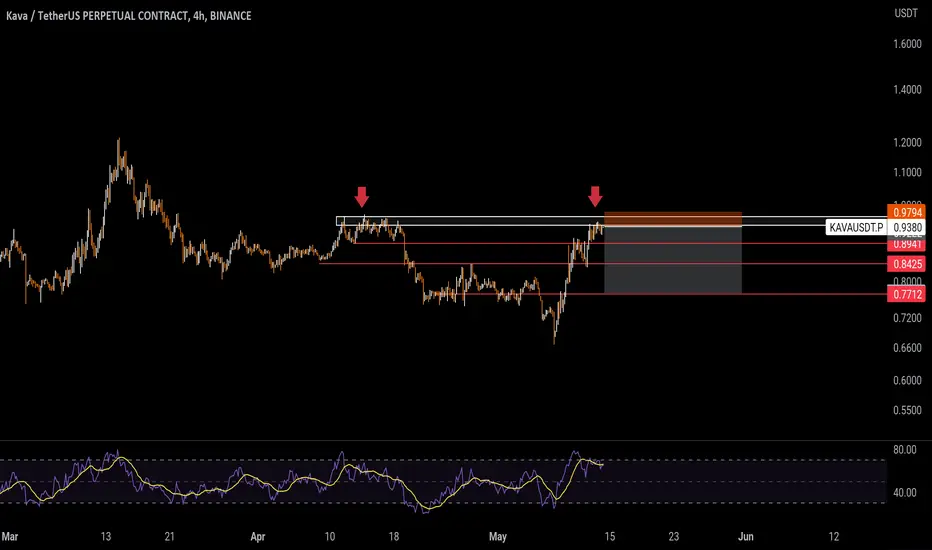
KAVAUSDT.P Strong Rejection + Butterfly (Short) 5/21/2023- complete bearish butterfly (2.618 max)
- shadow/tail (strong rejection wick) has appeared and can be used as an AOV
- low bullish volume
- MACD cross
- take profit in FVG above OB (OB was tested once and supported well)

KAVA cup with handle patterni found cup and handle pattern on CRYPTOCAP:KAVA chart. Open long after breakout

KAVAUSDT LONGThis can happen at some point .. i mean $3 is possible so tighten your sit belt. or give me a reason why you think otherwise in the comment section.
My opinion on Kava/usdt from 21.05.2023As for me, now price may go to 0,83-0,78. There I will take long position. I think that price will go to 2,5

KAVAUSDT.P Liquidity Grab + Complete Gartley + FVG + OB (Short)- complete Gartley formed with 0.618 X-A measurement
- triple rejection in the buy-side liquidity
- bullish trend/volume is losing strength in the 5m TF
- take profit is set at 40% of the FVG
- a potential long position at the bullish OB below the FVG

KAVA: Resistance BreakoutKava (KAVA) technical analysis:
Trade setup : Kava has traded completely against the market in recent week or two. This is bullish as it shows that there’s demand for the asset regardless of the overall bearish market sentiment. Price broke thru $1.00 resistance and 200 day moving average, which are signs of Uptrend. However, it appears to be overbought with RSI ~ 70. We wait for price to retest this resistance breakout.
Trend : Uptrend on Short- and Medium-Term basis and Downtrend on Long-Term basis.
Momentum is Bullish (MACD Line is above MACD Signal Line and RSI is above 55).
Support and Resistance : Nearest Support Zone is $0.76, then $0.50. The nearest Resistance Zone is $1.00, which it broke, then $1.15, and $1.40.
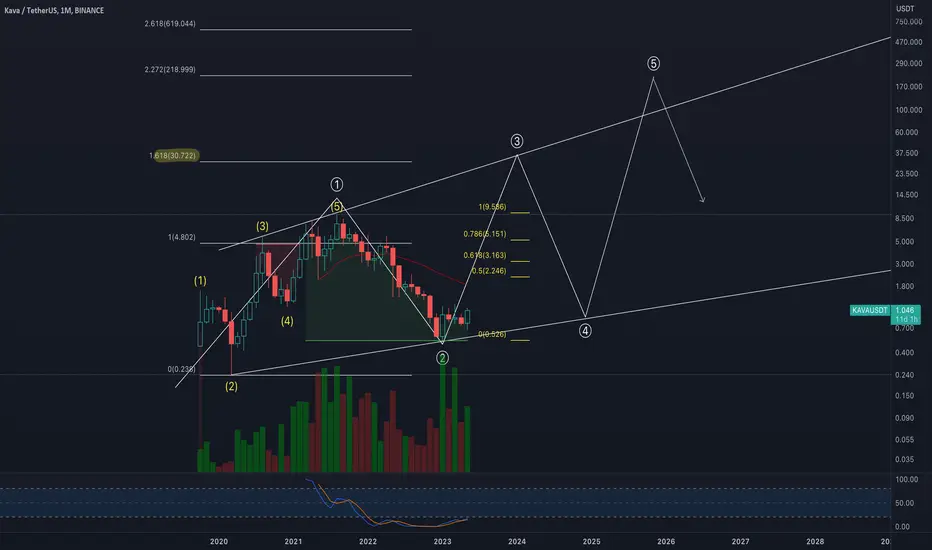
KAVAI have kava bottomed in an expanding diagonal wave 2 back in Oct 2022. Now we slow gind into W3 around $30
KAVAUSDTKAVAUSDT is currently at a strong resistance area, resistance from previous support and falling trendline will push the price to downside?

Kava UsdtKava Usdt Sucessfully bounce back from supportline as well as trend line.
Long Kava Usdt
Entry 0.98, 0.97
TP. 1.03, 1.05
SL: 0.94

KAVA ANALYSIS (1D)Many questions are asked about the KAVA movement process.
The chart is not a single scenario and there are many scenarios for price movement.
I marked the least dangerous scenario on the photo.
If the price reaches the green zone, you can enter a long/long position
In the upper parts of the green box, you can enter the position if you receive confirmation to enter the position, and I have only specified the low-risk scenario.

SHORT KAVA/USDTSHORT CRYPTOCAP:KAVA
Will enter SHORT if we go to retest zone 1.10/15 to have easy invalidation ... or loss of level 0.5 on retest ... no rush now


KAVAUSDT → Bullish dynamics on the background of red bitcoin KAVAUSDT shows bullish strength amid a falling market. The price does not follow bitcoin and continues to strengthen.
As almost the entire cryptocurrency market follows bitcoin and has been in the red zone for several days in a row, Kava / TetherUS breaks resistance and bursts forward.
At this point, the important task lies with the bulls. If the buyers manage to keep the price above the 0.800 range, the growth will continue in the medium term. The daily chart shows interest in the market.
The price breaks through the SMA-50 line and now seeks to test the SMA-200 resistance. If this area is broken, the price can form a bullish momentum.
Strong resistance: MA-200, 0.960, 1.140.
Strong support: MA-50, downward boundary of the range.
I expect if the price fixes above the previously broken line, the growth will continue. In this case I will wait for the price movement to 1.400, 2.000
Regards R. Linda!

kavaHi friend
Jast like you see in the chart,the price needs a correction when it hits the resistance area .
I entered the short position in one step and exited the position in several step,which is shown by the red lines
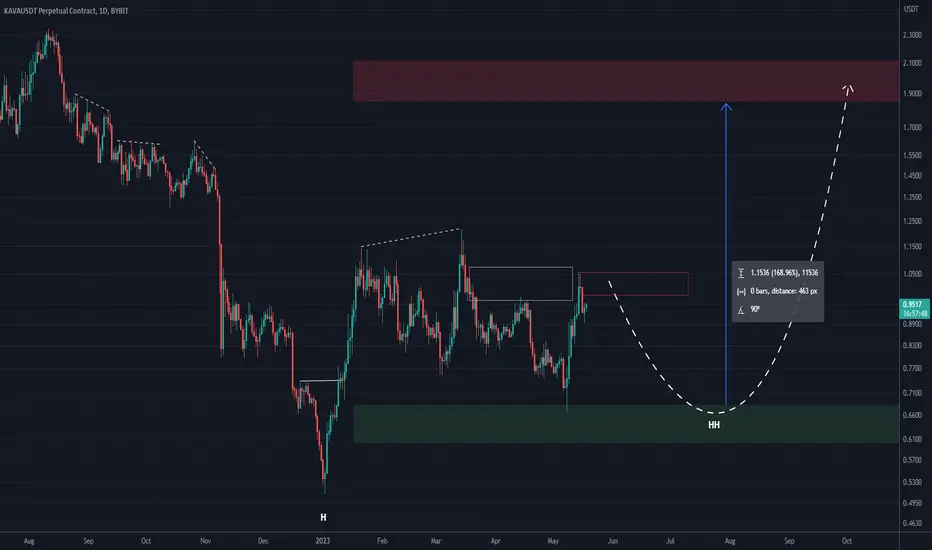
Kava another move is loading Kavausdt
Kavausdt breakout already confirmed wait is for retest incase if successful retest expecting 30-50% bullish move
Dyor

KAVA: Approaching ResistanceKava (KAVA) technical analysis:
Trade setup : Kava has traded completely against the market in recent week or two. This is bullish as it shows that there’s demand for the asset regardless of the overall bearish market sentiment. Price bounced off of $0.75 support zone, which held up several times in 2023 as well and broken back above 200-day MA, which is a indication of potential bullish trend reversal. It’s now approaching $1.00 resistance area, which is a big test. If able to break above $1.00, it would confirm a bullish trend reversal.
Trend : Uptrend on Short-Term basis and Downtrend on Medium- and Long-Term basis.
Momentum is Bullish (MACD Line is above MACD Signal Line and RSI is above 55).
Support and Resistance : Nearest Support Zone is $0.76, then $0.50. The nearest Resistance Zone is $1.00, then $1.15, and $1.40.


Next Pump for KAVAPotential upward movement for KAVA.
If it sinks below the red line, downward trend could continue.
Setting a risky target of 1.16 upward movement

kava short setup Hello Traders, here is the full analysis for this pair, let me know in the comment section below if you have any questions, the entry will be taken only if all rules of the strategies will be satisfied. I suggest you keep this pair on your watchlist and see if the rules of your strategy are satisfied. Please also refer to the Important Risk Notice linked below.
