Kava Another breakout loading Kavausdt
Formed falling wedge pattern daily timeframe in case of breakout expecting 60-80% bullish move incoming days
Do your own research and always manage risk
KAVAUSDT trade ideas

KAVA Surges as Investors Seek Buying OpportunitiesInvestors in the cryptocurrency market are looking for buying opportunities despite the current volatility of Bitcoin and Ethereum. As a result, many traders are turning to bullish altcoins like KAVA, which has been showing steady price growth despite market selling pressure.
KAVA, a native token of the KAVA blockchain, recently completed a higher low price formation above an ascending trend line. From a monthly low of $0.667, KAVA's price has risen by more than 35% in just five days.
KAVA Attempts Breakout
While Bitcoin's price is falling, KAVA's price continues to rise this week. KAVA’s investors seem to be unaffected by a potential drop in Bitcoin's price.
KAVA's price surged towards a bullish hurdle on May 10th, reaching a 20-day high at $0.909 with a remarkable 10.6% gain on Wednesday. Currently, the altcoin is trading against the USDT pair at $0.906.
KAVA's Future Looks Promising
Trading volume indicators suggest that there has been significant accumulation of KAVA coins near the support trendline. KAVA witnessed the highest trading activity in the last few months in the month of May.
The KAVA coin is currently trading above the 50 simple moving average, with bulls pushing the price up. Historically, the 200-SMA has acted as a significant support and resistance level for sellers. The market is now waiting to see if the bulls can maintain their momentum and push the price of KAVA beyond the 200-SMA.
The Relative Strength Index (RSI) has crossed the crucial threshold of 50 and is now steadily climbing towards the upper limit. This is an encouraging sign for potential buyers, who could benefit significantly if the coin manages to break through the current resistance trendline.
However, we will still need to have Bitcoin at least ranging and not falling for a significant rally to occur.

KAVAUSDTKava currency reacted well from the weekly support.
In my opinion, after the first correction, it can move towards resistance areas


Kava needs to retest again the support Kavausdt
I don't think kavausdt is going to break this trendline resistance incase of breakout the other strong horizontal resistance is waiting for kava
Overall I am expecting a dump of 29-35% in kavausdt price
Note : Ideas Are Personal opinion not financial afive always do your own research

KAVA, Riding the Upward Wave with Buyers' SupportKAVA has been exhibiting an upward trend during the weekly timeframe, resulting in a significant 18% price surge in the past 24 hours. This notable increase can be attributed to the support provided by buyers in the market.
Considering the present market conditions, it is crucial for KAVA to avoid a sudden downward reversal and sustain its support around the $0.760 range. If the currency manages to maintain this support level, there is a possibility of another positive price movement, indicating a potential bullish wave.
In terms of short-term resistance levels, KAVA faces its first significant hurdle around the $0.90 range. If the price manages to surpass this level, it could signal further upward momentum. The second resistance level for KAVA is observed around the $1 mark, serving as another important barrier to monitor.
As investors and traders, it is important to closely observe KAVA's performance, particularly its ability to sustain the current support level and navigate through the resistance levels. These factors will provide valuable insights into the potential future movement of KAVA.

KAVA can drop soonHi, dear traders. how are you ? Today we have a viewpoint to SELL/SHORT the KAVA symbol.
For risk management, please don't forget stop loss and capital management
When we reach the first target, save some profit and then change the stop to entry
Comment if you have any questions
Thank You

Kava longKava broke trough the descending trendline. Asset broke trough the resistance level. Bullish movement to resistance level at1.22 is expected to happen.

KAVA LONG #IntradayOn the given instrument the accumulation of volume near the level 0,75, though all market and the coin itself looks down, but locally inside the day I try to trade long. The targets are 0.8, 0.82 and 0.84. It is possible to divide the deal by 2 stops 0.73 and 0.715.
Support the author subscribe ✅ and start rocket 🚀.
Good luck and profit to all.

KAVA is still Bullish, BUT...KAVA is still bullish but the asset is already overheated. Keep an eye on the indicator and SELL/SHORT once you enter the red zone!

#KAVAUSDT | Short | Trade Set-Up#KAVAUSDT | Short | Trade Set-Up
| Don't Forget To Hit Follow To Never Miss An Idea |
| Please Support By Giving This Idea a Boost |
Entry Conditions
| Bearish Signal
| Watch out for untested weekly pivot
| Breakdown on key support and retested
| Retraced nicely for a better entry
| Bearish Divergence
| Broken CVD Trenline & Support

KAVAUSDTHello everyone,
*Mars Signals Team wishes you high profits*
This is a one-day-time frame analysis for KAVAUSDT
Here we have R2 and R1 which are our resistance areas in this chart with their demonstration of the disability of the price to rise at various points. S1 used to be a long-term resistance area. And as you observe, S2 is a support area at the bottom that involves the well support of price at some different points even since the past. Clearly, the price experienced a great support at S1 area and via a notable rise, it could move up to our first resistance line. But after not being supported there, and after having some unsuccessful attempts to rise, it resumed its decline down to S1 area. The existence of a negative Marubozu Candle confirms its falling trend and at the present, we see it is fluctuating in the first support area. We expect it to give us two scenarios after falling to the bottom of S1. Either we would have more support here and the price moves over R1 and fixes there and then more increase takes place for it toward R2 (that is a proper point to save your profits) Even it is probable that the price falls down to S2 after losing the support at S1 and there we can wait for the support of price and on its returning process, it is better to put your trade orders and then wait for more increase. According to the chart and considering the signs here, when the price is fluctuating above S1, we won’t have so much decline. So please consider the market situation in lower time frames and then decide what to do exactly. We suggest you to save your profits in the resistance areas due to the fact that in the decline of the price, you will not have so much loss. Keep moving with our updates and analyses to have multiple pieces of information and ideas.
Warning: This is just a suggestion and we do not guarantee profits. We advise you to analyze the chart before opening any positions.
Have a nice time

kavakava is in imp support if it is broken we can open a short positon but in the gray line in the chart I will save profit

Kava USDTKava USDT sucessfully breakout in 1 Hr. chart.
Long Kava Usdt
Entry Price: 0.7739, 0.77
TP: 0.7844, 0.7967
SL.0.76

KAVA LONGLet's try to take advantage of BTC's upward momentum to open some longs in altcoins, CRYPTOCAP:KAVA has hit its lower OB which as we can see with 25% is a good OB that could work as a support zone.

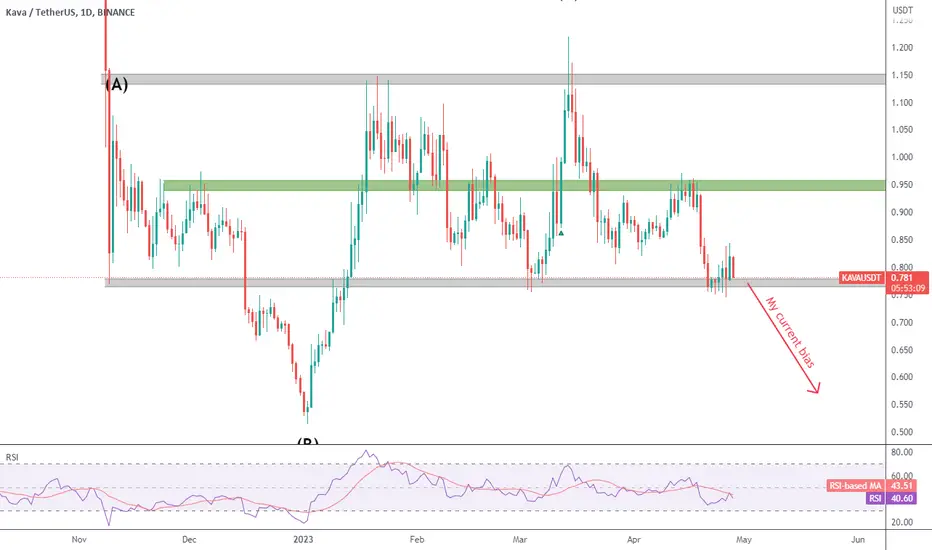
KAVA - Biased to the downside
I now have a primary bearish count for KAVA, since price action is compatible with an expanded flat (black ABC).
We have 2 major channel boundaries (gray zones), and a mid-channel resistance (green zone).
A break of the channel support could lead us to new lower lows. Just be mindful of false breaks (I´d wait for a break / retest before shorting).
KAVAUSDT last chance before "sell in May & run away)?Full stoch reset.
ROC >-5
UO implies for a rally
3 consecutive dowdays and seems selling pressure fading.
plus participation implies we must have final rally before mid of May.
so I go long at Monday. it may run very high, till 3 usd or higher.

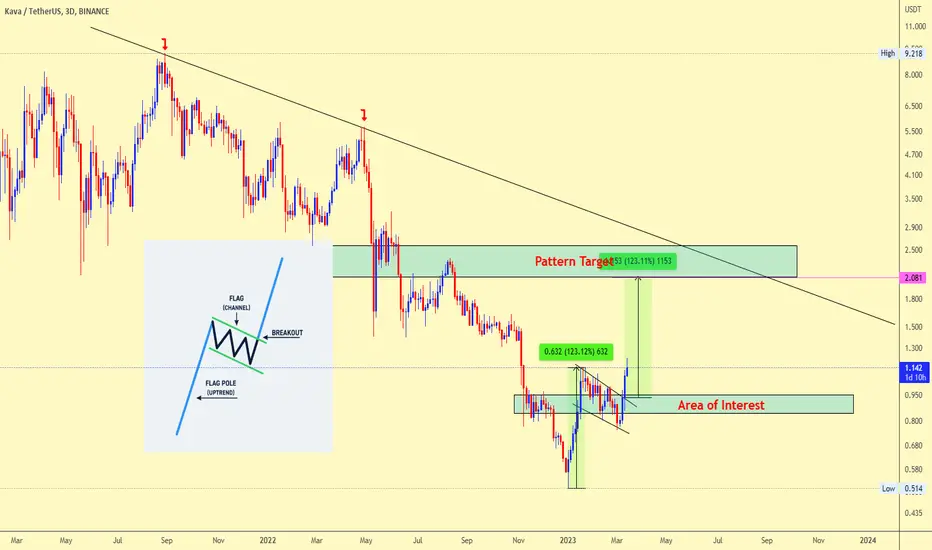
KAVAUSDT Breakout AlertHello, crypto enthusiasts! Today we have an exciting update on the KAVAUSDT trading pair, as technical analysis indicates a potential breakout from a bullish flag and pole structure. This pattern suggests that KAVAUSDT may be on the verge of a significant move upwards, with a price target of $2.081. Let's dive into the details.
Technically speaking, KAVAUSDT chart shows the formation of a bullish flag and pole structure, a pattern that often indicates a potential upward trend continuation. The "pole" is characterized by a strong, sharp price increase, while the "flag" is a brief consolidation period marked by a downward sloping parallel channel.
In the case of KAVAUSDT, the price has been trading within this flag pattern for some time, signaling that the market is gathering momentum for the next move. The breakout from the bullish flag could lead to a continuation of the upward trend, which brings us to the target price of $2.081.
Major area to watch is the AREA of Interest shown on the chart. As always, it's crucial to use proper risk management strategies and monitor the key support and resistance levels. Keep a close eye on the KAVAUSDT chart in the coming days, and happy trading!
Enjoy.
KAVA - ready to drink this CAVAthere are two possible entry points and a very tight stop loss below entry 2.
looks all set to rock n roll.
lets see if it rolls...

KAVA upside potentialthis is my kava trade, dont recommend to trade it.
if you will open a small position size because of the current market conditions.
the overall market is overheated.

$KAVA #kunhothotKAVA 1.3-1.4 is possible the confluence resistance zone
1. Bat Pattern
2. 61.8AB=161.8CD
3. POI
4. VWAP Band a and b area


Potential fill on KAVA Imbalance and Bullish OrderblockI see a potential fill to a Fair Value Gap and a Bullish Order for KAVA
Risk 2% on this trade:
This is an example of a continuation setup of my MATIC play from yesterday!
