KAVAKAVA must flip .91c then it will confirm my wave 3. Because the rest of the crypto markets are very bullish, their are many lagging 2021 coin and also 2017 coins. I think they will catch up soon.
KAVAUSDT trade ideas

#KAVA/USDT trying to reclaim the Diagonal Trendline#KAVA/USDT trying to reclaim the Diagonal Trendline and PWL $0.73 support level in 4-Hour TF!
$KAVA needs to reclaim the support to gain the bullish momentum. Wait for candle closing above it to long it.

KAVA/USDT Break and Bullish Momentum ??? KAVA Analysis Today 💎 KAVA has undoubtedly captured the market's attention. Presently, KAVA has broken out of the Descending channel and has entered a confirmed retesting phase. Observations indicate that after its retest on the resistance trendline of the channel, KAVA experienced a sharp upward trajectory, potentially aiming for the resistance zone.
💎 Should KAVA decisively surpass the notable resistance at $0.730 and sustain above it, there's a strong possibility for the coin to continue its bullish run, Probability targeting the supply zone and the bearish OB.
💎 However, if KAVA faces a setback at the resistance zone, it might retreat towards its proximate support to gather momentum. There's also a chance that KAVA could descend to the demand zone to build a more robust momentum for another attempt at breaking the resistance.
💎 if KAVA revisits the demand zone and fails to uphold its position, it could indicate a bearish trend. This would mean a potential downward spiral for KAVA, with the coin possibly gravitating towards its key support zone.


💡Trade Idea #KAVA/USDT:Still looking at the charts on Friday 24/. #KAVA looks like it is ready to go for another leg up, but it struggles to get through this 1D resistance level.

#KAVA/USDT - Long - Potential 89.95%In mid October just as BTC started getting its act together KAVA touched what appears to be its floor price support at 0.565. It hit this price last in Jan 2023 when post FTX the market was bottoming. Previously we've only been below this price for a few months in early 2020.
This support sits in the middle of a big order block which following the support touch has seen price bounce dramatically - not sure what your long term plan is but bouncing back from floor price support is a good sign to go long.
In terms of technicals we can draw in two distinct bullish falling wedge patterns, one from the big May price spike (dotted line - Mainnet launch?) and one from the tighter downtrend that started mid July (solid white line) either way we have a textbook breakout and have crossed the 20 and 50 moving averages - a move that usually triggers lots of automated buys and is probably contributing to the buy order block that occured around this price point.
The RSI though is what I'm most focussed on. On these longer timeframes RSI breakouts are very strong indictaors. The KAVA RSI breakout is near prefect. A 6 month downtrend from overbought to oversold with the break occuring exactly as we reversed from oversold and still to cross the halfway point to overbought indictaing plenty of remaining bullish momentum.
Drawbacks are - yet to cross the 200MA. We've tested it 3 times this year (March, May and June) and been rejected 3 times. Big sell orders seem to be active between 0.897 and 1.076, this resistance has capped growth all year and prevented KAVA running up like BTC. We'll need big volume to breakout here so we are likely dependant on the total market cap expanding for that (so basically despite its bullish chart we're still at the mercy of BTC - luckily BTC has the ETF's and Halving which should massively increase volumes and via the old 'ALT cycle' KAVA should catch some of that trickledown volume). Last one is a confirmation retrace from here is possible esp. if we see BTC correct short term. Big breakouts often run out of volume and need to dip back into the liquidity which pumped them initially. This often visually looks like price retracing to the top of the broken trendline (where hopefully buy orders remain) before pumping again. This is very possible here with BTC also likely to do the same and lead the market.
Lastly targets. As always I use a FIB and then adjust of rorder blocks so my first target would be 0.897 which lines up closely with the 0.382 fib (adjusted for the sell orders below it), 1.048 - the 0.5 fib at the top of the sell block (tbh if I was actually trading this I'd probably take profit next at 0.99 just because the of the psych $1 point), 1.166 the 0.618 fib level we can see is strong resistance at the start of this market cycle) and finally 1.336 the fib 0.786 just because!
If you are already in profit and just wat an exit you could also look at taking profit at the 200MA as mentioned this has been tough resistance all year.
If you need an ATH type move then hold with the bull run KAVA has a partnership with INJ which I'm very bullish on and tether so falls into the category of real project with actual utility - i.e potential to capitalise on a bullish market over the next 12-18 months.

KAVAUSDT (4H) - Bullish breakoutHi Traders
KAVAUSDT (4H Timeframe)
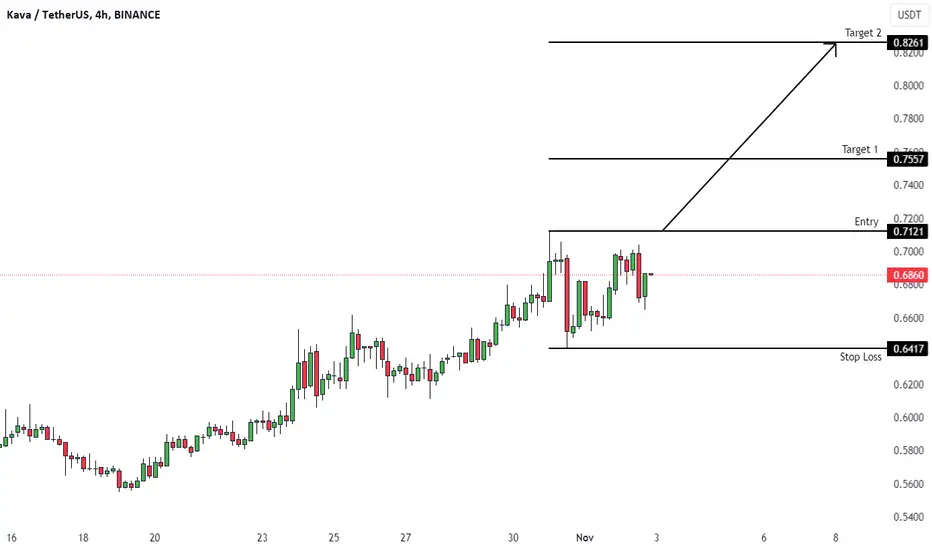
The market is in an uptrend, and we are waiting for an entry signal to go LONG above the 0.7121 resistance level. Only the downward break of 0.6417 would cancel the bullish scenario.
Trade details
Entry: 0.7121
Stop loss: 0.6417
Take profit 1: 0.7557
Take profit 2: 0.8261
Score: 8
Strategy: Bullish breakout
KAVA Long OpportunityNot a lot to this trade, beside longs rotating toward KAVA probably by mid November to hit this target.
Good luck!

kava breaking multi year downtrend sems like preparing for massive recovery formed and breaking falling wedge in 3 days timeframe expecting successful breakout soon trend line is weak due to multiple tests
incase of successful breakout expecting massive recovery in coming days expecting move towards 2.50$ keep eyes on kava and try to catch some after breakout

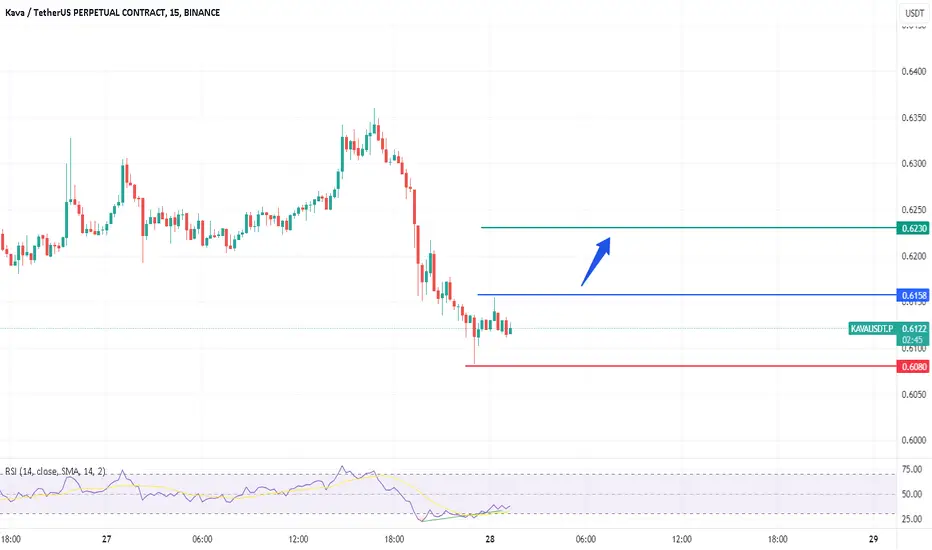
Keeping an eye on #KAVA/USDT Trendline in 1-Hour TF!Keeping an eye on #KAVA/USDT Trendline in 1-Hour TF!
$KAVA holding the PWH $0.607 support really well, and I am expecting some more upwards momentum.
The local resistance level is PDH $0.6485. I am expecting a scenario like this.

KAVA/USDT 4HKAVA forms a falling wedge pattern. After a retest of our top resistance, we should hit the first target soon.

Kavausdt Hi everybody
I'm Mehrab
my trades based on Sam seiden /supply and demand /
in this asset
we see good pullback to our base that have 5 option *moveout-breakout and the other

KAVAUSDT-15M-TRENDREVERSALKAVAUSDT will possibly reverse the trend in a 15m time frame because it is making some diversion on rsi and it has a bullish order block near daily resistance
KAVA/USDT 1 Day long position setupBINANCE:KAVAUSDT - 1-day long position setup
KAVA Failing Wedge showing good Reversal at this point .6100 to .6300 Level.
Bullish divergence is suggesting that upward movement is likely in the coming days
Overall, this is a bullish setup for KAVA/USDT, and a long position could be considered.
Please note that this is not financial advice, and you should always do your own research before making any investment decisions.

Try good long. RR 1/10 KAVAI expect a good upward movement after the weekend. We will also get a good entry point for the spot in the long term.

KAVAUSD ❕ broke up the downtrend lineKAVA has fixed above 50EMA on the 1H TF.
RSI indicates that the initiative is shifting to the bulls.
I believe that the asset will grow after fixing above the support.
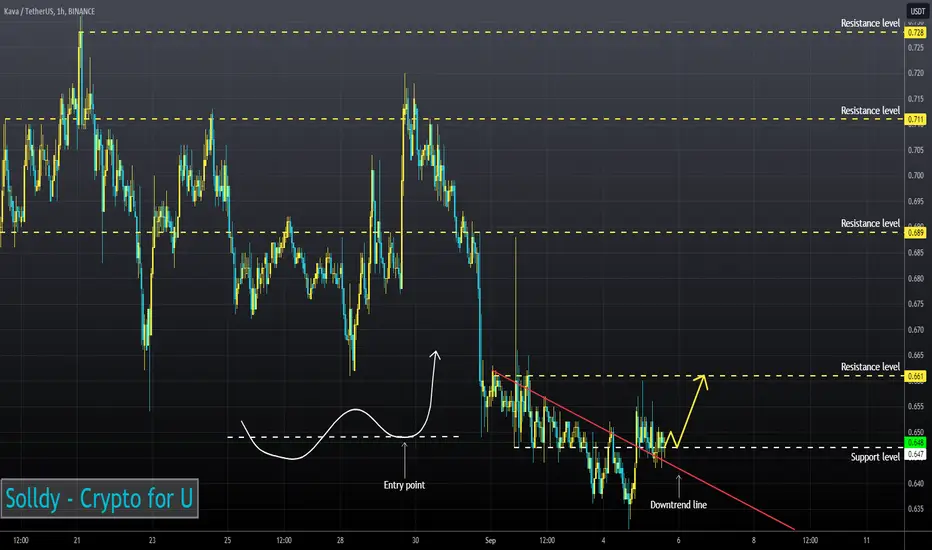
Kava long position As we can see kava is on the verge of breaking out. We have double bottom, price on a psychological level and also on a bullish order block. A breakout from the trend line and we go long. Exit market when price hits the 61.8 fib level. Remember btc determines the market trend. So trade with caution. Like, comment and follow to support me to continue doing this. Let go

KAVA/USDT📈 Our Trading Strategy: We use powerful tools like Phibo and volume indicators to spot where market makers are positioning themselves. By analyzing candlestick patterns and volume, we pinpoint potential market moves. Then, we trade alongside these influential players to maximize gains.
We watch for volume spikes and specific candlestick patterns that indicate their positions. This insight guides our trading decisions.
💼 Example: KAVA/USDT: We've identified key purchase and sell zones for the KAVA/USDT trading pair. This helps us make informed trades within these zones, based on market maker behavior.
🚀 Join our VIP Channel: For more trade opportunities and expert guidance, consider joining our VIP channel. Get exclusive insights and support to enhance your trading success.

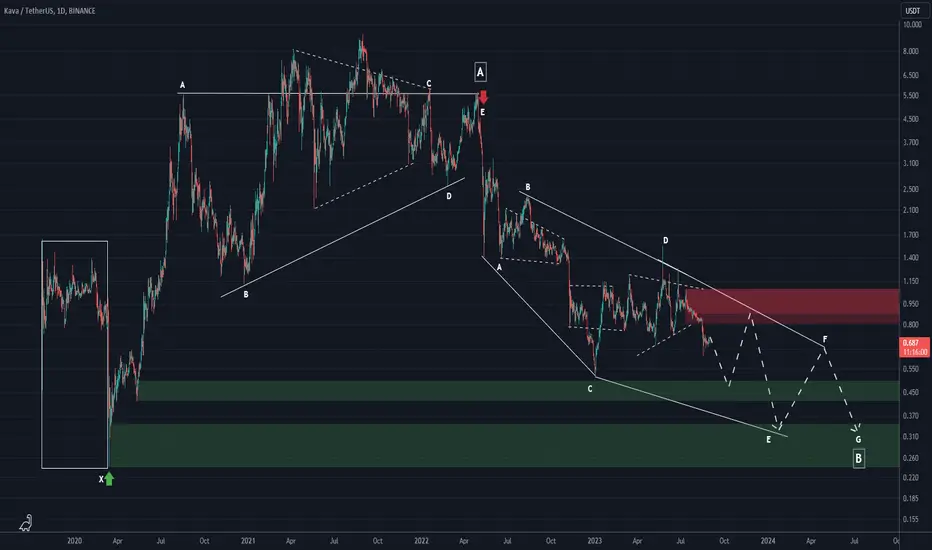
KAVA ROADMAP (1D TF)It seems that we are inside the diametric diamond of the big B wave.
It seems that we are now in wave E of this diametric.
Green areas are relatively strong support areas.
In terms of time, each branch is between 48 and 150 bar.
We have plotted the fluctuations that we expect from KAVA in the daily time frame.
We have plotted the fluctuations that we expect from KAVA in the daily time frame.
For risk management, please don't forget stop loss and capital management
Comment if you have any questions
Thank You
KAVAUSDT.PBEARISH? OR BULLISH for today? I don't know but let's wait for a sign. Rejection at the 50% level of that OB is good for BULLISH move. A break of that zone gives a sell signal... Let's have it

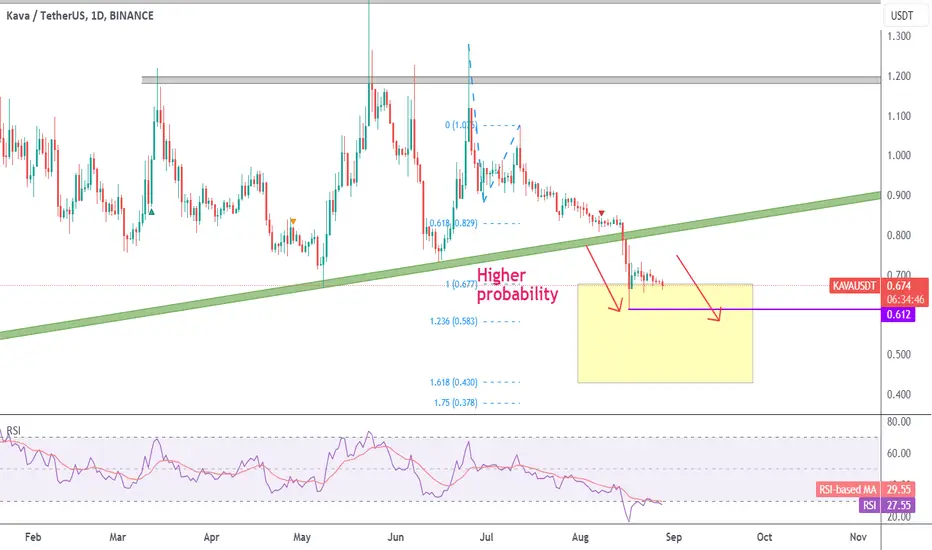
KAVA - Yellow box reached, further downside expected
We have broken down from the trendline, and the yellow target box has been reached.
Since we don't have RSI divergence, I still expect another lower low under 0.612.
✴️ Kava | Cryptocurrency Trading Made Easy: Plain & SimpleLook at this "inverse" signal.
We are going to look at the positive on a negative.
KAVAUSDT Weekly:
8 weeks straight closing red.
After mid-May we had 3 weeks red followed by a bounce, 1 week green and then the eight consecutive red weeks.
This is good as now the bias turns bullish.
Notice the size of the last candle and also the long lower wick.
Now we focus on the daily timeframe and we can easily see that this strong bearishness is over.
The RSI went oversold and the last three days have been green. While this isn't much, it is still the best Kava has seen since June.
This is a full flush and now the potential is up.
Stop-loss = low risk.
High potential for reward.
Meaning, if it drops, you stop the trade at a small loss.
The drop is low probability but can still happen.
If it goes up, we have a winner and the upside potential is huge.
Buy low/red/near support.
Sell high/green/near resistance.
Plain and simple.
Namaste.

KAVAUSDT is testing the dynamic supportThe price of KAVAUSDT is currently in a critical technical situation with regards to its support levels:
Dynamic Daily Support: The price is currently testing the dynamic daily support level around the $0.84 area. A dynamic support level is often associated with a moving average or a trendline that reacts to recent price action. Testing this level indicates that the price has found some form of support in this region.
Weekly Support: Additionally, there is a stronger support level at the $0.75 area on the weekly timeframe. This indicates that historically, the price has found significant buying interest around this price level, preventing further downward movement.
Given this situation:
If the price manages to hold above the dynamic daily support at $0.84 and potentially bounces back from this level, it could signal that the support is still valid and that buyers are active in defending this price zone.
However, if the price loses the dynamic daily support at $0.84, the next area of potential support could be the $0.75 area, which is the weekly support level. This level has a historical significance in terms of price reactions.
In the event that the $0.75 support level also fails to hold, the next possible area of interest for traders might be around the $0.5 area. This would be based on the assumption that historical price action might influence market behavior around this level.
–––––
Follow the Shrimp 🦐
Keep in mind.
🟣 Purple structure -> Monthly structure.
🔴 Red structure -> Weekly structure.
🔵 Blue structure -> Daily structure.
🟡 Yellow structure -> 4h structure.
⚫️ Black structure -> <= 1h structure.
Follow the Shrimp 🦐
